Explore
 Validate
 Learn
Learn Western blot
Antibody data
- Antibody Data
- Antigen structure
- References [1]
- Comments [0]
- Validations
- Western blot [2]
- Immunocytochemistry [3]
- Immunohistochemistry [2]
- Other assay [1]
Submit
Validation data
Reference
Comment
Report error
- Product number
- MA5-31575 - Provider product page

- Provider
- Invitrogen Antibodies
- Product name
- EEA1 Monoclonal Antibody (GT10811)
- Antibody type
- Monoclonal
- Antigen
- Synthetic peptide
- Description
- Keep as concentrated solution.
- Antibody clone number
- GT10811
- Concentration
- 1 mg/mL
Submitted references A Short ERAP2 That Binds IRAP Is Expressed in Macrophages Independently of Gene Variation.
Mattorre B, Caristi S, Donato S, Volpe E, Faiella M, Paiardini A, Sorrentino R, Paladini F
International journal of molecular sciences 2022 Apr 29;23(9)
International journal of molecular sciences 2022 Apr 29;23(9)
No comments: Submit comment
Supportive validation
- Submitted by
- Invitrogen Antibodies (provider)
- Main image
- Experimental details
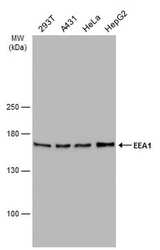
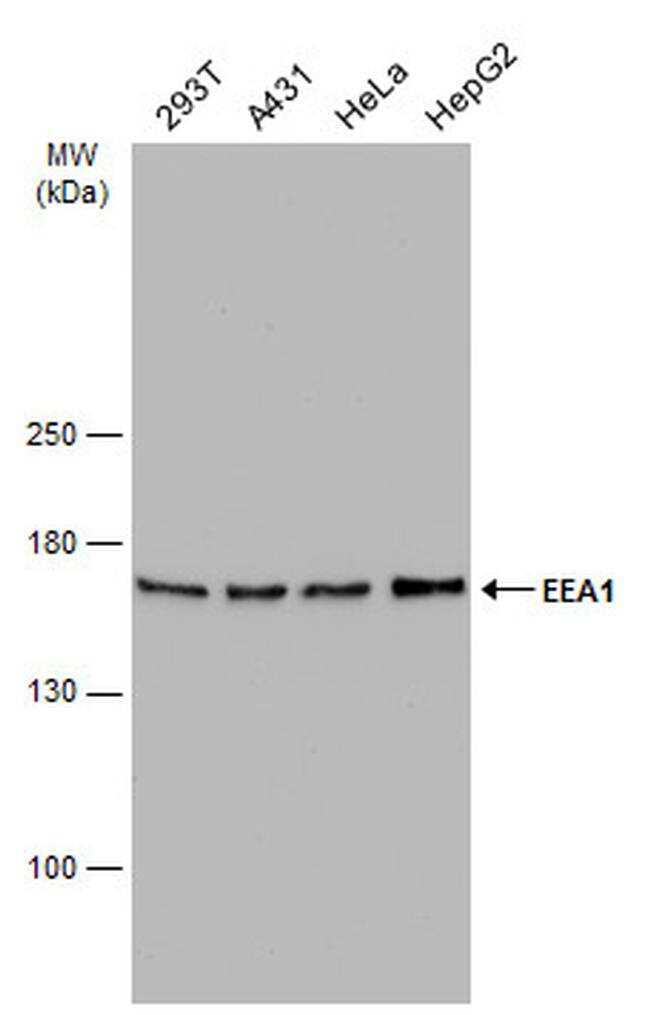
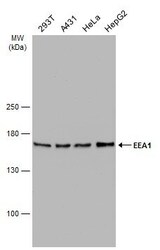
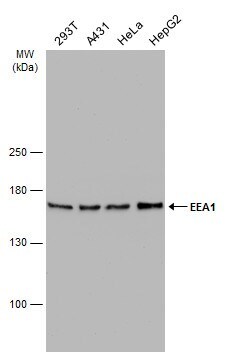
- Western blot analysis of EEA1 in various whole cell extracts using EEA1 monoclonal antibody (Product # MA5-31575) using 30 µg of sample at a dilution of 1:5000. Sample was then incubated with HRP-conjugated anti-mouse IgG secondary antibody. Prior to incubation with primary antibody, the sample was separated on 5% SDS-PAGE.
- Submitted by
- Invitrogen Antibodies (provider)
- Main image
- Experimental details
- Western Blot using EEA1 Monoclonal Antibody (GT10811) (Product # MA5-31575). Various whole cell extracts (30 µg) were separated by 5% SDS-PAGE, and the membrane was blotted with EEA1 Monoclonal Antibody (GT10811) (Product # MA5-31575) diluted at 1:5,000. The HRP-conjugated anti-mouse IgG antibody was used to detect the primary antibody.
Supportive validation
- Submitted by
- Invitrogen Antibodies (provider)
- Main image
- Experimental details
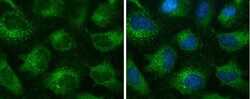
- Immunocytochemistry-Immunofluorescence analysis of EEA1 was performed in HeLa cells fixed in 4% paraformaldehyde at RT for 15 min. Green: EEA1 Monoclonal Antibody (GT10811) (Product # MA5-31575) diluted at 1:500. Blue: Hoechst 33342 staining.

- Submitted by
- Invitrogen Antibodies (provider)
- Main image
- Experimental details
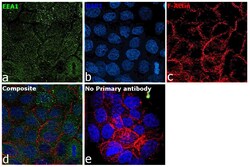
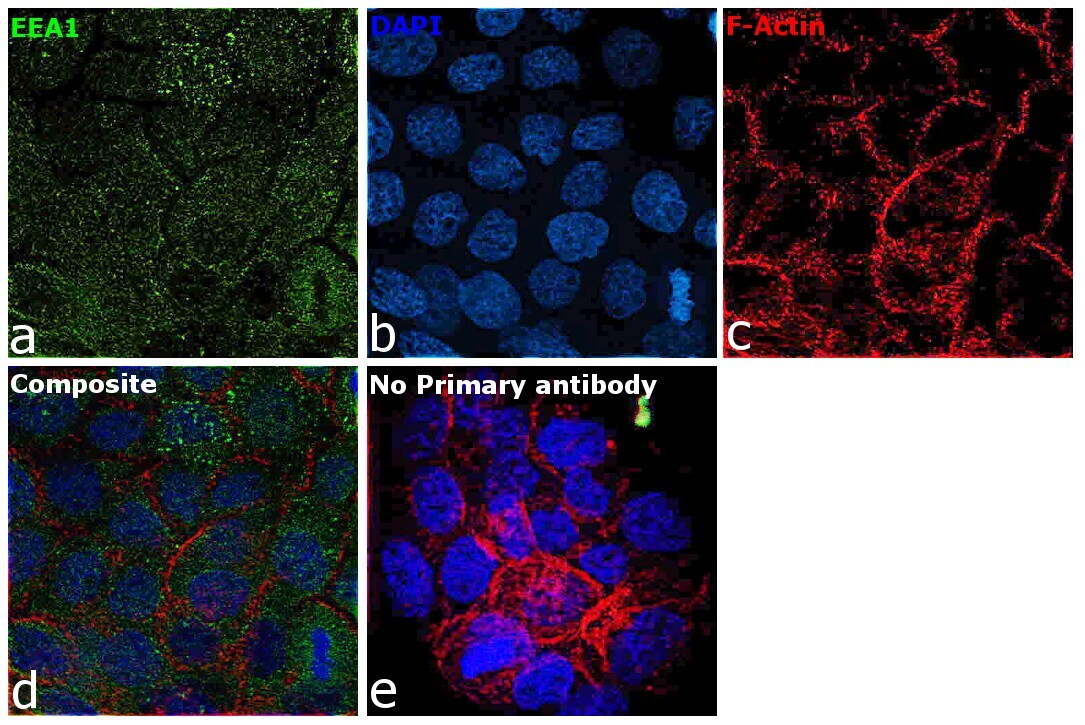
- Immunofluorescence analysis of EEA1 was performed using 70% confluent log phase A-431 cells. The cells were fixed with 4% paraformaldehyde for 15 minutes, permeabilized with 0.1% Triton™ X-100 for 10 minutes, and blocked with 2% BSA for 45 minutes at room temperature. The cells were labeled with EEA1 Monoclonal Antibody (GT10811) (Product # MA5-31575) at 1:100 dilution in 0.1% BSA, incubated at 4 degree celsius overnight and then labeled with Donkey anti-Mouse IgG (H+L) Highly Cross-Adsorbed Secondary Antibody, Alexa Fluor Plus 488 (Product # A32766), (1:2000 dilution), for 45 minutes at room temperature (Panel a: Green). Nuclei (Panel b:Blue) were stained with ProLong™ Diamond Antifade Mountant with DAPI (Product # P36962). F-actin (Panel c: Red) was stained with Rhodamine Phalloidin (Product # R415, 1:300 dilution). Panel d represents the merged image showing endosomal localization. Panel e represents control cells with no primary antibody to assess background. The images were captured at 60X magnification.
- Submitted by
- Invitrogen Antibodies (provider)
- Main image
- Experimental details
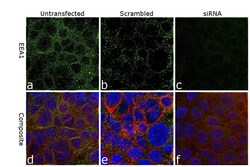
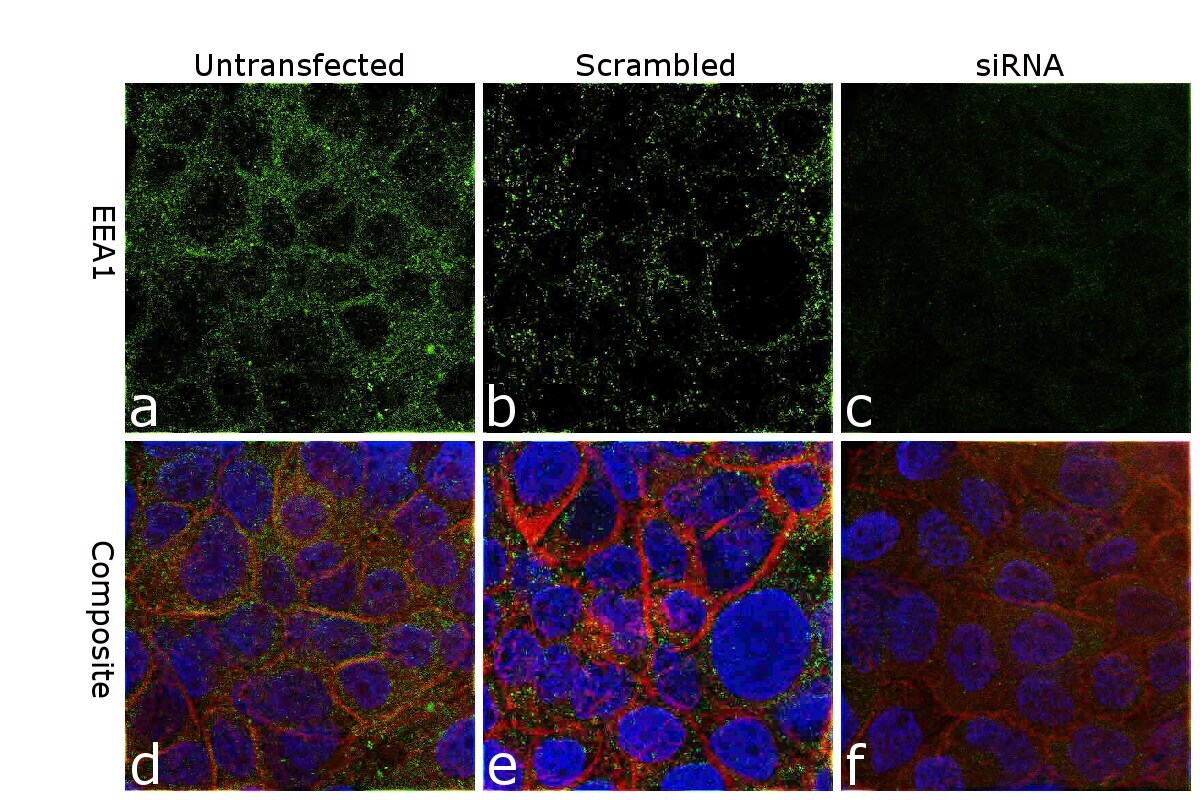
- Knockdown of EEA1 was achieved by transfecting A-431 cells with EEA1 specific siRNA (Silencer® select Product # S15969, S15971). Immunofluorescence analysis was performed on untransfected A-431 cells (panel a,d), transfected with non-specific scrambled siRNA (panels b,e) and transfected with EEA1 specific siRNA (panel c,f). Cells were fixed, permeabilized, and labelled with EEA1 Monoclonal Antibody (GT10811) (Product # MA5-31575, 1:100 dilution) followed by Donkey anti-Mouse IgG (H+L) Highly Cross-Adsorbed Secondary Antibody, Alexa Fluor Plus 488 (Product # A32766), (1:2000 dilution). Nuclei (blue) were stained using ProLong™ Diamond Antifade Mountant with DAPI (Product # P36962), and Rhodamine Phalloidin (Product # R415, 1:300 dilution) was used for cytoskeletal F-actin (Red) staining. A decrease in the intensity of the specific signal was observed upon siRNA-mediated knockdown (panel c,f) confirming the specificity of the antibody to EEA1 (Green). The Images were captured at 60X magnification.
Supportive validation
- Submitted by
- Invitrogen Antibodies (provider)
- Main image

- Experimental details
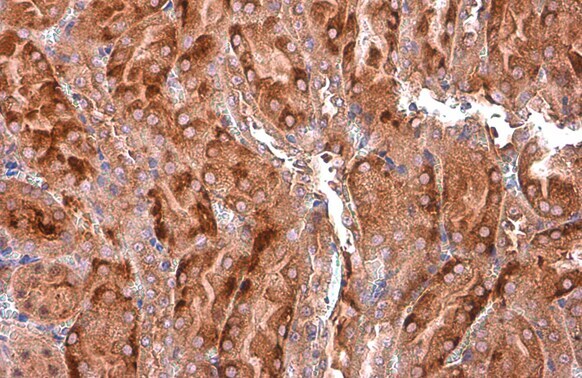
- Immunohistochemistry (Paraffin) analysis of EEA1 was performed in paraffin-embedded mouse kidney tissue using EEA1 Monoclonal Antibody (GT10811) (Product # MA5-31575) at a dilution of 1:200. Antigen Retrieval: Citrate buffer, pH 6.0, 15 min.
- Submitted by
- Invitrogen Antibodies (provider)
- Main image
- Experimental details
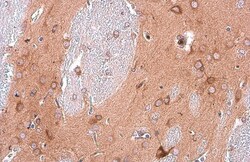
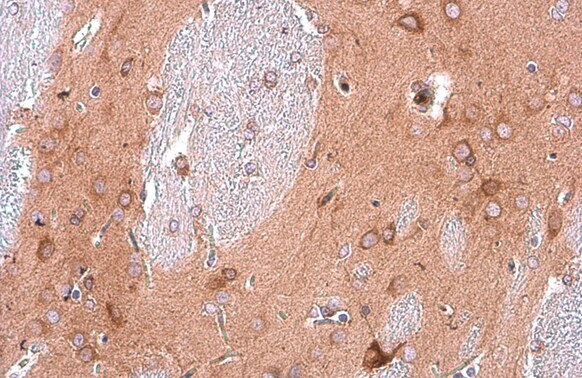
- Immunohistochemistry (Paraffin) analysis of EEA1 was performed in paraffin-embedded rat brain tissue using EEA1 Monoclonal Antibody (GT10811) (Product # MA5-31575) at a dilution of 1:200. Antigen Retrieval: Citrate buffer, pH 6.0, 15 min.
Supportive validation
- Submitted by
- Invitrogen Antibodies (provider)
- Main image
- Experimental details
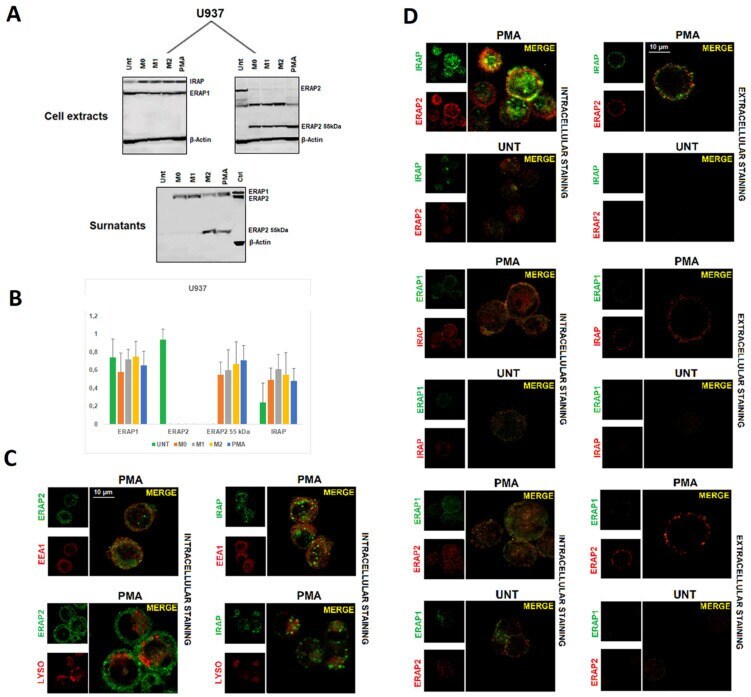
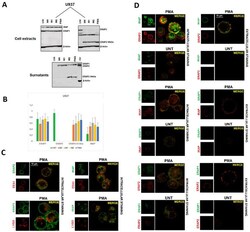
- Figure 2 ERAP1, ERAP2, and IRAP expression in U937 cell line. ( A ) Western Blot analysis of ERAP1, ERAP2, and IRAP expression in U937 cells that were untreated or differentiated to macrophages by different stimuli (see text): membranes were blotted with anti-ERAP1, anti-ERAP2, and anti-IRAP MoAbs. Images of anti-ERAP2 are shown separately to highlight the bands specific for the anti-ERAP2 MoAb. The respective surnatants were blotted with the three antibodies (IRAP not shown). Control (Ctrl): protein extract from B-LCL (EBV + B-lymphoblastoid cell line genotyped A/A at rs2248374). Results shown are representative of 3 independent experiments. ( B ) Densitometric analysis: the intensity of bands was quantified using the program UN-SCAN-IT gel (Silk Scientific Inc., Orem, UT, USA). Results were evaluated as the ratio of intensity between relevant protein and beta Actin from the same sample. Values are the mean + SD of three independent experiments. ( C ) Confocal images of two-by-two combinations of ERAP1, ERAP2, and IRAP in U937 cells treated with PMA or untreated. Co-localization was determined based on the overlap coefficient according to Manders, which was automatically calculated by ZEISS Zen Software. Left panel: intracellular staining of permeabilized U937 cells. Right panel: extracellular staining of permeabilized cells. Results shown are representative of three independent experiments. ( D ) Images show the co-localization of ERAP2 with IRAP in either the endosomes (up