Explore
 Validate
 Learn
Learn Western blot
Antibody data
- Antibody Data
- Antigen structure
- References [3]
- Comments [0]
- Validations
- Western blot [2]
- Immunocytochemistry [1]
- Immunohistochemistry [1]
- Other assay [6]
Submit
Validation data
Reference
Comment
Report error
- Product number
- PA5-20426 - Provider product page

- Provider
- Invitrogen Antibodies
- Product name
- BRCC3 Polyclonal Antibody
- Antibody type
- Polyclonal
- Antigen
- Synthetic peptide
- Description
- A suggested positive control is MCF7 cell lysate. PA5-20426 can be used with blocking peptide PEP-0543.
- Reactivity
- Human, Mouse, Rat
- Host
- Rabbit
- Isotype
- IgG
- Vial size
- 100 µg
- Concentration
- 1 mg/mL
- Storage
- Maintain refrigerated at 2-8°C for up to 3 months. For long term storage store at -20°C
Submitted references RPA3 is a potential marker of prognosis and radioresistance for nasopharyngeal carcinoma.
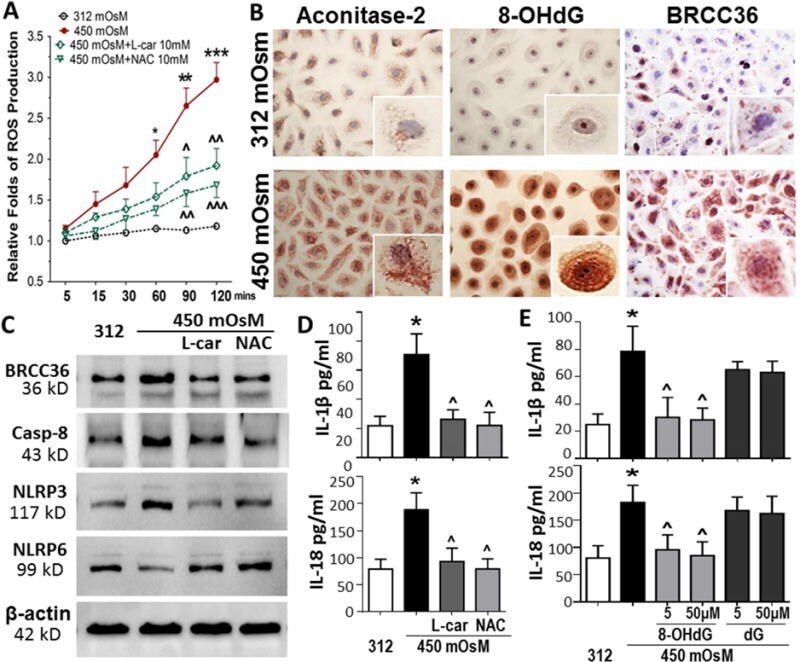
Mitochondrial DNA oxidation induces imbalanced activity of NLRP3/NLRP6 inflammasomes by activation of caspase-8 and BRCC36 in dry eye.
BRCC3 acts as a prognostic marker in nasopharyngeal carcinoma patients treated with radiotherapy and mediates radiation resistance in vitro.
Qu C, Zhao Y, Feng G, Chen C, Tao Y, Zhou S, Liu S, Chang H, Zeng M, Xia Y
Journal of cellular and molecular medicine 2017 Nov;21(11):2872-2883
Journal of cellular and molecular medicine 2017 Nov;21(11):2872-2883
Mitochondrial DNA oxidation induces imbalanced activity of NLRP3/NLRP6 inflammasomes by activation of caspase-8 and BRCC36 in dry eye.
Chi W, Hua X, Chen X, Bian F, Yuan X, Zhang L, Wang X, Chen D, Deng R, Li Z, Liu Y, de Paiva CS, Pflugfelder SC, Li DQ
Journal of autoimmunity 2017 Jun;80:65-76
Journal of autoimmunity 2017 Jun;80:65-76
BRCC3 acts as a prognostic marker in nasopharyngeal carcinoma patients treated with radiotherapy and mediates radiation resistance in vitro.
Tu Z, Xu B, Qu C, Tao Y, Chen C, Hua W, Feng G, Chang H, Liu Z, Li G, Jiang C, Yi W, Zeng M, Xia Y
Radiation oncology (London, England) 2015 May 30;10:123
Radiation oncology (London, England) 2015 May 30;10:123
No comments: Submit comment
Supportive validation
- Submitted by
- Invitrogen Antibodies (provider)
- Main image
- Experimental details
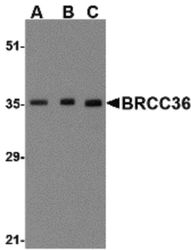
- Western blot analysis of MCF7 cell lysate using a BRCC36 polyclonal antibody (Product # PA5-20426) at (A) 0.5, (B) 1 and (C) 2 µg/mL.

- Submitted by
- Invitrogen Antibodies (provider)
- Main image
- Experimental details
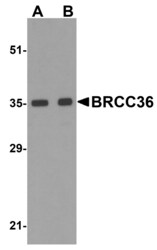
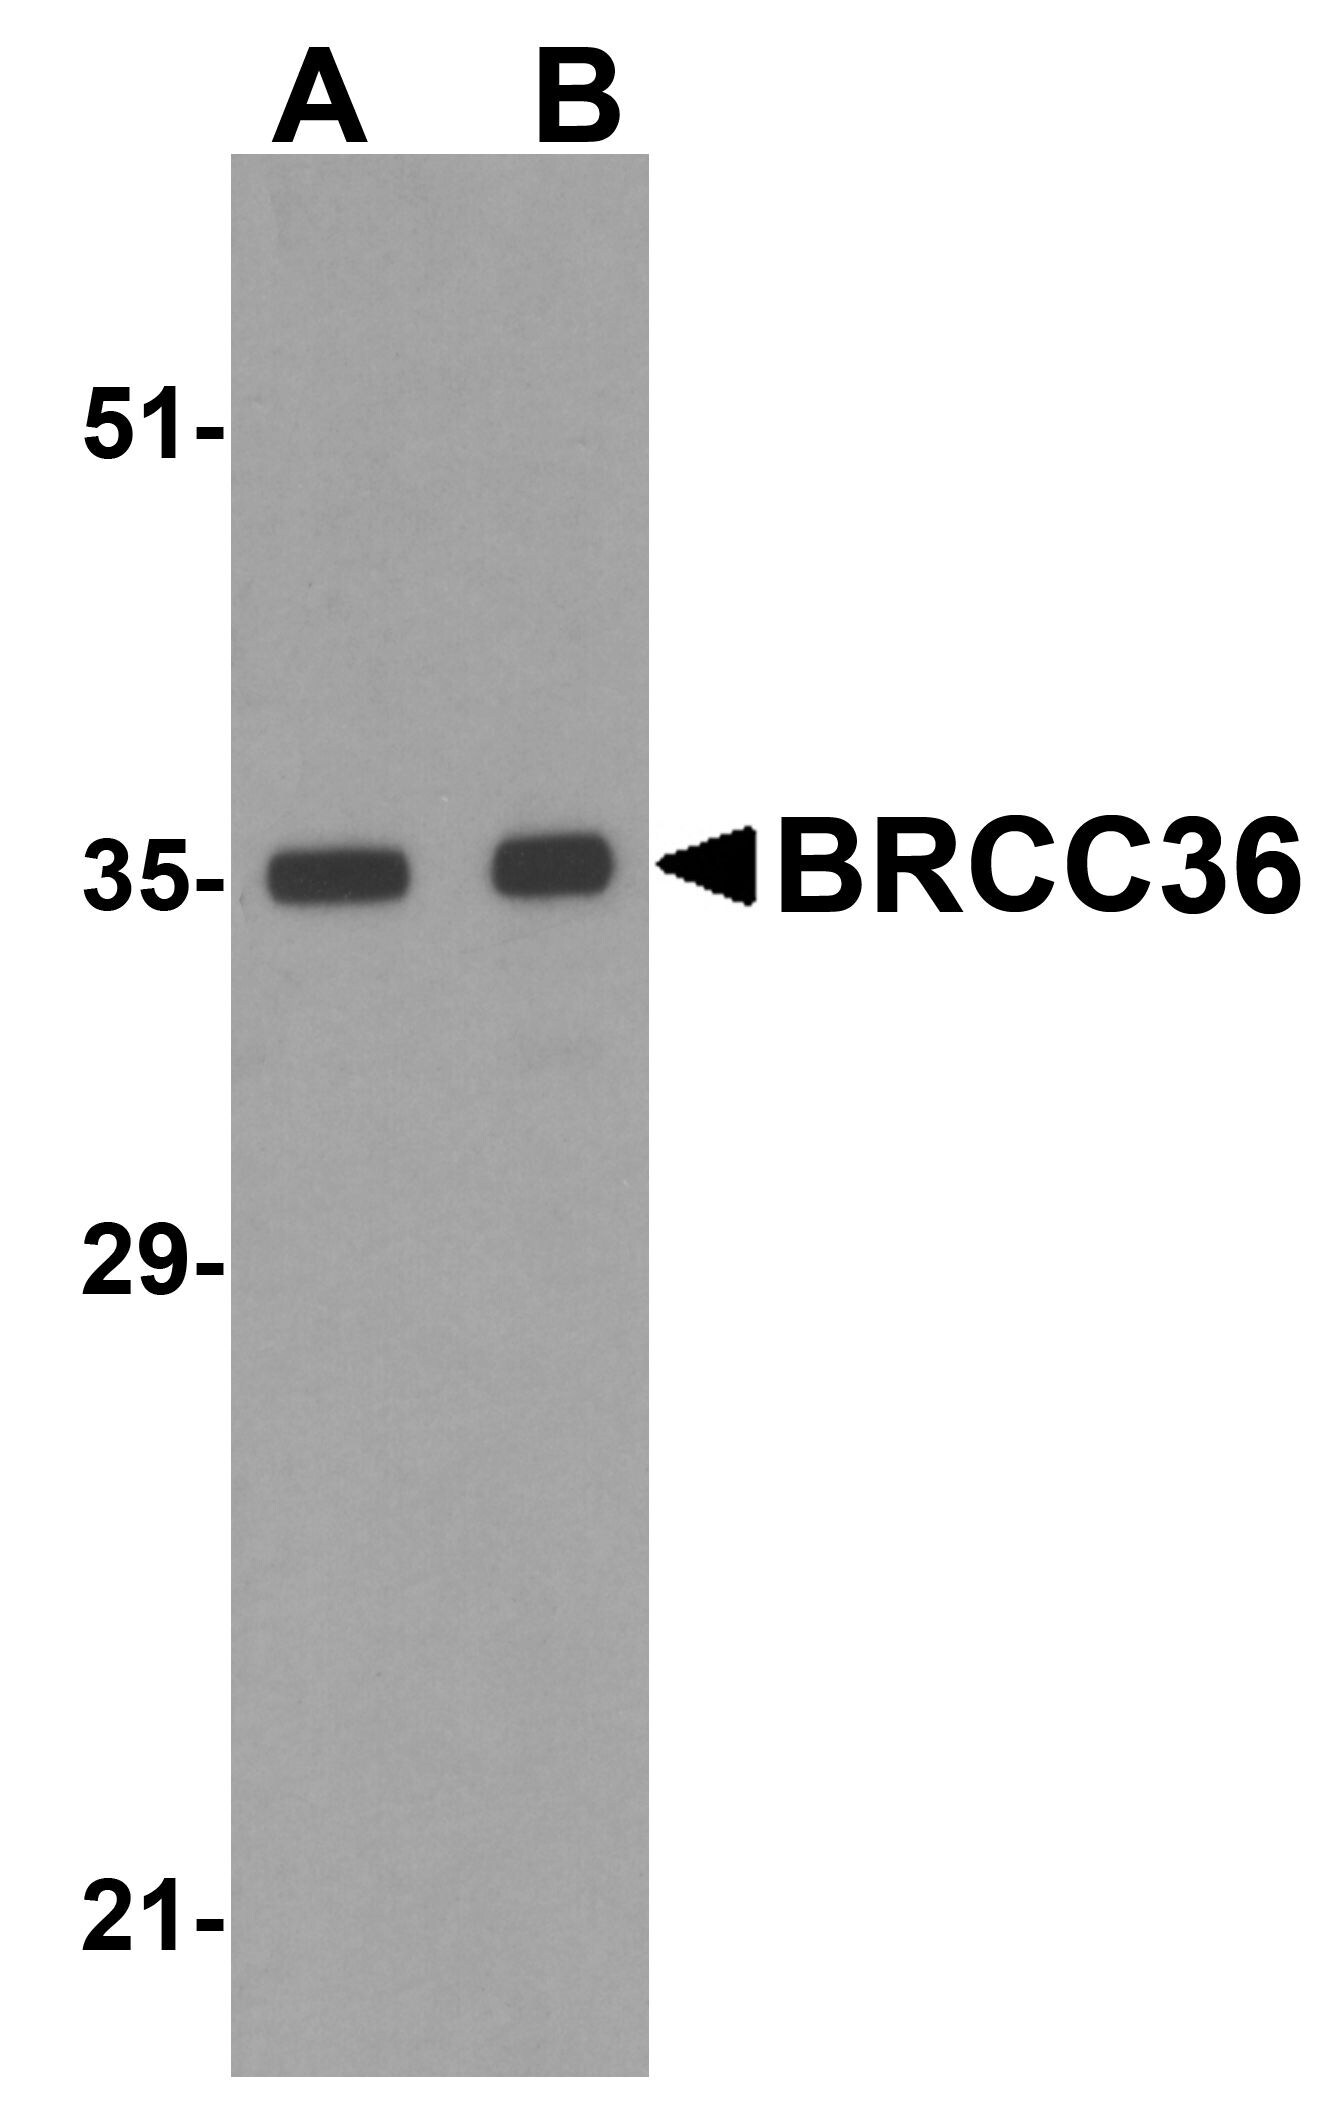
- Western Blot analysis of BRCC36 in MCF7 cell lysate with BRCC3 Polyclonal Antibody (Product # PA5-20426) at (A) 0.5 and (B) 1 µg/mL.
Supportive validation
- Submitted by
- Invitrogen Antibodies (provider)
- Main image
- Experimental details
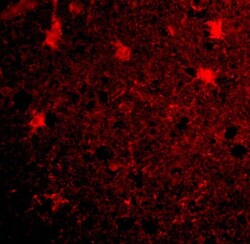
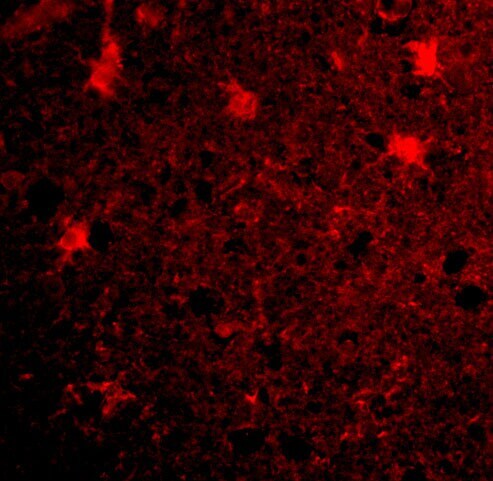
- Immunofluorescence of BRCC36 in Human Brain cells with BRCC3 Polyclonal Antibody (Product # PA5-20426) at 20 µg/mL.
Supportive validation
- Submitted by
- Invitrogen Antibodies (provider)
- Main image
- Experimental details
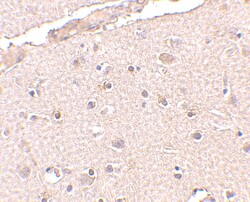
- Immunohistochemistry of BRCC36 in human brain tissue with BRCC3 Polyclonal Antibody (Product # PA5-20426) at 2.5 µg/mL.

Supportive validation
- Submitted by
- Invitrogen Antibodies (provider)
- Main image

- Experimental details
- NULL
- Submitted by
- Invitrogen Antibodies (provider)
- Main image
- Experimental details
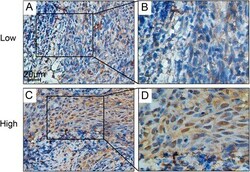
- Fig. 1 Immunohistochemistry staining of BRCC3 expression in nasopharyn-geal carcinoma tissues. BRCC3 expression was mainly localized within the nuclei of cancer cells. a Tumor with low BRCC3 level (200x); c Tumor with high BRCC3 level (200x); b and d demonstrated the higher magnification (400x) from the area of the box in ( a ) and ( c ) respectively. Low: low BRCC3 expression; High: high BRCC3 expression

- Submitted by
- Invitrogen Antibodies (provider)
- Main image
- Experimental details
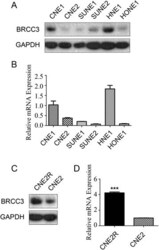
- Fig. 3 High expression level of BRCC3 in radioresistant NPC cell lines. a Western blot analysis of BRCC3 NPC cell lines; b Real-time PCR analysis of BRCC3 protein in the same cell lines as described in A. c Western blotting analysis of BRCC3 in CNE2 and CNE2R cells. d Realtime PCR analysis of BRCC3 in CNE2 and CNE2R cells. T test was used to compare the expression level, the asterisks indicate a significant (*** p < 0.001) difference

- Submitted by
- Invitrogen Antibodies (provider)
- Main image
- Experimental details
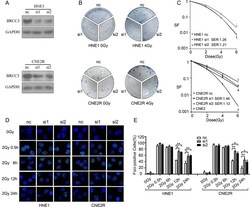
- Fig. 4 Depletion of BRCC3 results in increased sensitivity to ionizing radiation. a Knockdown of BRCC3 was assessed by western-blotting (nc: negative control siRNA; si1: siRNA1 target BRCC3; si2: siRNA2 target BRCC3). b HNE1 and CNE2R cells were transfected with siRNAs, 24 h later they were seeded to 6-well plates and irradiated with different doses. Clones were stained and counted after 7-14 days. c Dose-survival curves of irradiated HNE1 and CNE2R cells (range, 0-6Gy, SF: survival fractions, SER: radiation sensitization enhancement ratio). In HNE1 cells SER of si1 and si2 was 1.26 ( p < 0.05) and 1.21 ( p < 0.05) separately; In CNE2R cells SER of si1 and si2 was 1.46 ( p < 0.01) and 1.12 ( p < 0.05) separately. d Immunofluorescent staining of gammaH2AX. HNE1 and CNE2R cells transfected with BRCC3 or control siRNA was exposed to 2Gy irradiation, and immunofluorescent staining of gammaH2AX foci was conducted before and 0.5 h, 6 h, 12 h, 24 h after irradiation ( e ) Quantification of gammaH2AX foci formation. A positive cell was determined by the presence of >10 foci/cell. The percentage of positive cells was compared by t -test. The asterisks indicate a significant (* p < 0.05,** p < 0.01) difference

- Submitted by
- Invitrogen Antibodies (provider)
- Main image
- Experimental details
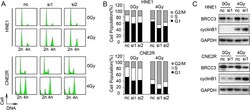
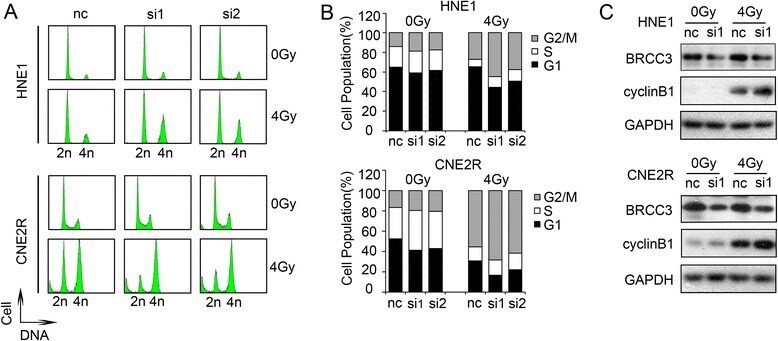
- Fig. 5 BRCC3 knockdown intensifies G2/M checkpoint arrest. a Cell-cycle profiles of HNE1 and CNE2R cells. Control and BRCC3 siRNA transfected cells were treated with 0Gy or 4Gy, and the FACS analysis was executed 24 h post- irradiation.(nc: negative control siRNA; si1: siRNA1 target BRCC3; si2: siRNA2 target BRCC3). b Quantification of A. BRCC3 inhibition caused an increased portion of G2/M phase in HNE1 and CNE2R cells. c Western blot analysis of cyclinB1 24 h after 0Gy or 4Gy IR
- Submitted by
- Invitrogen Antibodies (provider)
- Main image
- Experimental details
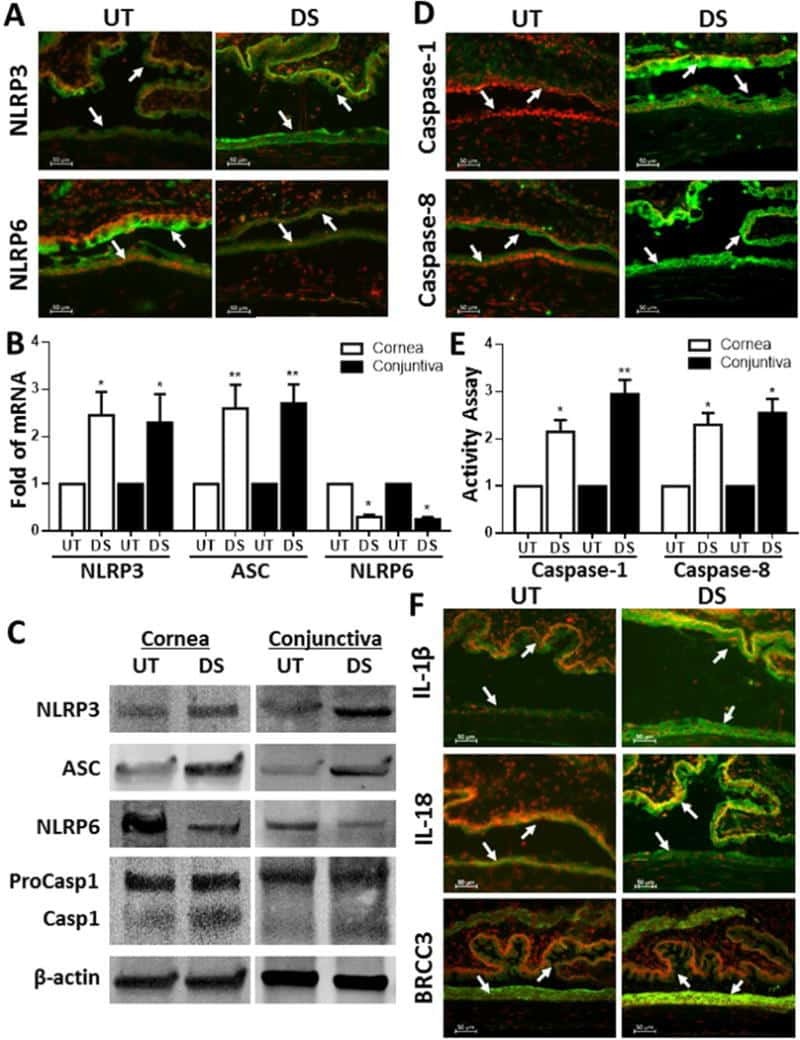
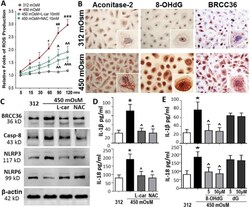
- Fig. 5 Oxidized mitochondrial DNA induces the caspase-8-mediated imbalance of NLRP3/NLRP6 activation via BRCC36 deubiquitinating activity (A) Hyperosomtic stress induced the ROS overproduction in a time-dependent manner in HCECs, which was significantly reduced by antioxidants, 10 mM of N-Acetyl-L-cysteine (NAC) or L-carnitine. (B) Immunohisctochemical staining showed stimulated aconitase-2, 8-OHdG and BRCC36, markers indicating mitochondrial DNA oxidative damage. (C) Western blotting showed that hyperosmolarity-stimulated BRCC36/Caspase-8 and imbalanced NLRP3/NLRP6 were reversed by antioxidants, 10 mM of NAC or L-carnitine. (D) ELISA showed that hyperosmolarity-activated IL-1beta and IL-18 were reversed by antioxidants, 10 mM of NAC or L-carnitine. (E) Exogenous 8-OHdG (blocking oxidized mitochondrial DNA) at 5-50 muM significantly suppressed hyperosmolarity-stimulated maturation and secretion of IL-1beta and IL-18 with dG as negative control. Data shown are representative of three or more independent experiments (mean +- SD). * P < 0.05, ** P < 0.01, *** P < 0.001, vs. controls; Lamda P < 0.05, LamdaLamda P