Explore
 Validate
 Learn
LearnPA5-22143
antibody from Invitrogen Antibodies
Targeting: NDUFA5
B13, CI-13kB, CI-13KD-B, NUFM, UQOR13
 Western blot
Antibody data
- Antibody Data
- Antigen structure
- References [1]
- Comments [0]
- Validations
- Western blot [2]
- Immunohistochemistry [2]
- Other assay [2]
Submit
Validation data
Reference
Comment
Report error
- Product number
- PA5-22143 - Provider product page

- Provider
- Invitrogen Antibodies
- Product name
- NDUFA5 Polyclonal Antibody
- Antibody type
- Polyclonal
- Antigen
- Recombinant full-length protein
- Reactivity
- Human, Mouse
- Host
- Rabbit
- Isotype
- IgG
- Vial size
- 100 µL
- Concentration
- 1 mg/mL
- Storage
- Store at 4°C short term. For long term storage, store at -20°C, avoiding freeze/thaw cycles.
Submitted references Comparative Proteomic Profiling Identifies Reciprocal Expression of Mitochondrial Proteins Between White and Gray Matter Lesions From Multiple Sclerosis Brains.
Rai NK, Singh V, Li L, Willard B, Tripathi A, Dutta R
Frontiers in neurology 2021;12:779003
Frontiers in neurology 2021;12:779003
No comments: Submit comment
Supportive validation
- Submitted by
- Invitrogen Antibodies (provider)
- Main image
- Experimental details
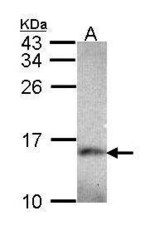
- Western Blot using NDUFA5 Polyclonal Antibody (Product # PA5-22143). Sample (30 µg of whole cell lysate). Lane A: Hep G2 . 15% SDS PAGE. NDUFA5 Polyclonal Antibody (Product # PA5-22143) diluted at 1:1,000.

- Submitted by
- Invitrogen Antibodies (provider)
- Main image

- Experimental details
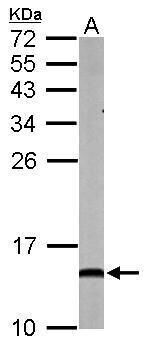
- Western Blot using NDUFA5 Polyclonal Antibody (Product # PA5-22143). Sample (50 µg of whole cell lysate). Lane A: mouse brain . 15% SDS PAGE. NDUFA5 Polyclonal Antibody (Product # PA5-22143) diluted at 1:1,000.
Supportive validation
- Submitted by
- Invitrogen Antibodies (provider)
- Main image
- Experimental details
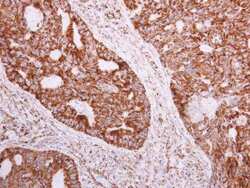
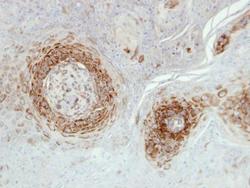
- Immunohistochemistry (Paraffin) analysis of NDUFA5 was performed in paraffin-embedded human colon carcinoma tissue using NDUFA5 Polyclonal Antibody (Product # PA5-22143) at a dilution of 1:500.

- Submitted by
- Invitrogen Antibodies (provider)
- Main image
- Experimental details
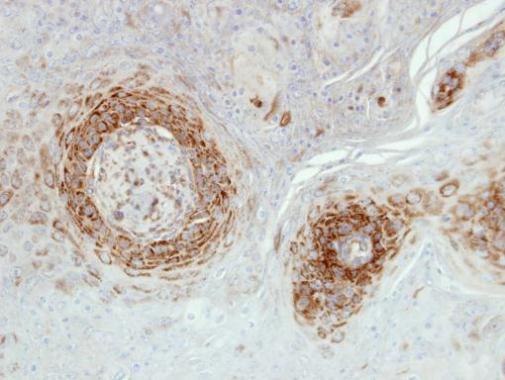
- Immunohistochemical analysis of paraffin-embedded Cal27 xenograft, using NDUFA5 (Product # PA5-22143) antibody at 1:500 dilution. Antigen Retrieval: Citrate buffer, pH 6.0, 15 min.
Supportive validation
- Submitted by
- Invitrogen Antibodies (provider)
- Main image

- Experimental details
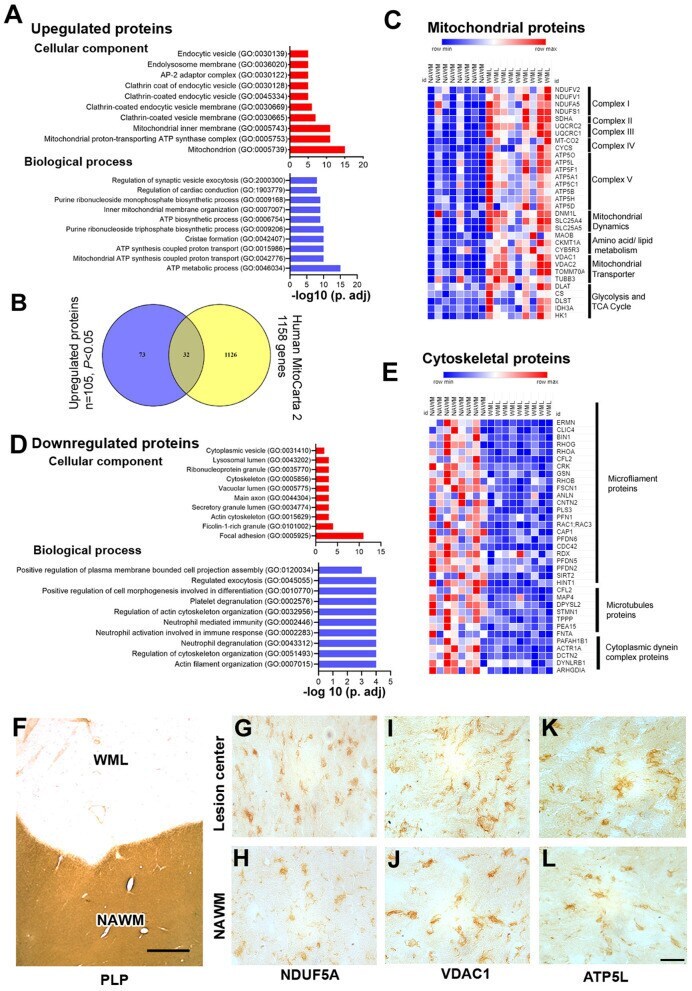
- Figure 3 Gene enrichment analysis and validation of WML DEPs. (A) Bar graphs showing cellular component (red) and biological process (blue) enrichment of upregulated WML proteomes. (B) Venn diagram showing a comparison between mitochondrial genes from the mitocarta 2.0 dataset and upregulated proteins identified in our study. (C) LFQ-based heatmap showing upregulated mitochondrial protein distribution across different mitochondrial complexes. (D) Bar graphs showing cellular component (red) and biological process (blue) enrichment of downregulated WML proteomes. (E) LFQ-based heat map showing downregulated proteins related to microfilament proteins, microtubule proteins, and cytoplasmic dynein dynactin complex proteins. (F-L) . Representative IHC images showing cellular localization of VDAC1, NDUFA5, and ATP5L (G-L) WMLs and NAWM from progressive MS brains. Scale bar- 500mum (F) and 20mum (G-L) .
- Submitted by
- Invitrogen Antibodies (provider)
- Main image
- Experimental details
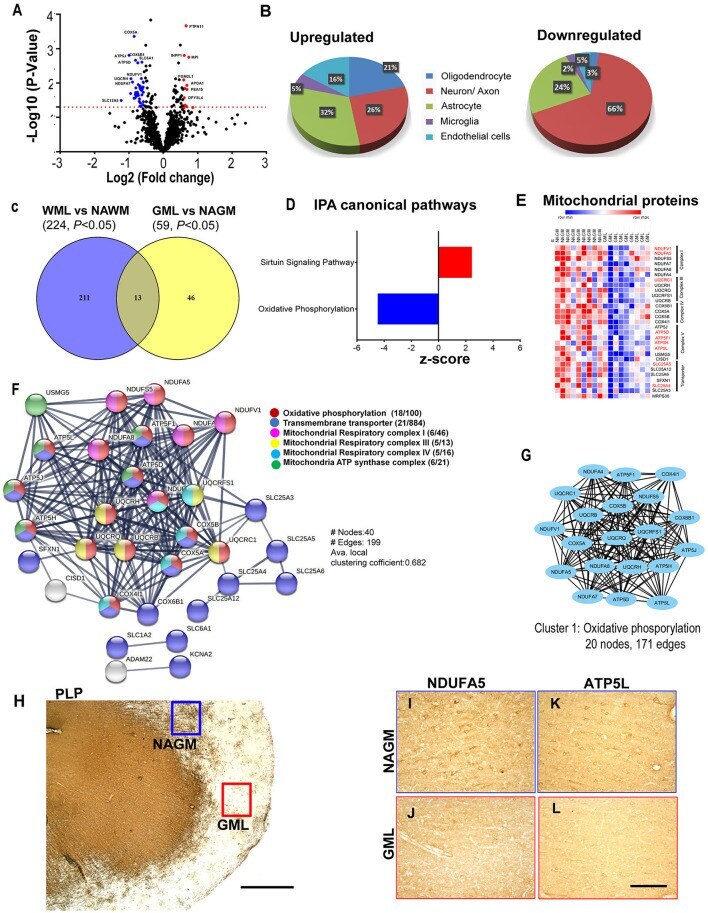
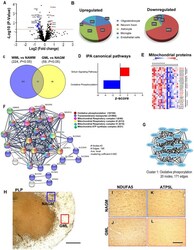
- Figure 5 Cortical GML proteome profiling. (A) Volcano plot displaying the distribution of all proteins ( n = 1182) with relative protein abundance (Log2 fold change) plotted against significance level (-Log 10 P -Value). Significantly upregulated (red circle) as well as downregulated (blue circle) proteins in GMLs are also indicated. (B) Cellular identity of the significantly dysregulated GML proteins (upregulated and downregulated). (C) Venn diagram comparison of DEPs ( p < 0.05) between WMLs and GMLs. (D) IPA canonical pathways, activated (red) and inhibited (blue), associated with significantly dysregulated proteins in GMLs. (E) LFQ-based heat map of mitochondria-specific downregulated proteins in GMLs. Proteins that are common and have opposite expressions in WML proteomic data are highlighted in red. (F) PPI network analysis of downregulated proteins showing enrichment of mitochondria-related pathways. (G) MCODE analysis revealed a highly interconnected sub-network associated with oxidative phosphorylation. (H-L) PLP- stained image of (H) sub-pial lesion. IHC images showing reduced expression of NDUFA5 (I,J) and ATP5L (K,L) in demyelinated regions (red box) compared to NAGM (blue box). Scale bar- 500mum (H) and 100mum (I-L) .