 Explore
 Validate
 Learn
Learn Western blot
Antibody data
- Antibody Data
- Antigen structure
- References [7]
- Comments [0]
- Validations
- Western blot [5]
- Immunohistochemistry [1]
- Flow cytometry [1]
- Other assay [8]
Submit
Validation data
Reference
Comment
Report error
- Product number
- 40-2100 - Provider product page

- Provider
- Invitrogen Antibodies
- Product name
- PDGF-D Polyclonal Antibody
- Antibody type
- Polyclonal
- Antigen
- Synthetic peptide
- Reactivity
- Human, Mouse, Rat
- Host
- Rabbit
- Isotype
- IgG
- Vial size
- 100 µg
- Concentration
- 0.25 mg/mL
- Storage
- -20°C
Submitted references SU16f inhibits fibrotic scar formation and facilitates axon regeneration and locomotor function recovery after spinal cord injury by blocking the PDGFRβ pathway.
PDGF-D activation by macrophage-derived uPA promotes AngII-induced cardiac remodeling in obese mice.
Cytomegalovirus promotes murine glioblastoma growth via pericyte recruitment and angiogenesis.
Overexpression of matriptase in tumor stroma is a poor prognostic indicator of extrahepatic bile duct cancer.
Hyperhomocysteinemia Causes Chorioretinal Angiogenesis with Placental Growth Factor Upregulation.
Molecular signature of epithelial-mesenchymal transition (EMT) in human prostate cancer bone metastasis.
Platelet-derived growth factor isoform expression in carbon tetrachloride-induced chronic liver injury.
Li Z, Yu S, Liu Y, Hu X, Li Y, Xiao Z, Chen Y, Tian D, Xu X, Cheng L, Zheng M, Jing J
Journal of neuroinflammation 2022 Apr 16;19(1):95
Journal of neuroinflammation 2022 Apr 16;19(1):95
PDGF-D activation by macrophage-derived uPA promotes AngII-induced cardiac remodeling in obese mice.
Cheng YW, Zhang ZB, Lan BD, Lin JR, Chen XH, Kong LR, Xu L, Ruan CC, Gao PJ
The Journal of experimental medicine 2021 Sep 6;218(9)
The Journal of experimental medicine 2021 Sep 6;218(9)
Cytomegalovirus promotes murine glioblastoma growth via pericyte recruitment and angiogenesis.
Krenzlin H, Behera P, Lorenz V, Passaro C, Zdioruk M, Nowicki MO, Grauwet K, Zhang H, Skubal M, Ito H, Zane R, Gutknecht M, Griessl MB, Ricklefs F, Ding L, Peled S, Rooj A, James CD, Cobbs CS, Cook CH, Chiocca EA, Lawler SE
The Journal of clinical investigation 2019 Mar 11;129(4):1671-1683
The Journal of clinical investigation 2019 Mar 11;129(4):1671-1683
Overexpression of matriptase in tumor stroma is a poor prognostic indicator of extrahepatic bile duct cancer.
Komatsubara T, Oshiro H, Sakuma Y, Sata N, Niki T, Fukushima N
Pathology international 2019 Feb;69(2):86-93
Pathology international 2019 Feb;69(2):86-93
Hyperhomocysteinemia Causes Chorioretinal Angiogenesis with Placental Growth Factor Upregulation.
Lee YJ, Ke CY, Tien N, Lin PK
Scientific reports 2018 Oct 25;8(1):15755
Scientific reports 2018 Oct 25;8(1):15755
Molecular signature of epithelial-mesenchymal transition (EMT) in human prostate cancer bone metastasis.
Sethi S, Macoska J, Chen W, Sarkar FH
American journal of translational research 2010 Oct 23;3(1):90-9
American journal of translational research 2010 Oct 23;3(1):90-9
Platelet-derived growth factor isoform expression in carbon tetrachloride-induced chronic liver injury.
Borkham-Kamphorst E, Kovalenko E, van Roeyen CR, Gassler N, Bomble M, Ostendorf T, Floege J, Gressner AM, Weiskirchen R
Laboratory investigation; a journal of technical methods and pathology 2008 Oct;88(10):1090-100
Laboratory investigation; a journal of technical methods and pathology 2008 Oct;88(10):1090-100
No comments: Submit comment
Supportive validation
- Submitted by
- Invitrogen Antibodies (provider)
- Main image

- Experimental details
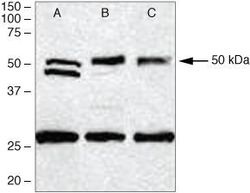
- Western Blot analysis of (A) NTERA-2 cell lysates, (B) mouse testis homogenates, (C) SK-OV-3 cell lysates, and (D) fetal mouse brain homogenates using Zymed Rb anti-PDGF-D (Product # 40-2100).

- Submitted by
- Invitrogen Antibodies (provider)
- Main image
- Experimental details
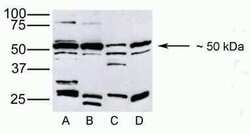
- Western blot analysis of (A) U251 and (B) A172 cell lysates, and (C) rat ovary homogenates using Rb anti-PDGF-D (Product # 40-2100).

- Submitted by
- Invitrogen Antibodies (provider)
- Main image

- Experimental details
- Western blot analysis of (A) U251 and (B) A172 cell lysates, and (C) rat ovary homogenates using Rb anti-PDGF-D (Product # 40-2100).

- Submitted by
- Invitrogen Antibodies (provider)
- Main image

- Experimental details
- Western blot analysis was performed on whole cell extracts (30 µg lysate) of Mouse Brain (Lane 1), A549 (Lane 2), SH-SY5Y (Lane 3) and THP-1 (Lane 4). The blots were probed with Anti-PDGFD Rabbit Polyclonal Antibody (Product # 40-2100, 1-3 µg/mL) and detected by chemiluminescence Goat Anti-Rabbit IgG Secondary Antibody, HRP conjugate (Product # G-21234, 1:5000 dilution). A 42 kDa band corresponding to PDGFD was observed across cell lines and tissues tested. An extra band at ~ 35 kDa was observed in cell lines alone.Known quantity of protein samples were electrophoresed using Novex® NuPAGE®12 % Bis-Tris gel (Product # NP0342BOX), XCell SureLock™ Electrophoresis System (Product # EI0002) and Novex® Sharp Pre-Stained Protein Standard (Product # LC5800). Resolved proteins were then transferred onto a nitrocellulose membrane by iBlot® 2 Dry Blotting System (Product # IB21001). The membrane was probed with the relevant primary and secondary Antibody following blocking with 5 % skimmed milk. Chemiluminescent detection was performed using Pierce™ ECL Western Blotting Substrate (Product # 32106).

- Submitted by
- Invitrogen Antibodies (provider)
- Main image
- Experimental details
- Western Blot analysis of (A) NTERA-2 cell lysates, (B) mouse testis homogenates, (C) SK-OV-3 cell lysates, and (D) fetal mouse brain homogenates using Zymed Rb anti-PDGF-D (Product # 40-2100).

Supportive validation
- Submitted by
- Invitrogen Antibodies (provider)
- Main image

- Experimental details
- Immunohistochemistry analysis of PDGF-D showing staining in the cytoplasm of paraffin-embedded human heart tissue (right) compared to a negative control without primary antibody (left). To expose target proteins, antigen retrieval was performed using 10mM sodium citrate (pH 6.0), microwaved for 8-15 min. Following antigen retrieval, tissues were blocked in 3% H2O2-methanol for 15 min at room temperature, washed with ddH2O and PBS, and then probed with a Anti- PDGF-D Polyclonal Antibody (Product # 40-2100) diluted in 3% BSA-PBS at a dilution of 1:50 overnight at 4°C in a humidified chamber. Tissues were washed extensively in PBST and detection was performed using an HRP-conjugated secondary antibody followed by colorimetric detection using a DAB kit. Tissues were counterstained with hematoxylin and dehydrated with ethanol and xylene to prep for mounting.

Supportive validation
- Submitted by
- Invitrogen Antibodies (provider)
- Main image

- Experimental details
- Flow cytometry analysis of PDGF-D was done on NTERA-2 cells. Cells were fixed with 70% ethanol for 10 minutes, permeabilized with 0.25% Triton™ X-100 for 20 minutes, and blocked with 5% BSA for 30 minutes at room temperature. Cells were labeled with PDGF-D Rabbit Polyclonal Antibody (402100, red histogram) or with rabbit isotype control (yellow histogram) at 3-5 ug/million cells in 2.5% BSA. After incubation at room temperature for 2 hours, the cells were labeled with Alexa Fluor® 488 Goat Anti-Rabbit Secondary Antibody (A11008) at a dilution of 1:400 for 30 minutes at room temperature. The representative 10,000 cells were acquired and analyzed for each sample using an Attune® Acoustic Focusing Cytometer. The purple histogram represents unstained control cells and the green histogram represents no-primary-antibody control.

Supportive validation
- Submitted by
- Invitrogen Antibodies (provider)
- Main image

- Experimental details
- NULL

- Submitted by
- Invitrogen Antibodies (provider)
- Main image
- Experimental details
- NULL

- Submitted by
- Invitrogen Antibodies (provider)
- Main image

- Experimental details
- NULL

- Submitted by
- Invitrogen Antibodies (provider)
- Main image
- Experimental details
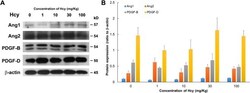
- Figure 4 Ang1, Ang2, PDGF-B, and PDGF-D protein expression was present in the retinas of the different animals. ( A ) Western blotting of retinas with Ang1, Ang2, PDGF-B, and PDGF-D expression from the control animals and the animals treated with 1, 10, 30, or 100 mg/kg hcy. ( B ) Statistical analyses of Ang1, Ang2, PDGF-B, and PDGF-D protein expression in the retinas from the control and hcy-treated animals. The data are presented as mean values, with error bars representing the standard error of the mean (SEM). One-way ANOVA was used to analyze the data. N = 5 in each group. Details regarding the data are shown in Supplementary Table 1 , and full-length blots are presented in Supplementary Fig. 3 .

- Submitted by
- Invitrogen Antibodies (provider)
- Main image

- Experimental details
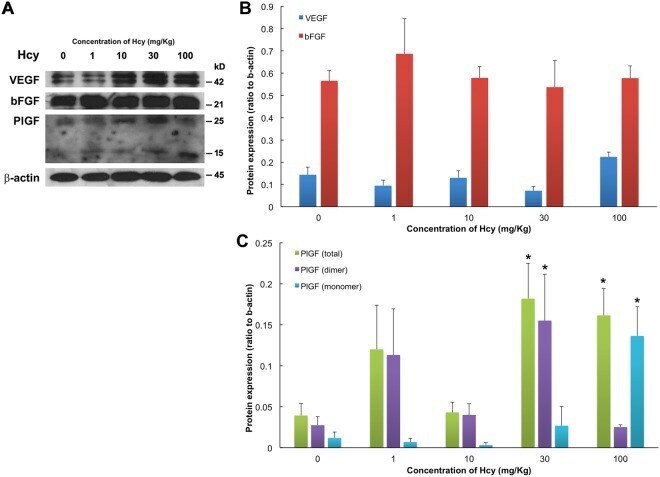
- Figure 5 VEGF, bFGF, and PlGF protein expression was present in the retinas of the different animals. ( A ) Western blotting from retinas with VEGF, bFGF, and PlGF expression collected from the control animals and the animals treated with 1, 10, 30, or 100 mg/kg hcy. PlGF dimer-form is detected at 25kD, PlGF monomer-form is detected at 15kD, and total PlGF combines expressions from both dimer- and monomer-forms. ( B , C ) Statistical analyses of VEGF, bFGF, and PlGF protein expression in the retinas of control and hcy-treated animals. The data are shown as mean values, with error bars representing the SEMs. One-way ANOVA with Dunnett's test for multiple comparisons was used to analyze the data. N = 5 in each group. * Indicates P < 0.05 compared with the control group. Details regarding the data and P values are shown in Supplementary Table 1 , and full-length blots are presented in Supplementary Fig. 3 .
- Submitted by
- Invitrogen Antibodies (provider)
- Main image

- Experimental details
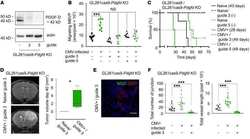
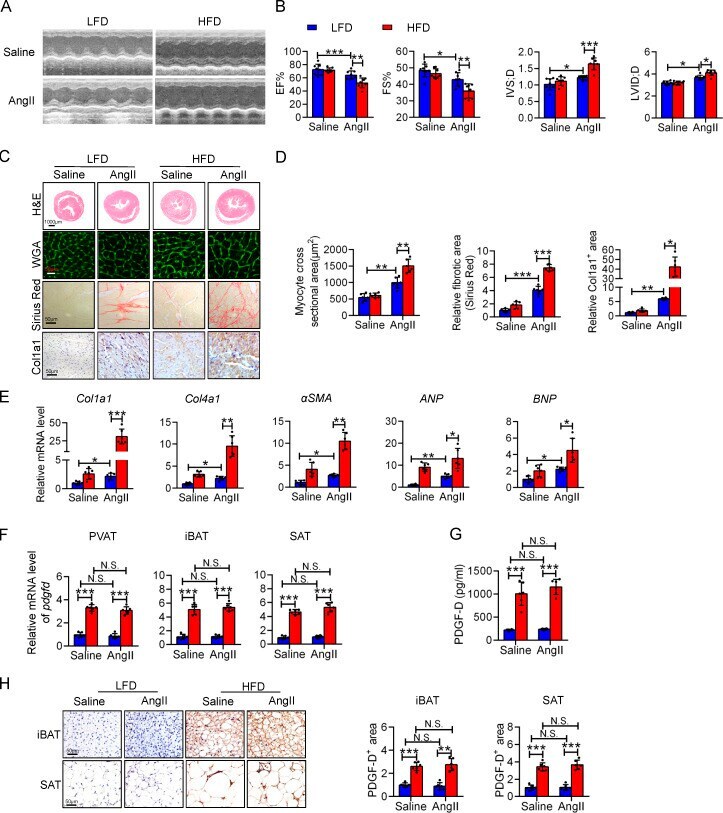
- Figure 1. HFD-induced obesity aggravates hypertensive cardiac remodeling and increases PDGF-D expression in adipose tissue. (A) Representative echocardiography images of AngII-infused WT and HFD mice. (B) Quantitative analysis of EF, FS, LVID; D, and IVS; D obtained from echocardiography. n = 8. (C) Representative cross sections of hearts stained for H&E, Sirius Red, and WGA and IHC staining of Col1a1. Scale bar for WGA is 50 mum. (D) Quantitative analysis of cardiomyocyte size (WGA staining), fibrotic area (Sirius Red staining), and Col1a1 expression. n = 6. (E) qPCR analysis of hypertrophic ( ANP ; BNP ) and fibrotic ( Col1a1 , Col4a1 , and alphaSMA ) genes in the heart. n = 6. (F) qPCR analysis of pdgfd gene in PVAT, iBAT, and SAT. n = 6. (G) PDGF-D level in plasma detected by ELISA. n = 6. (H) IHC staining and quantitative analysis of PDGF-D in iBAT and SAT. n = 6. All experimental data were verified in at least three independent experiments. Statistical significance was assessed using two-way ANOVA with Bonferroni post hoc test. Data are mean +- SD. *, P < 0.05; **, P < 0.01; ***, P < 0.001.
- Submitted by
- Invitrogen Antibodies (provider)
- Main image

- Experimental details
- Figure 4. Macrophage-derived uPA activates PDGF-D in hearts of AngII-induced obese mice. (A) Diagram of PDGF-D structure and activation. (B) Western blot and quantitative analysis of full-length PDGF-D (50 kD), cleaved PDGF-DD (30 kD), phosphorylated-PDGFRbeta (p-PDGFRbeta), and total-PDGFRbeta (t-PDGFRbeta) expression in the heart. n = 6. (C) Western blot and quantitative analysis of uPA expression in BMDMs, CFs, and adipocytes (ATs). n = 6. (D) Representative images and quantitative analysis of double immunofluorescent staining of uPA and F4/80 in hearts of indicated mice. n = 6. (E) Representative images and quantitative analysis of EDU proliferation staining and immunofluorescent staining of alphaSMA in PDGF-D KO CFs. KOAT indicates AT-CM from PDGF-D KO mice; M indicates BMDM CM from WT mice; TgAT indicates AT CM from PA-Tg mice; M sh-uPA indicates CM of uPA knockdown BMDM. n = 6. (F) Western blot and quantitative analysis of Col1a1 expression in PDGF-D KO CFs. n = 6. All experimental data were verified in at least three independent experiments. Statistical significance was assessed using two-way ANOVA with Bonferroni post hoc test (B-D) or one-way ANOVA with Bonferroni post hoc test (E and F). Data are mean +- SD. *, P < 0.05; **, P < 0.01; ***, P < 0.001. Scale bars, 50 mum.

- Submitted by
- Invitrogen Antibodies (provider)
- Main image

- Experimental details
- Figure S1. PDGF-D expression in control LFD and HFD mice. (A) qPCR analysis of pdgfd in heart, aorta, kidney, PVAT, iBAT, and SAT of WT mice. n = 6. (B) qPCR analysis of pdgfd in heart, aorta, and kidney of LFD and HFD mice. n = 6. (C) Western blot and quantitative analysis of PDGF-D expression in iBAT and SAT. n = 6. All experimental data were verified in at least two independent experiments. Statistical significance was assessed using one-way ANOVA with Bonferroni post hoc test (A) or two-way ANOVA with Bonferroni post hoc test (B and C). Data are mean +- SD. *, P < 0.05; **, P < 0.01; ***, P < 0.001 versus heart. ###, P < 0.001 versus aorta. &&&, P < 0.001 versus kidney.
