Explore
 Validate
 Learn
Learn Western blot
Antibody data
- Antibody Data
- Antigen structure
- References [1]
- Comments [0]
- Validations
- Western blot [3]
- Immunocytochemistry [2]
- Immunohistochemistry [2]
- Other assay [4]
Submit
Validation data
Reference
Comment
Report error
- Product number
- PA5-29789 - Provider product page

- Provider
- Invitrogen Antibodies
- Product name
- SR-BI Polyclonal Antibody
- Antibody type
- Polyclonal
- Antigen
- Recombinant protein fragment
- Description
- Recommended positive controls: 293T, A431, H1299, HeLa, HepG2, Molt-4, Rat liver.
- Concentration
- 0.12 mg/mL
Submitted references Identification of two major autoantigens negatively regulating endothelial activation in Takayasu arteritis.
Mutoh T, Shirai T, Ishii T, Shirota Y, Fujishima F, Takahashi F, Kakuta Y, Kanazawa Y, Masamune A, Saiki Y, Harigae H, Fujii H
Nature communications 2020 Mar 9;11(1):1253
Nature communications 2020 Mar 9;11(1):1253
No comments: Submit comment
Supportive validation
- Submitted by
- Invitrogen Antibodies (provider)
- Main image
- Experimental details
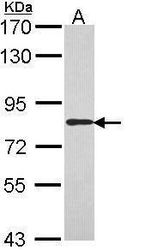
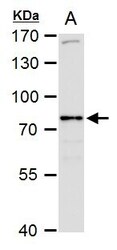
- Western blot analysis of SR-BI using 30 µg of MOLT4 lysate. Samples were loaded onto a 7.5% SDS-PAGE gel and probed with a SR-BI polyclonal antibody (Product # PA5-29789) at a dilution of 1:1000.
- Submitted by
- Invitrogen Antibodies (provider)
- Main image
- Experimental details
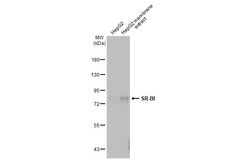
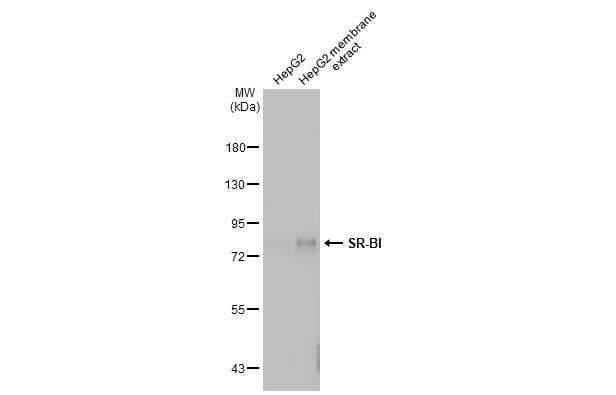
- Western Blot using SR-BI Polyclonal Antibody (Product # PA5-29789). HepG2 whole cell and membrane extracts (30 µg) were separated by 7.5% SDS-PAGE, and the membrane was blotted with SR-BI Polyclonal Antibody (Product # PA5-29789) diluted at 1:1,000. The HRP-conjugated anti-rabbit IgG antibody was used to detect the primary antibody.
- Submitted by
- Invitrogen Antibodies (provider)
- Main image
- Experimental details
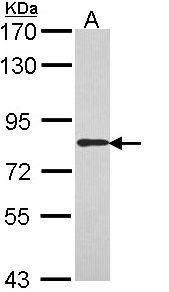
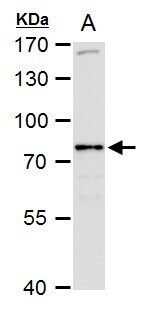
- SR-BI Polyclonal Antibody detects SR-BI protein by western blot analysis. A. 50 µg rat liver extract.7.5% SDS-PAGE. SR-BI Polyclonal Antibody (Product # PA5-29789) dilution: 1:1,000. The HRP-conjugated anti-rabbit IgG antibody was used to detect the primary antibody.
Supportive validation
- Submitted by
- Invitrogen Antibodies (provider)
- Main image
- Experimental details
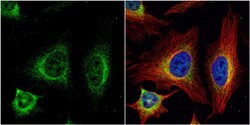
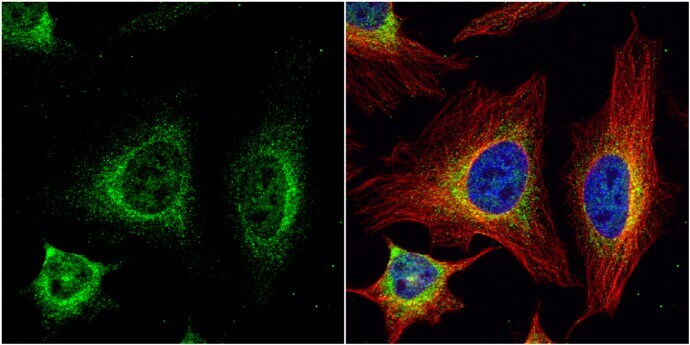
- Immunocytochemistry-Immunofluorescence analysis of SR-BI was performed in HeLa cells fixed in 4% paraformaldehyde at RT for 15 min. Green: SR-BI Polyclonal Antibody (Product # PA5-29789) diluted at 1:500. Red: alpha Tubulin, a cytoskeleton marker. Blue: Hoechst 33342 staining.
- Submitted by
- Invitrogen Antibodies (provider)
- Main image
- Experimental details
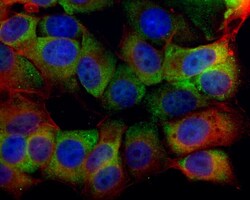
- Immunocytochemistry-Immunofluorescence analysis of SR-BI was performed in MCF7 cells fixed in 4% paraformaldehyde at RT for 15 min. Green: SR-BI Polyclonal Antibody (Product # PA5-29789) diluted at 1:500. Red: phalloidin, a cytoskeleton marker. Blue: Hoechst 33342 staining.

Supportive validation
- Submitted by
- Invitrogen Antibodies (provider)
- Main image
- Experimental details
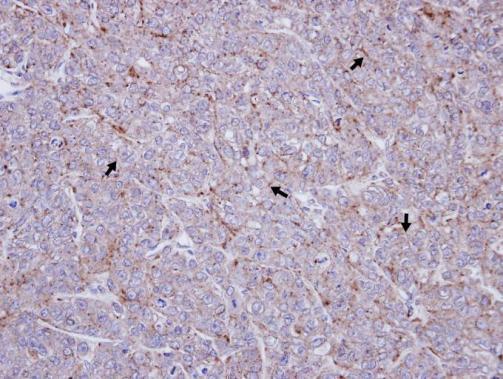
- Immunohistochemical analysis of paraffin-embedded DLD-1 xenograft, using SR-BI (Product # PA5-29789) antibody at 1:100 dilution. Antigen Retrieval: EDTA based buffer, pH 8.0, 15 min.
- Submitted by
- Invitrogen Antibodies (provider)
- Main image

- Experimental details
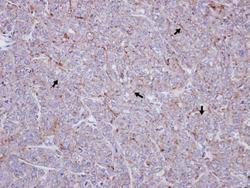
- SR-BI Polyclonal Antibody detects SR-BI protein at cytosol and weak membrane on human hepatoma by immunohistochemical analysis. Sample: Paraffin-embedded hepatoma. SR-BI Polyclonal Antibody (Product # PA5-29789) dilution: 1:500. Antigen Retrieval: EDTA based buffer, pH 8.0, 15 min.
Supportive validation
- Submitted by
- Invitrogen Antibodies (provider)
- Main image
- Experimental details
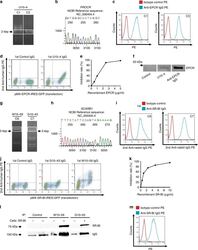
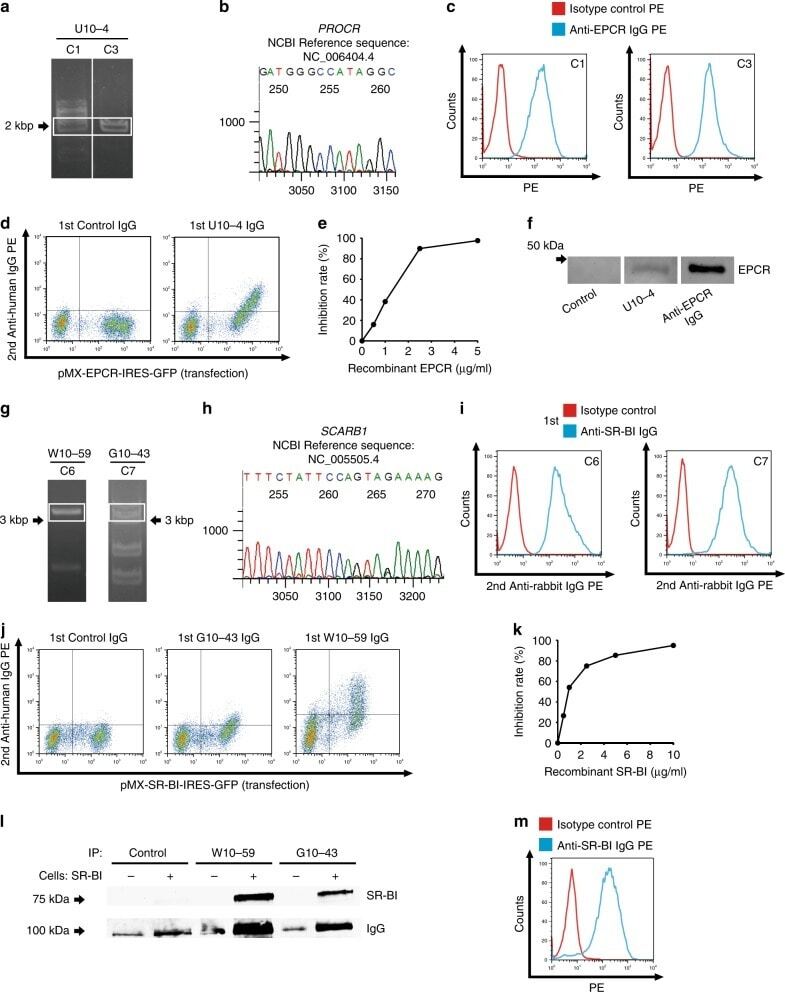
- Fig. 2 Identification of endothelial protein C receptor (EPCR) and scavenger receptor class B type 1 (SR-BI) as endothelial autoantigens in Takayasu arteritis. a HUVEC cDNA fragments inserted into the genomic DNA of C1 and C3 clones established with U10-4 IgG were amplified, and PCR products were electrophoresed on a 0.8% agarose gel. b DNA sequencing was performed for the PCR products obtained around 2000 bp for C1, followed by BLAST analysis. c C1 (left) and C3 (right) were stained with PE-conjugated isotype control or PE-conjugated anti-human EPCR antibody and analyzed with flow cytometry. d The expression vector EPCR-IRES-GFP was transfected into YB 2/0 cells, and the cells were stained with 0.5 mg/mL control IgG or U10-4 IgG, followed by incubation with secondary antibody and flow cytometry analysis. e Inhibition tests for binding activities to YB2/0 cells overexpressing EPCR were performed using 0.5 mg/mL U10-4 IgG with soluble recombinant EPCR at the indicated concentrations. f Western blotting of recombinant EPCR proteins was performed, and they were stained with control serum, U10-4 serum, or anti-human EPCR antibody, followed by secondary antibodies. g HUVEC cDNA fragments inserted into the genomic DNA of C6 clones established with W10-59 IgG and C7 by using G10-43 IgG were amplified, and PCR products were electrophoresed on a 0.8% agarose gel. h DNA sequencing was performed for the PCR products obtained around 3000 bp for C7, followed by BLAST analysis. i C6 (left)
- Submitted by
- Invitrogen Antibodies (provider)
- Main image
- Experimental details
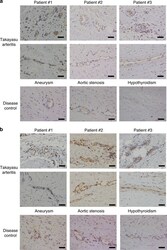
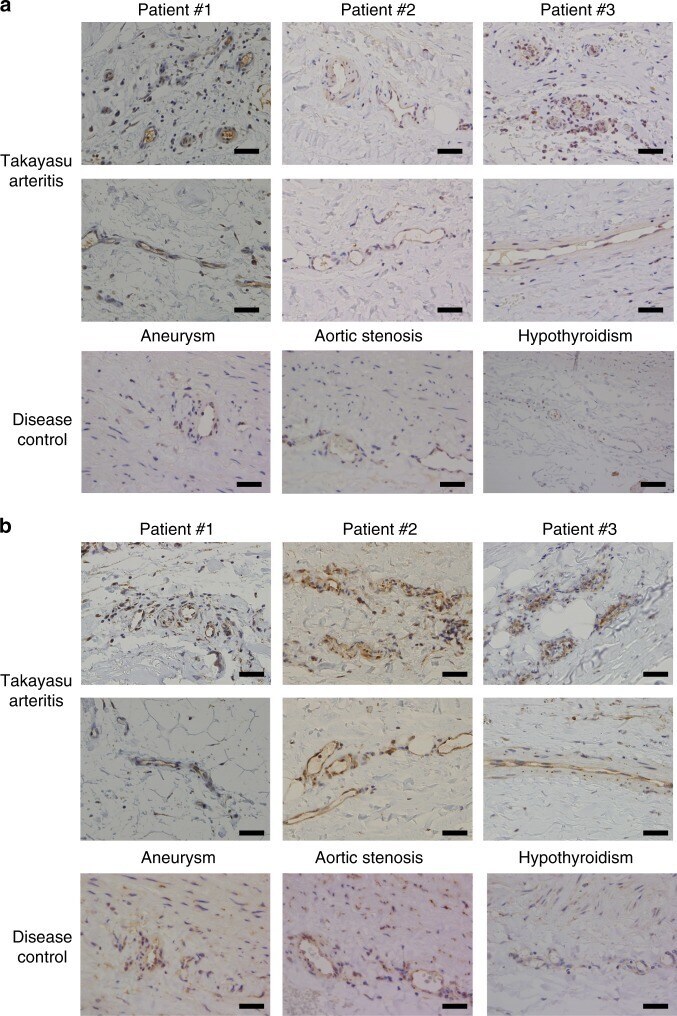
- Fig. 3 Expressions of EPCR and SR-BI in the vasa vasorum of the aorta. Immunohistochemical analysis was performed against EPCR ( a ) and SR-BI ( b ) in resected aortic tissue from three different patients with TAK (upper two columns) and non-inflammatory aortic tissue as disease controls (lower column). Disease controls included surgical specimen from patients with aortic aneurysm and aortic stenosis, and an autopsy sample from a patient with hypothyroidism. Expressions in the vasa vasorum of the aorta are shown. Black bar indicates 40 um.
- Submitted by
- Invitrogen Antibodies (provider)
- Main image
- Experimental details
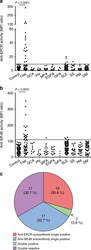
- Fig. 4 Distribution of patients with anti-EPCR and anti-SR-BI activities. a , b The distribution of anti-EPCR ( a ) and anti-SR-BI ( b ) autoantibodies in healthy controls and patients with various autoimmune rheumatic diseases was measured with flow cytometry. Dots represent the data for individual subjects. The broken horizontal line indicates the cut-off value for high activity (mean + 3 SD). Control represents 79 healthy individuals. Autoimmune rheumatic diseases include active Takayasu arteritis (TAK, n = 52), giant cell arteritis (GCA, n = 10), polyarteritis nodosa (PN, n = 7), microscopic polyangiitis (MPA, n = 14), eosinophilic granulomatosis with polyangiitis (EGPA, n = 12), granulomatosis with polyangiitis (GPA, n = 3), systemic lupus erythematosus (SLE, n = 93), Sjogren's syndrome (SS, n = 18), polymyositis (PM, n = 24), and dermatomyositis (DM, n = 47). c The relative frequency of anti-EPCR and anti-SR-BI autoantibodies in patients with active TAK ( n = 52) is shown. The numbers of patients and their proportions are indicated in the Figure. Statistical analysis was performed using one-way ANOVA test followed by Tukey's post hoc test. MFI represents mean fluorescent intensity.

- Submitted by
- Invitrogen Antibodies (provider)
- Main image
- Experimental details
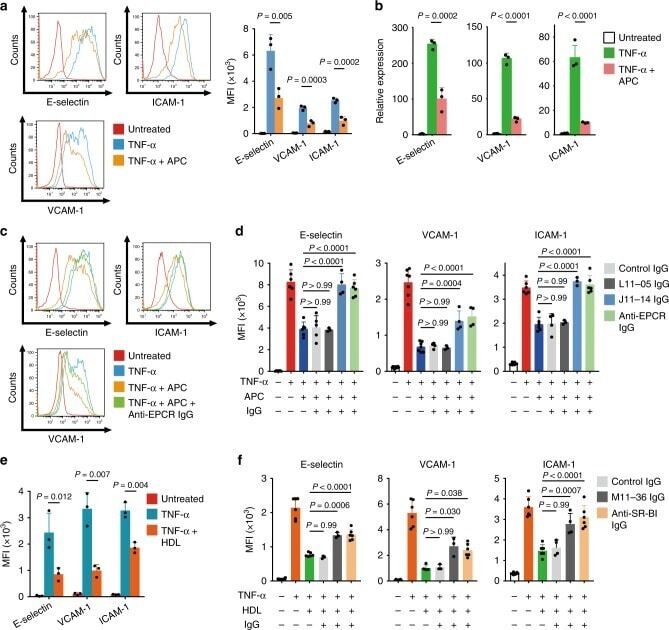
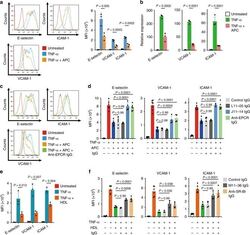
- Fig. 5 Blocking of anti-inflammatory activities of EPCR and SR-BI by autoantibodies in Takayasu arteritis. a , b HUVECs were treated with or without 10 µg/mL APC for 13 h and stimulated with 100 pg/mL TNF-alpha for 5 h. The expression of adhesion molecules, including E-selectin, VCAM-1, and ICAM-1, was analyzed with flow cytometry. Representative histograms (left) and the summary graph (right, n = 3) are shown in a . The mRNA expression level was measured by quantitative PCR in b . GAPDH was used as the internal control. c HUVECs were incubated with the isotype or 10 µg/mL anti-EPCR antibody for 1 h and treated with or without 10 µg/mL APC for 13 h. Then, cells were stimulated with 100 pg/mL TNF-alpha for 5 h. The expression of adhesion molecules was analyzed with flow cytometry. d HUVECs were incubated with or without IgG for 1 h. IgG included 10 µg/mL anti-EPCR antibody, 2.56 mg/mL control IgG, 2.56 mg/mL IgG from an AECA-negative TAK sample (L11-05), or 2.56 mg/mL IgG from anti-EPCR-positive TAK AECA sample (J11-14). The cells were subsequently treated as described above, and the expression of adhesion molecules was analyzed. e HUVECs were treated with or without 1 mg/mL high-density lipoprotein (HDL) for 16 h and stimulated with 100 pg/mL TNF-alpha for 5 h. Adhesion molecules were analyzed by flow cytometry; the summary graph is shown ( n = 5). f HUVECs were incubated with or without IgG for 1 h. IgG included 10 µg/mL anti-SR-BI antibody, 2.5