 Explore
 Validate
 Learn
Learn Western blot
 Other assay
Antibody data
- Antibody Data
- Antigen structure
- References [1]
- Comments [0]
- Validations
- Other assay [3]
Submit
Validation data
Reference
Comment
Report error
- Product number
- PA5-69064 - Provider product page

- Provider
- Invitrogen Antibodies
- Product name
- SIDT2 Polyclonal Antibody
- Antibody type
- Polyclonal
- Antigen
- Synthetic peptide
- Description
- This target displays homology in the following species: Cow: 100%; Dog: 93%; Guinea Pig: 100%; Horse: 93%; Human: 100%; Mouse: 93%; Rabbit: 93%; Rat: 100%
- Reactivity
- Human
- Host
- Rabbit
- Isotype
- IgG
- Vial size
- 100 μL
- Concentration
- 0.5 mg/mL
- Storage
- -20°C, Avoid Freeze/Thaw Cycles
Submitted references Sidt2 is a key protein in the autophagy-lysosomal degradation pathway and is essential for the maintenance of kidney structure and filtration function.
Geng MY, Wang L, Song YY, Gu J, Hu X, Yuan C, Yang M, Pei WJ, Zhang Y, Gao JL
Cell death & disease 2021 Dec 18;13(1):7
Cell death & disease 2021 Dec 18;13(1):7
No comments: Submit comment
Supportive validation
- Submitted by
- Invitrogen Antibodies (provider)
- Main image
- Experimental details
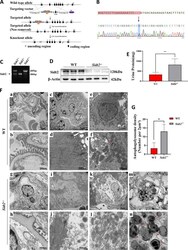
- Fig. 1 Kidney damage and autophagolysosome accumulation in Sidt2 -/- mice. A Cre-LoxP system gene targeting schematic; B above is the exported sequence diagram of Sidt2 gene knockout mouse tail DNA; below is the sequencing map, the arrow indicating the location of the missing gene. Compared with WT mice, a 199 bp gene loss occurs in exon 2; C DNA level verification of Sidt2 (extracted from tail tissue). The primer-amplified product contains the base knockout region, shown as Sidt2 + /+ (WT), Sidt2 +/- , or Sidt2 -/- ; D protein level verification to detect Sidt2 protein expression levels by western blot; E kidney 24 h urine protein in WT and Sidt2 -/- mice; F ultra-micro-morphological structure of the kidneys of WT mice (a, f) and Sidt2 -/- mice (g-n). Compared with the WT mouse, the Sidt2 -/- mouse kidney displays foot process fusion, basement membrane thickening (g, h), renal tubular epithelial cell edema, microvilli damage (i, j), mitochondrial destruction (k, l), and autophagolysosome accumulation (m, n); G total number of renal autophagolysosomes in WT and Sidt2 -/- mice. * P < 0.05, ** P < 0.01.

- Submitted by
- Invitrogen Antibodies (provider)
- Main image
- Experimental details
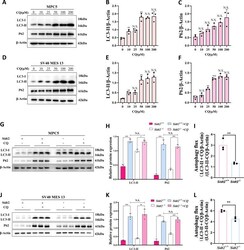
- Fig. 4 Autophagy degradation disorder after Sidt2 deletion in mouse kidney cells. A LC3-II and P62 expression by MPC5 cells incubated for 16 h with 0, 10, 25, 50, 100, or 200 muM CQ shown by western blot; B LC3-II statistical chart of MPC5 cells; C P62 statistical chart of MPC5 cells; D SV40 MES 13 cell incubation for 16 h with 0, 10, 25, 50, 100, or 200 muM CQ. Western blot shows LC3-II and P62 expression; E LC3-II statistical chart of SV40 MES 13 cells; F SV40 MES 13 cell P62 statistical chart; G determination whether CQ induces the expression of key autophagy proteins before and after Sidt2 knockout in MPC5 cells; H statistical chart of ( G ); I changes in the autophagy flux in MPC5 cells on Sidt2 knockout (LC3-II + CQ/beta-Actin)/(LC3-II - CQ/beta-Actin) (ref. []); J determination whether chloroquine induces the expression of key autophagy proteins before and after Sidt2 knockout in SV40 MES 13 cells; K statistical chart of ( J ); L changes of the autophagy flux in SV40 MES 13 cells on Sidt2 knockout (LC3-II + CQ/beta-Actin)/(LC3-II - CQ/beta-Actin) (ref. []). * P < 0.05, ** P < 0.01, *** P < 0.001.

- Submitted by
- Invitrogen Antibodies (provider)
- Main image
- Experimental details
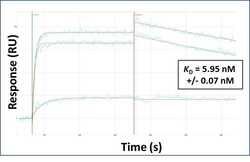
- Surface Plasmon Resonance of SIDT2 polyclonal antibody (Product # PA5-69064). Purified polyclonal antibodies were immobilized on a Protein A/G coated Carterra LSA sensor chip at concentrations of 0.5, 5, and 50 µg/mL. Antibodies on the surface were exposed to interaction with peptides sequentially via microfluidic controlled flow at 333 nm peptide concentration for kinetic characterization of the binders for affinity and specificity, followed by curve fitting using the Kinetics software. Kd determinations for either two or three concentrations were averaged and results and standard deviation are shown.
