 Explore
 Validate
 Learn
Learn Western blot
Antibody data
- Antibody Data
- Antigen structure
- References [4]
- Comments [0]
- Validations
- Western blot [2]
- Other assay [6]
Submit
Validation data
Reference
Comment
Report error
- Product number
- PA5-78770 - Provider product page

- Provider
- Invitrogen Antibodies
- Product name
- AMOTL2 Polyclonal Antibody
- Antibody type
- Polyclonal
- Antigen
- Recombinant full-length protein
- Description
- Reconstitute with 0.2 mL of distilled water to yield a concentration of 500 µg/mL.
- Reactivity
- Human, Mouse, Rat
- Host
- Rabbit
- Isotype
- IgG
- Vial size
- 100 µg
- Concentration
- 500 µg/mL
- Storage
- -20°C
Submitted references AMOTL2 restrains transforming growth factor-β1-induced proliferation and extracellular matrix deposition of airway smooth muscle cells via the down-regulation of YAP1 activation.
Identification of response signatures for tankyrase inhibitor treatment in tumor cell lines.
A Small-Molecule Tankyrase Inhibitor Reduces Glioma Stem Cell Proliferation and Sphere Formation.
Tankyrase inhibition sensitizes melanoma to PD-1 immune checkpoint blockade in syngeneic mouse models.
Fang P, Deng WJ, Fan N, Shi J, Shi HY, Ou L, Pan JL, Yang SY
Environmental toxicology 2021 Nov;36(11):2225-2235
Environmental toxicology 2021 Nov;36(11):2225-2235
Identification of response signatures for tankyrase inhibitor treatment in tumor cell lines.
Mygland L, Brinch SA, Strand MF, Olsen PA, Aizenshtadt A, Lund K, Solberg NT, Lycke M, Thorvaldsen TE, Espada S, Misaghian D, Page CM, Agafonov O, Nygård S, Chi NW, Lin E, Tan J, Yu Y, Costa M, Krauss S, Waaler J
iScience 2021 Jul 23;24(7):102807
iScience 2021 Jul 23;24(7):102807
A Small-Molecule Tankyrase Inhibitor Reduces Glioma Stem Cell Proliferation and Sphere Formation.
Kierulf-Vieira KS, Sandberg CJ, Waaler J, Lund K, Skaga E, Saberniak BM, Panagopoulos I, Brandal P, Krauss S, Langmoen IA, Vik-Mo EO
Cancers 2020 Jun 19;12(6)
Cancers 2020 Jun 19;12(6)
Tankyrase inhibition sensitizes melanoma to PD-1 immune checkpoint blockade in syngeneic mouse models.
Waaler J, Mygland L, Tveita A, Strand MF, Solberg NT, Olsen PA, Aizenshtadt A, Fauskanger M, Lund K, Brinch SA, Lycke M, Dybing E, Nygaard V, Bøe SL, Heintz KM, Hovig E, Hammarström C, Corthay A, Krauss S
Communications biology 2020 Apr 24;3(1):196
Communications biology 2020 Apr 24;3(1):196
No comments: Submit comment
Supportive validation
- Submitted by
- Invitrogen Antibodies (provider)
- Main image

- Experimental details
- Western blot analysis of AMOTL2 in, Lane 1: rat brain tissue lysates, Lane 2: rat lung tissue lysates, Lane 3: mouse lung tissue lysates, Lane 4: mouse liver tissue lysates. Electrophoresis was performed on a 5-20% SDS-PAGE gel at 70V (Stacking gel) / 90V (Resolving gel) for 2-3 hours. The sample well of each lane was loaded with 50 µg of sample under reducing conditions. After Electrophoresis, proteins were transferred to a Nitrocellulose membrane at 150mA for 50-90 minutes. The membrane was blocked with 5% Non-fat Milk/ TBS for 1. 5 hour at RT. The membrane was incubated with AMOTL2 Polyclonal Antibody (Product # PA5-78770) at 0.5 μg/mL overnight at 4°C, then washed with TBS-0. 1% Tween 3 times with 5 minutes each and probed with a goat anti-rabbit IgG-HRP secondary antibody at a dilution of 1:10000 for 1. 5 hour at RT. The signal is developed using an Enhanced Chemiluminescent detection (ECL) kit. A specific band was detected for AMOTL2 at approximately 95KD. The expected band size for AMOTL2 is at 86KD.

- Submitted by
- Invitrogen Antibodies (provider)
- Main image

- Experimental details
- Western blot analysis of AMOTL2 in Lane 1: human placenta tissue lysate using 50 µg (reducing conditions) per well. Electrophoresis was performed on 5-20% SDS-PAGE gel at 70V (Stacking gel) / 90V (Resolving gel) for 2-3 hours and protein was transferred to a nitrocellulose membrane at 150mA for 50-90 minutes. Sample was blocked with 5% Non-fat Milk/TBS for 1.5 hours at room temperature, incubated with AMOTL2 polyclonal antibody (Product # PA5-78770) at a dilution of 0.5 µg/mL (overnight at 4°C), followed by goat anti-rabbit IgG-HRP secondary antibody at a dilution of 1:10,000. Signal development was performed using a chemiluminescence (ECL) kit.

Supportive validation
- Submitted by
- Invitrogen Antibodies (provider)
- Main image

- Experimental details
- Figure 5 G007-LK inhibits YAP signaling in the selected cell line panel and all cell lines depend on YAP for sustained proliferation (A) Endpoint MTS proliferation assay (Abs 492 ) 5-8 days after transfection with siRNA against YAP relative to control (100%, EGFP ) and experiment time 0 values (t 0 , 0%). Mean values +-SD for one representative experiment of minimum three repeated assays with six replicates each are shown. For A and D , two-tailed t-tests are indicated by ** (p < 0.01) and Mann-Whitney rank-sum tests are indicated by ++ (p < 0.01) and + (p < 0.05). (B) Immunoblots of cytoplasmic AMOT, AMOTL1, and AMOTL2 (upper panels) and nuclear YAP and TAZ (lower panels) after 24- or 72-h treatment with G007-LK (1 muM) compared to controls (0.01% DMSO). Actin and lamin B1 document protein loading and representative data from two or more independent experiments are shown. (C) YAP signaling target gene transcription (log 2 ) after 24-h treatment with G007-LK (1 muM) compared to controls (0.01% DMSO) (n = 2). NA = not available, no RNA detection. (D) Real-time RT-qPCR analyses of YAP signaling target genes, CCN1 , CCN2, and AMOTL2 , upon 24-h G007-LK treatment (1 muM) relative to control (0.01% DMSO). Mean values +-SD for combined data from a minimum of two independent experiments with three replicates each are shown. See also Figures 6 , S5 , and S6 .

- Submitted by
- Invitrogen Antibodies (provider)
- Main image

- Experimental details
- Figure 3 G007-LK stabilizes AMOT/AMOTL2 and reduces the expression of YAP/TAZ target genes. The effect of G007-LK treatment on the ( A ) cytoplasmic and ( B ) nuclear levels of YAP/TAZ signaling proteins; ( C ) Fold changes in gene expression of YAP/TAZ target genes, as assessed by qPCR upon treatment with G007-LK. For both analyses, GSC cultures were treated for 72 h with G007-LK (500 nM) or DMSO (0.01%). Values are relative to those of the DMSO control and are expressed as the fold changes from the DMSO control. The results are presented as the mean +- SD. * p < 0.05.

- Submitted by
- Invitrogen Antibodies (provider)
- Main image

- Experimental details
- 1 FIGURE The effect of TGF-beta1 stimulation on AMOTL2 expression. (A) The identification of primary mouse ASM cells via immunostaining alpha-SMA. Mouse ASM cells were stimulated with TGF-beta1 at various concentrations (2.5, 5, and 10 ng/ml) for 24 h, and AMOTL2 expression was examined via (B) RT-qPCR and (C, D) western blotting assays ( n = 3). Mouse ASM cells were stimulated with 5 ng/ml TGF-beta1 for 12, 24, and 48 h, and AMOTL2 expression was determined via (E) RT-qPCR and (F, G) western blotting assays ( n = 3). * p < 0.05

- Submitted by
- Invitrogen Antibodies (provider)
- Main image

- Experimental details
- 2 FIGURE The effect of AMOTL2 overexpression on TGF-beta1-induced proliferation and ECM gene expression in ASM cells. Mouse ASM cells were transfected with AMOTL2 vectors for 48 h prior to TGF-beta1 (5 ng/ml) stimulation. (A) Levels of AMOTL2 mRNA were measured via the RT-qPCR assay ( n = 3). (B, C) Protein levels of AMOTL2 were determined via the western blotting assay ( n = 3). Cell proliferation was measured via (D) the CCK-8 assay ( n = 5) and (E, F) EdU assay ( n = 3). Levels of (G) collagen Ialpha1 and (H) fibronectin mRNA were assessed via the RT-qPCR assay ( n = 3). ** p < 0.01 and *** p < 0.001

- Submitted by
- Invitrogen Antibodies (provider)
- Main image

- Experimental details
- 3 FIGURE The effect of AMOTL2 depletion on TGF-beta1-induced proliferation and ECM gene expression in ASM cells. Mouse ASM cells were transfected with AMOTL2 shRNA (shAMOTL2) or scrambled shRNA (shScrambled) for 48 h prior to TGF-beta1 (5 ng/ml) stimulation. (A, B) Protein levels of AMOTL2 were examined via the western blotting assay ( n = 3). Cell proliferation was assessed via (C) the CCK-8 assay ( n = 5) and (D, E) EdU assay ( n = 3). Levels of (F) collagen Ialpha1 and (G) fibronectin mRNA were determined via the RT-qPCR assay ( n = 3). ** p < 0.01

- Submitted by
- Invitrogen Antibodies (provider)
- Main image
- Experimental details
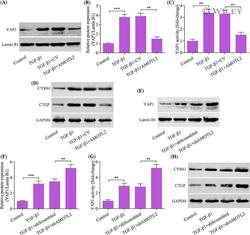
- 4 FIGURE The regulatory effect of AMOTL2 on TGF-beta1-induced YAP1 activation. (A, B) Effects of AMOTL2 overexpression on the levels of nuclear YAP1 were determined via western blotting assay ( n = 3). Lamin B1 served as a loading control. (C) Effects of AMOTL2 overexpression on YAP1 activity were assessed via the luciferase reporter assay ( n = 4). (D) Effects of AMOTL2 overexpression on CTGF and CYR61 expression were measured via the western blotting assay ( n = 3). (E, F) Effects of AMOTL2 depletion on levels of nuclear YAP1 were evaluated via the western blotting assay ( n = 3). (G) Effects of AMOTL2 depletion on YAP1 activity were monitored via the luciferase reporter assay ( n = 4). (H) Effects of AMOTL2 depletion on CTGF and CYR61 expression were examined via the western blotting assay ( n = 3). ** p < 0.01 and *** p < 0.001
