 Explore
 Validate
 Learn
Learn Western blot
Antibody data
- Antibody Data
- Antigen structure
- References [29]
- Comments [0]
- Validations
- Western blot [2]
- Immunocytochemistry [7]
- Flow cytometry [3]
- Other assay [11]
Submit
Validation data
Reference
Comment
Report error
- Product number
- PA1-650 - Provider product page

- Provider
- Invitrogen Antibodies
- Product name
- PMP70 Polyclonal Antibody
- Antibody type
- Polyclonal
- Antigen
- Synthetic peptide
- Description
- PA1-650 detects peroxisomal membrane protein 70 (PMP70) from mouse tissues. PA1-650 has been successfully used in Western blot, flow cytometry, and immunofluorescence procedures. By Western blot, this antibody detects an ~70 kDa protein representing PMP70 from peroxisome-enriched fractions from L cells. PA1-650 immunizing peptide corresponds to amino acid residues 644-659 from rat PMP70. This sequence is completely conserved in mouse PMP70 and differs from human PMP70 by a single amino acid substitution. PA1-650 immunizing peptide (Cat. # PEP-038) is available for use in neutralization and control experiments.
- Reactivity
- Human, Mouse, Rat
- Host
- Rabbit
- Isotype
- IgG
- Vial size
- 100 µg
- Concentration
- 1 mg/mL
- Storage
- -20° C, Avoid Freeze/Thaw Cycles
Submitted references CFTR Rescue by Lumacaftor (VX-809) Induces an Extensive Reorganization of Mitochondria in the Cystic Fibrosis Bronchial Epithelium.
Genotype-phenotype correlations and disease mechanisms in PEX13-related Zellweger spectrum disorders.
Autophagy Inhibitors Do Not Restore Peroxisomal Functions in Cells With the Most Common Peroxisome Biogenesis Defect.
Peroxisomal L-bifunctional protein (EHHADH) deficiency causes male-specific kidney hypertrophy and proximal tubular injury in mice.
The molecular and metabolic program by which white adipocytes adapt to cool physiologic temperatures.
PI5P4Ks drive metabolic homeostasis through peroxisome-mitochondria interplay.
Changes in NAD and Lipid Metabolism Drive Acidosis-Induced Acute Kidney Injury.
Symmetrically dispersed spectroscopic single-molecule localization microscopy.
Feature-rich covalent stains for super-resolution and cleared tissue fluorescence microscopy.
Accelerating multicolor spectroscopic single-molecule localization microscopy using deep learning.
Coagulopathy in Malnourished Mice Is Sexually Dimorphic and Regulated by Nutrient-Sensing Nuclear Receptors.
Alternative Splicing and Cleavage of GLUT8.
Acute inactivation of retromer and ESCPE-1 leads to time-resolved defects in endosomal cargo sorting.
Ceapins block the unfolded protein response sensor ATF6α by inducing a neomorphic inter-organelle tether.
UBL3 modification influences protein sorting to small extracellular vesicles.
Long-chain acyl-CoA synthetase 1 interacts with key proteins that activate and direct fatty acids into niche hepatic pathways.
A Phosphatidylinositol 3-Kinase Effector Alters Phagosomal Maturation to Promote Intracellular Growth of Francisella.
Integrated systems biology analysis of KSHV latent infection reveals viral induction and reliance on peroxisome mediated lipid metabolism.
Peroxisomal protein PEX13 functions in selective autophagy.
LRP1 regulates peroxisome biogenesis and cholesterol homeostasis in oligodendrocytes and is required for proper CNS myelin development and repair.
Peroxisomal localization of the proopiomelanocortin-derived peptides beta-lipotropin and beta-endorphin.
Applications of laser scanning cytometry in immunohistochemistry and routine histopathology.
Gene expression analysis in rats treated with experimental acetyl-coenzyme A carboxylase inhibitors suggests interactions with the peroxisome proliferator-activated receptor alpha pathway.
Flow cytometric assessment of peroxisome proliferation from frozen liver of fibrate-treated monkeys.
Small interfering RNA knockdown of calcium-independent phospholipases A2 beta or gamma inhibits the hormone-induced differentiation of 3T3-L1 preadipocytes.
Visualization and quantitation of peroxisomes using fluorescent nanocrystals: treatment of rats and monkeys with fibrates and detection in the liver.
Peroxisome proliferator-activated receptor-alpha regulates postischemic liver injury.
Expression of fatty acid binding proteins inhibits lipid accumulation and alters toxicity in L cell fibroblasts.
Biogenesis of peroxisomes: immunocytochemical investigation of peroxisomal membrane proteins in proliferating rat liver peroxisomes and in catalase-negative membrane loops.
Braccia C, Christopher JA, Crook OM, Breckels LM, Queiroz RML, Liessi N, Tomati V, Capurro V, Bandiera T, Baldassari S, Pedemonte N, Lilley KS, Armirotti A
Cells 2022 Jun 16;11(12)
Cells 2022 Jun 16;11(12)
Genotype-phenotype correlations and disease mechanisms in PEX13-related Zellweger spectrum disorders.
Borgia P, Baldassari S, Pedemonte N, Alkhunaizi E, D'Onofrio G, Tortora D, Calì E, Scudieri P, Balagura G, Musante I, Diana MC, Pedemonte M, Vari MS, Iacomino M, Riva A, Chimenz R, Mangano GD, Mohammadi MH, Toosi MB, Ashrafzadeh F, Imannezhad S, Karimiani EG, Accogli A, Schiaffino MC, Maghnie M, Soler MA, Echiverri K, Abrams CK, Striano P, Fortuna S, Maroofian R, Houlden H, Zara F, Fiorillo C, Salpietro V
Orphanet journal of rare diseases 2022 Jul 19;17(1):286
Orphanet journal of rare diseases 2022 Jul 19;17(1):286
Autophagy Inhibitors Do Not Restore Peroxisomal Functions in Cells With the Most Common Peroxisome Biogenesis Defect.
Klouwer FCC, Falkenberg KD, Ofman R, Koster J, van Gent D, Ferdinandusse S, Wanders RJA, Waterham HR
Frontiers in cell and developmental biology 2021;9:661298
Frontiers in cell and developmental biology 2021;9:661298
Peroxisomal L-bifunctional protein (EHHADH) deficiency causes male-specific kidney hypertrophy and proximal tubular injury in mice.
Ranea-Robles P, Portman K, Bender A, Lee K, He JC, Mulholland DJ, Argmann C, Houten SM
Kidney360 2021 Sep;2(9):1441-1454
Kidney360 2021 Sep;2(9):1441-1454
The molecular and metabolic program by which white adipocytes adapt to cool physiologic temperatures.
Mori H, Dugan CE, Nishii A, Benchamana A, Li Z, Cadenhead TS 4th, Das AK, Evans CR, Overmyer KA, Romanelli SM, Peterson SK, Bagchi DP, Corsa CA, Hardij J, Learman BS, El Azzouny M, Coon JJ, Inoki K, MacDougald OA
PLoS biology 2021 May;19(5):e3000988
PLoS biology 2021 May;19(5):e3000988
PI5P4Ks drive metabolic homeostasis through peroxisome-mitochondria interplay.
Ravi A, Palamiuc L, Loughran RM, Triscott J, Arora GK, Kumar A, Tieu V, Pauli C, Reist M, Lew RJ, Houlihan SL, Fellmann C, Metallo C, Rubin MA, Emerling BM
Developmental cell 2021 Jun 7;56(11):1661-1676.e10
Developmental cell 2021 Jun 7;56(11):1661-1676.e10
Changes in NAD and Lipid Metabolism Drive Acidosis-Induced Acute Kidney Injury.
Bugarski M, Ghazi S, Polesel M, Martins JR, Hall AM
Journal of the American Society of Nephrology : JASN 2021 Feb;32(2):342-356
Journal of the American Society of Nephrology : JASN 2021 Feb;32(2):342-356
Symmetrically dispersed spectroscopic single-molecule localization microscopy.
Song KH, Zhang Y, Brenner B, Sun C, Zhang HF
Light, science & applications 2020;9:92
Light, science & applications 2020;9:92
Feature-rich covalent stains for super-resolution and cleared tissue fluorescence microscopy.
Mao C, Lee MY, Jhan JR, Halpern AR, Woodworth MA, Glaser AK, Chozinski TJ, Shin L, Pippin JW, Shankland SJ, Liu JTC, Vaughan JC
Science advances 2020 May;6(22):eaba4542
Science advances 2020 May;6(22):eaba4542
Accelerating multicolor spectroscopic single-molecule localization microscopy using deep learning.
Kumar Gaire S, Zhang Y, Li H, Yu R, Zhang HF, Ying L
Biomedical optics express 2020 May 1;11(5):2705-2721
Biomedical optics express 2020 May 1;11(5):2705-2721
Coagulopathy in Malnourished Mice Is Sexually Dimorphic and Regulated by Nutrient-Sensing Nuclear Receptors.
Preidis GA, Soni KG, Suh JH, Halder T, Kim KH, Choi JM, Li F, Devaraj S, Conner ME, Coarfa C, Jung SY, Moore DD
Hepatology communications 2020 Dec;4(12):1835-1850
Hepatology communications 2020 Dec;4(12):1835-1850
Alternative Splicing and Cleavage of GLUT8.
Alexander CM, Martin JA, Oxman E, Kasza I, Senn KA, Dvinge H
Molecular and cellular biology 2020 Dec 21;41(1)
Molecular and cellular biology 2020 Dec 21;41(1)
Acute inactivation of retromer and ESCPE-1 leads to time-resolved defects in endosomal cargo sorting.
Evans AJ, Daly JL, Anuar ANK, Simonetti B, Cullen PJ
Journal of cell science 2020 Aug 3;133(15)
Journal of cell science 2020 Aug 3;133(15)
Ceapins block the unfolded protein response sensor ATF6α by inducing a neomorphic inter-organelle tether.
Torres SE, Gallagher CM, Plate L, Gupta M, Liem CR, Guo X, Tian R, Stroud RM, Kampmann M, Weissman JS, Walter P
eLife 2019 May 31;8
eLife 2019 May 31;8
UBL3 modification influences protein sorting to small extracellular vesicles.
Ageta H, Ageta-Ishihara N, Hitachi K, Karayel O, Onouchi T, Yamaguchi H, Kahyo T, Hatanaka K, Ikegami K, Yoshioka Y, Nakamura K, Kosaka N, Nakatani M, Uezumi A, Ide T, Tsutsumi Y, Sugimura H, Kinoshita M, Ochiya T, Mann M, Setou M, Tsuchida K
Nature communications 2018 Sep 26;9(1):3936
Nature communications 2018 Sep 26;9(1):3936
Long-chain acyl-CoA synthetase 1 interacts with key proteins that activate and direct fatty acids into niche hepatic pathways.
Young PA, Senkal CE, Suchanek AL, Grevengoed TJ, Lin DD, Zhao L, Crunk AE, Klett EL, Füllekrug J, Obeid LM, Coleman RA
The Journal of biological chemistry 2018 Oct 26;293(43):16724-16740
The Journal of biological chemistry 2018 Oct 26;293(43):16724-16740
A Phosphatidylinositol 3-Kinase Effector Alters Phagosomal Maturation to Promote Intracellular Growth of Francisella.
Ledvina HE, Kelly KA, Eshraghi A, Plemel RL, Peterson SB, Lee B, Steele S, Adler M, Kawula TH, Merz AJ, Skerrett SJ, Celli J, Mougous JD
Cell host & microbe 2018 Aug 8;24(2):285-295.e8
Cell host & microbe 2018 Aug 8;24(2):285-295.e8
Integrated systems biology analysis of KSHV latent infection reveals viral induction and reliance on peroxisome mediated lipid metabolism.
Sychev ZE, Hu A, DiMaio TA, Gitter A, Camp ND, Noble WS, Wolf-Yadlin A, Lagunoff M
PLoS pathogens 2017 Mar;13(3):e1006256
PLoS pathogens 2017 Mar;13(3):e1006256
Peroxisomal protein PEX13 functions in selective autophagy.
Lee MY, Sumpter R Jr, Zou Z, Sirasanagandla S, Wei Y, Mishra P, Rosewich H, Crane DI, Levine B
EMBO reports 2017 Jan;18(1):48-60
EMBO reports 2017 Jan;18(1):48-60
LRP1 regulates peroxisome biogenesis and cholesterol homeostasis in oligodendrocytes and is required for proper CNS myelin development and repair.
Lin JP, Mironova YA, Shrager P, Giger RJ
eLife 2017 Dec 18;6
eLife 2017 Dec 18;6
Peroxisomal localization of the proopiomelanocortin-derived peptides beta-lipotropin and beta-endorphin.
Höftberger R, Kunze M, Voigtländer T, Unterberger U, Regelsberger G, Bauer J, Aboul-Enein F, Garzuly F, Forss-Petter S, Bernheimer H, Berger J, Budka H
Endocrinology 2010 Oct;151(10):4801-10
Endocrinology 2010 Oct;151(10):4801-10
Applications of laser scanning cytometry in immunohistochemistry and routine histopathology.
Peterson RA, Krull DL, Butler L
Toxicologic pathology 2008 Jan;36(1):117-32
Toxicologic pathology 2008 Jan;36(1):117-32
Gene expression analysis in rats treated with experimental acetyl-coenzyme A carboxylase inhibitors suggests interactions with the peroxisome proliferator-activated receptor alpha pathway.
Waring JF, Yang Y, Healan-Greenberg CH, Adler AL, Dickinson R, McNally T, Wang X, Weitzberg M, Xu X, Lisowski A, Warder SE, Gu YG, Zinker BA, Blomme EA, Camp HS
The Journal of pharmacology and experimental therapeutics 2008 Feb;324(2):507-16
The Journal of pharmacology and experimental therapeutics 2008 Feb;324(2):507-16
Flow cytometric assessment of peroxisome proliferation from frozen liver of fibrate-treated monkeys.
Kwanyuen P, Witherspoon SM, Creech DR, Colton HM, Falls JG, Cariello NF
International journal of toxicology 2006 Jan-Feb;25(1):41-7
International journal of toxicology 2006 Jan-Feb;25(1):41-7
Small interfering RNA knockdown of calcium-independent phospholipases A2 beta or gamma inhibits the hormone-induced differentiation of 3T3-L1 preadipocytes.
Su X, Mancuso DJ, Bickel PE, Jenkins CM, Gross RW
The Journal of biological chemistry 2004 May 21;279(21):21740-8
The Journal of biological chemistry 2004 May 21;279(21):21740-8
Visualization and quantitation of peroxisomes using fluorescent nanocrystals: treatment of rats and monkeys with fibrates and detection in the liver.
Colton HM, Falls JG, Ni H, Kwanyuen P, Creech D, McNeil E, Casey WM, Hamilton G, Cariello NF
Toxicological sciences : an official journal of the Society of Toxicology 2004 Jul;80(1):183-92
Toxicological sciences : an official journal of the Society of Toxicology 2004 Jul;80(1):183-92
Peroxisome proliferator-activated receptor-alpha regulates postischemic liver injury.
Okaya T, Lentsch AB
American journal of physiology. Gastrointestinal and liver physiology 2004 Apr;286(4):G606-12
American journal of physiology. Gastrointestinal and liver physiology 2004 Apr;286(4):G606-12
Expression of fatty acid binding proteins inhibits lipid accumulation and alters toxicity in L cell fibroblasts.
Atshaves BP, Storey SM, Petrescu A, Greenberg CC, Lyuksyutova OI, Smith R 3rd, Schroeder F
American journal of physiology. Cell physiology 2002 Sep;283(3):C688-703
American journal of physiology. Cell physiology 2002 Sep;283(3):C688-703
Biogenesis of peroxisomes: immunocytochemical investigation of peroxisomal membrane proteins in proliferating rat liver peroxisomes and in catalase-negative membrane loops.
Baumgart E, Völkl A, Hashimoto T, Fahimi HD
The Journal of cell biology 1989 Jun;108(6):2221-31
The Journal of cell biology 1989 Jun;108(6):2221-31
No comments: Submit comment
Supportive validation
- Submitted by
- Invitrogen Antibodies (provider)
- Main image
- Experimental details
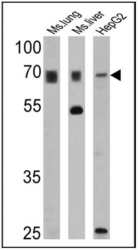
- Western blot analysis of PMP70 was performed by loading 25 µg of mouse lung (lane 1), mouse liver (lane 2) and HepG2 (lane 3) cell lysates onto an SDS polyacrylamide gel. Proteins were transferred to a PVDF membrane and blocked at 4ºC overnight. The membrane was probed with a PMP70 polyclonal antibody (Product # PA1-650) at a dilution of 1:1000 overnight at 4°C, washed in TBST, and probed with an HRP-conjugated secondary antibody for 1 hr at room temperature in the dark. Chemiluminescent detection was performed using Pierce ECL Plus Western Blotting Substrate (Product # 32132). Results show a band at ~70 kDa.

- Submitted by
- Invitrogen Antibodies (provider)
- Main image
- Experimental details
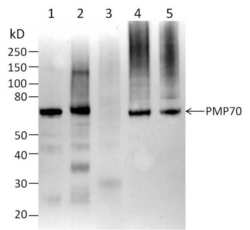
- Western blot analysis of Peroxisomal Membrane Protein 70 (PMP70) was performed by loading the following whole cell extracts: 20 µg Rat Kidney (Lane 1), 20 µg Rat Liver (Lane 2), 20 µg Mouse Lung (Lane 3), 10 µg A431 cells (Lane 4), and 10 µg U2OS cells (Lane 5) per well onto a 4-20% Bis-Tris polyacrylamide gel. Proteins were transferred to a nitrocellulose membrane and the membrane was probed with Pierce Fast Western Kit (Product # 35050). The membrane was probed with PMP70 Polyclonal antibody (Product # PA1-650) at a dilution of 1:500 for 30 minutes at room temperature on a rocking platform per Fast Western Kit instructions. The membrane was then washed in kit wash buffer and probed with kit secondary antibody reagent for 10 minutes (diluted at 150 µL per 10 mL kit reagent diluents). The membrane was then washed in kit wash buffer and chemiluminescent detection was performed using SuperSignal West Dura (Product # 34075).

Supportive validation
- Submitted by
- Invitrogen Antibodies (provider)
- Main image

- Experimental details
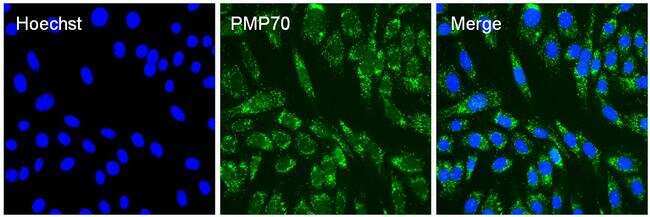
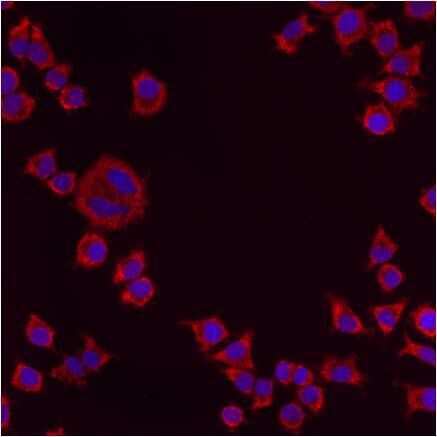
- Immunofluorescent analysis of PMP70 (green) in 3T3 cells. The cells were permeabilized with 0.1% Triton X-100 in TBS for 15 minutes, and blocked with 3% Blocker BSA in PBS (Product # 37525) for 15 minutes at room temperature. Cells were stained with a PMP70 rabbit polyclonal antibody (Product # PA1-650), at a dilution of 10 µg/mL in blocking buffer for at least 1 hour at room temperature, and then incubated with a Goat anti-Rabbit IgG Superclonal secondary antibody, Alexa Fluor 488 conjugate (Product # A27034) at a dilution of 1:1000 for 30 minutes at room temperature (green). Nuclei (blue) were stained with Hoechst 33342 dye (Product # 62249). Images were taken on a Thermo Scientific ToxInsight Instrument at 20X magnification.
- Submitted by
- Invitrogen Antibodies (provider)
- Main image

- Experimental details
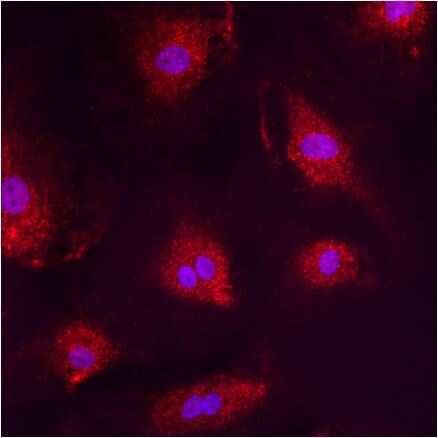
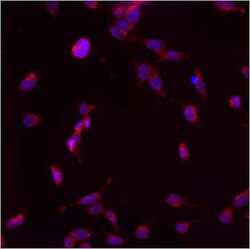
- Immunofluorescent analysis of PMP70 using anti-PMP70 polyclonal antibody (Product # PA1-650) shows staining in A549 Cells.

- Submitted by
- Invitrogen Antibodies (provider)
- Main image

- Experimental details
- Immunofluorescent analysis of PMP70 using anti-PMP70 polyclonal antibody (Product # PA1-650) shows staining in HMVEC Cells.
- Submitted by
- Invitrogen Antibodies (provider)
- Main image

- Experimental details
- Immunofluorescent analysis of PMP70 using anti-PMP70 polyclonal antibody (Product # PA1-650) shows staining in NS-1 Cells.
- Submitted by
- Invitrogen Antibodies (provider)
- Main image
- Experimental details
- Immunofluorescent analysis of PMP70 using anti-PMP70 polyclonal antibody (Product # PA1-650) shows staining in p19 Cells.

- Submitted by
- Invitrogen Antibodies (provider)
- Main image

- Experimental details
- Immunofluorescence analysis of PMP70 was performed using 70% confluent log phase A-431 cells. The cells were fixed with 4% paraformaldehyde for 10 minutes, permeabilized with 0.1% Triton™ X-100 for 15 minutes, and blocked with 2% BSA for 1 hour at room temperature. The cells were labeled with PMP70 Rabbit Polyclonal Antibody (Product # PA1-650) at 5 µg/mL in 0.1% BSA, incubated at 4 degree celsius overnight and then labeled with Goat anti-Rabbit IgG (H+L), Superclonal™ Recombinant Secondary Antibody, Alexa Fluor 488 (Product # A27034) at a dilution of 1:2000 for 45 minutes at room temperature (Panel a: green). Nuclei (Panel b: blue) were stained with ProLong™ Diamond Antifade Mountant with DAPI (Product # P36962). F-actin (Panel c: red) was stained with Rhodamine Phalloidin (Product # R415). Panel d represents the merged image showing cytoplasmic (peroxisomal pattern) localization. Panel e represents control cells with no primary antibody to assess background. The images were captured at 60X magnification.

- Submitted by
- Invitrogen Antibodies (provider)
- Main image

- Experimental details
- Knockdown of PMP70 was achieved by transfecting A-431 cells with PMP70 specific siRNA (Silencer® select Product # s11616). Immunofluorescence analysis was performed on A-431 cells (untransfected, panel a,d), transfected with non-specific scrambled siRNA (panels b,e) and transfected with PMP70 specific siRNA (panel c,f). Cells were fixed, permeabilized, and labelled with PMP70 Rabbit Polyclonal Antibody (Product # PA1-650, 5 µg/mL), followed by Goat anti-Rabbit IgG (H+L) Superclonal™ Recombinant Secondary Antibody, Alexa Fluor® 488 (Product # A27034, 1:2000). Nuclei (blue) were stained using ProLong™ Diamond Antifade Mountant with DAPI (Product # P36962), and Rhodamine Phalloidin (Product # R415, 1:300) was used for cytoskeletal F-actin (red) staining. Reduction of specific signal was observed upon siRNA mediated knockdown (panel c,f) confirming specificity of the antibody to PMP70 (green). The images were captured at 60X magnification.

Supportive validation
- Submitted by
- Invitrogen Antibodies (provider)
- Main image
- Experimental details
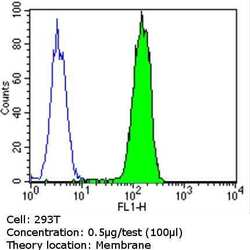
- Flow cytometry analysis of PMP70 in 293T cells (green) compared to an isotype control (blue). Cells were harvested, adjusted to a concentration of 1-5x10^6 cells/mL, fixed with 2% paraformaldehyde and washed with PBS. Cells were blocked with a 2% solution of BSA-PBS for 30 min at room temperature and incubated with a PMP70 polyclonal antibody (Product # PA1-650) at a dilution of 0.5 µg/test for 60 min at room temperature. Cells were then incubated for 40 min at room temperature in the dark using a Dylight 488-conjugated goat anti-rabbit IgG (H+L) secondary antibody and re-suspended in PBS for FACS analysis.

- Submitted by
- Invitrogen Antibodies (provider)
- Main image

- Experimental details
- Flow cytometry analysis of PMP70 in HepG2 cells (green) compared to an isotype control (blue). Cells were harvested, adjusted to a concentration of 1-5x10^6 cells/mL, fixed with 2% paraformaldehyde and washed with PBS. Cells were blocked with a 2% solution of BSA-PBS for 30 min at room temperature and incubated with a PMP70 polyclonal antibody (Product # PA1-650) at a dilution of 0.5 µg/test for 60 min at room temperature. Cells were then incubated for 40 min at room temperature in the dark using a Dylight 488-conjugated goat anti-rabbit IgG (H+L) secondary antibody and re-suspended in PBS for FACS analysis.

- Submitted by
- Invitrogen Antibodies (provider)
- Main image

- Experimental details
- Flow cytometry analysis of PMP70 in NIH-3T3 cells (green) compared to an isotype control (blue). Cells were harvested, adjusted to a concentration of 1-5x10^6 cells/mL, fixed with 2% paraformaldehyde and washed with PBS. Cells were blocked with a 2% solution of BSA-PBS for 30 min at room temperature and incubated with a PMP70 polyclonal antibody (Product # PA1-650) at a dilution of 0.5 µg/test for 60 min at room temperature. Cells were then incubated for 40 min at room temperature in the dark using a Dylight 488-conjugated goat anti-rabbit IgG (H+L) secondary antibody and re-suspended in PBS for FACS analysis.

Supportive validation
- Submitted by
- Invitrogen Antibodies (provider)
- Main image
- Experimental details
- NULL

- Submitted by
- Invitrogen Antibodies (provider)
- Main image
- Experimental details
- NULL
- Submitted by
- Invitrogen Antibodies (provider)
- Main image

- Experimental details
- NULL

- Submitted by
- Invitrogen Antibodies (provider)
- Main image

- Experimental details
- FIGURE 2 Autophagy inhibitors do not restore peroxisomal import of PTS1- and PTS2-targeted peroxisomal matrix proteins in primary PEX1-G843D fibroblasts. Immunoblot analysis of homogenates of primary fibroblasts from two PBD-ZSD patients homozygous for the PEX1-G843D mutation [PEX1-G843D(1) (A) and PEX1-G843D(2) (B) ] treated as described in Figure 1A . The protein levels of the PMPs ACBD5 and ABCD3 and the ratio of the processed over unprocessed forms of PTS1-targeted ACOX1 and PTS2- targeted thiolase were determined using specific antibodies. Below the ACOX1 bands, the corresponding ratios between the intensity of processed (50 kDa) over unprocessed (70 kDa) ACOX1 bands are indicated. Below the thiolase bands, the corresponding ratios between the intensity of processed (41 kDa) over unprocessed (44 kDa) thiolase bands are indicated. Below the ACBD5 and ABCD3 bands, the corresponding signal intensity relative to the tubulin band intensity, which was used as a loading control, is indicated. Homogenates of non-treated control fibroblasts and PEX1- fibroblasts (PEX1 -/- ) were used for reference. The effect of the different treatments on autophagy was assessed by determining the relative protein levels of the autophagy adaptor protein SQSTM1/P62 (P62; relative to tubulin levels) and the ratio of MAPILC3B-II (LC3-II) over MAPILC3B-I (LC3-I). Cells were incubated for 7 days with the different compounds, except for bafilomycin (24 h incubation). Experiments were repeated twice

- Submitted by
- Invitrogen Antibodies (provider)
- Main image

- Experimental details
- FIGURE 4 Autophagy inhibitors do not restore import of peroxisomal matrix proteins and metabolic functions in transformed-and-immortalized patient cells. The effect of treatment with different compounds on peroxisomal matrix protein import and peroxisomal metabolic functions was assessed in previously reported PEX1-G843D fibroblasts that had been transformed and immortalized (tr/immPEX1-G843D) () as well as in the same cells stably overexpressing GFP-PTS1 (tr/immPEX1-G843D + GFP-PTS1) (). Cells were treated with 20 mM L-arginine (L-arg), 5% glycerol (Gly), 10 muM hydroxychloroquine (HCQ), or 10 mM 3-methyladenine (3-MA) for 24 h. (A) Quantification of tr/immPEX1-G843D cells that display functional peroxisomal catalase import after treatment. Cells were analyzed by immunofluorescence microscopy to determine the subcellular localization of catalase (> 150 cells analyzed for each condition). (B) Density of ABCD3 punctated structures (indicating peroxisomal membranes) per cell area determined in treated tr/immPEX1-G843D cells using immunofluorescence microscopy (see Materials and Methods for more details). Data is presented as mean of n > 45 cells +- SD. (C) Immunoblot analysis of homogenates of tr/immPEX1-G843D cells, which were treated for 7 days with the different compounds. The protein levels and processing of thiolase and the PMPs ACBD5 and ABCD3 were determined using specific antibodies. Below the thiolase bands, the corresponding ratios between the intensity of processed (

- Submitted by
- Invitrogen Antibodies (provider)
- Main image

- Experimental details
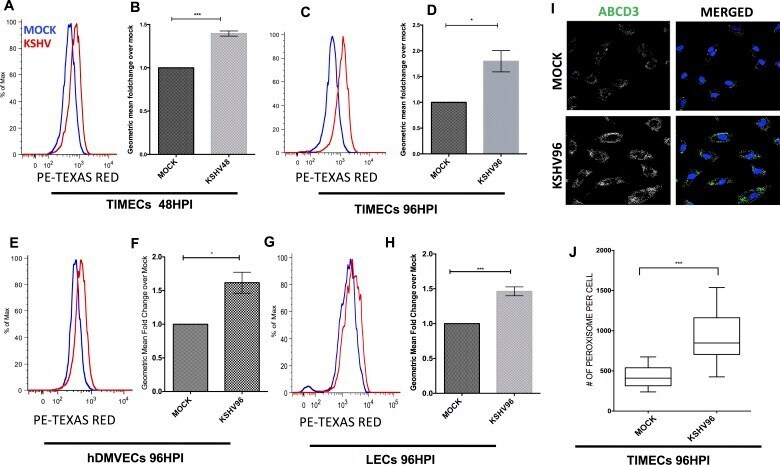
- Fig 4 KSHV latently infected endothelial cells induces peroxisome formation. (A.) Flow cytometry of mock- and KSHV- infected TIME cells (TIMECs) harvested at 48 hpi, fixed and stained with antibody to ABCD3, a peroxisome marker. (B.) Geometric mean fold change of KSHV over mock at 48hpi for 3 experiments as in panel A, p < 0.05 student's t-test. (C.) Flow cytometry of mock- and KSHV- infected TIMECs, harvested at 96 hpi, fixed and stained as in panel A. (D.) Geometric mean Fold change of KSHV over mock at 96 hpi for 3 experiments as in panel C, p < .05 student's t-test. (E.) Flow cytometry of mock- and KSHV- infected primary human dermal microvascular endothelial cells (hDMVECs) harvested at 96 hpi, fixed and stained as in A. (F.) Geometric mean fold change of KSHV over mock at 96 hpi for 3 experiments as in E, p < .05 student's t-test. (G.) Flow cytometry of mock- and KSHV- infected lymphatic endothelial cells (LECs) harvested at 96 hpi, fixed and stained as in A. (H.) Geometric mean fold change of KSHV over mock at 96 hpi for 3 experiments as in panel B, p < .05 student's t-test. All the data are represented as mean +/- SEM and were analyzed using FlowJo software. (I) Representative confocal images of Mock and KSHV infected TIME cells at 96 hpi stained with antibody to ABCD3 and DAPI to identify the nuclei. (J) Quantification of number of peroxisomes per cell in three biological replicates of Mock and KSHV-infected cells stained as in panel I, analyzed using student's t-
- Submitted by
- Invitrogen Antibodies (provider)
- Main image

- Experimental details
- 10.1371/journal.ppat.1006256.g005 Fig 5 KSHV latency locus is sufficient to induce a peroxisome marker in endothelial cells. (A.) Flow cytometry of mock-, KSHV-UV irradiated and KSHV- infected TIME cells harvested at 96 hpi, fixed and stained with antibody to ABCD3. (B.) Geometric mean fold change of KSHV, KSHV-UV-irradiated over mock at 96 hpi for 3 experiments as in A, p < .05 student's t -test. (C.) Flow cytometry of AdGFP or AdKLAR (KSHV latency-associated region in a gutted adenovirus) infected TIME cells harvested at 96 hpi, fixed and stained with antibody to ABCD3. (D.) Geometric mean fold change of AdGFP over AdKLAR at 96 hpi p < .05 student's t-test. All the data are represented as mean +/- SEM and were analyzed using FlowJo software. (E.) Western blot analysis of TIME cells mock infected or infected with AdGFP-, or AdKLAR stained with antibodies to GFP or LANA.

- Submitted by
- Invitrogen Antibodies (provider)
- Main image

- Experimental details
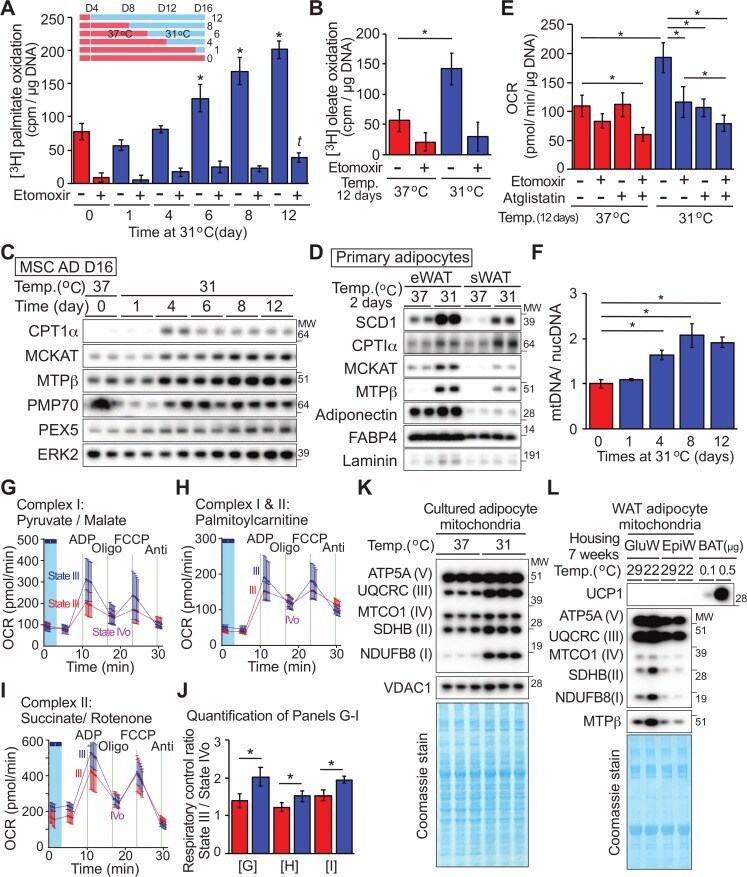
- 10.1371/journal.pbio.3000988.g005 Fig 5 Cool adaptation of adipocytes stimulates beta-oxidation of fatty acids and increases number and functioning of mitochondria. ( A, B ) Adipocytes at indicated days of cool temperature exposure ( A ; n = 5) or for 12 days ( B ; n = 6) were incubated with tritiated palmitate ( A ) or oleate ( B ) for 3 hours +/- 40 muM etomoxir. * significantly different from day 0 control at 37degC; p < 0.05). t indicates a difference from day 0 etomoxir treatment. ( C ) Cool adaptation increases mitochondrial fatty acid oxidation and peroxisomal proteins. ( D ) Primary adipocytes isolated from eWAT or sWAT were cultured in suspension at either 37degC or 31degC for 2 days. Expression of SCD1, CPT1alpha, MCKAT, and MTPbeta was then determined by immunoblot analyses; adiponectin, FABP4, and laminin were loading controls. ( E ) Elevated basal OCR of adipocytes at 31degC is partially dependent on oxidation of endogenous fatty acids. MSC-derived adipocytes cultured at 31degC or 37degC for 12 days were treated with vehicle, 20 muM etomoxir and/or 20 muM of atglistatin for 2 hours prior and during assay of OCR ( n = 8-10). ( F ) Four-day exposure at 31degC stimulates an increase in mitochondrial number as assessed by qPCR for 2 mitochondrial regions (CytoB, Cox-TMS) and 2 nuclear genes (glucagon, beta-globin; n = 3). ( G - I ) Isolated mitochondria from adipocytes adapted to 31degC have improved functioning of complex I and II. Mitochondria were incubated with m
- Submitted by
- Invitrogen Antibodies (provider)
- Main image

- Experimental details
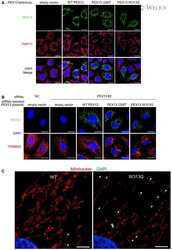
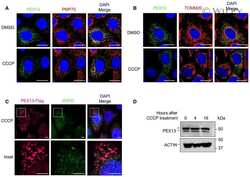
- Analysis of peroxisomes distribution in CFBE41o- cells, parental and expressing both F508del and WT-CFTR, under control condition and following treatment with VX-809. ( A ) Microphotographs showing peroxisomes distribution as evidenced by staining for the peroxisomal markers PMP70 and PEX13 in cells treated either with vehicle alone (DMSO) or with VX-809 (3 uM). PMP70 was stained using a rabbit anti-PMP70 as primary antibody followed by an anti-rabbit secondary antibody conjugated to AlexaFluor 488. PEX13 was stained using a mouse anti-PEX13 as primary antibody followed by an anti-mouse secondary antibody conjugated to AlexaFluor 647. Cell nuclei were counterstained with Hoechst 33342. ( B ) Quantification of the number of PMP70- (left graph) and PEX13- positive (right graph) peroxisomes per cell, in cells treated with DMSO vs. VX-809. Each dot represents the value obtained from the analysis of a different biological replicate, in which 700cells were imaged and analyzed. Lines indicate means +- SD, n = 16. Statistical significance of VX-809 treatment was tested using a Student's t -test. Symbols indicate statistical significance versus DMSO: *** p < 0.001. Scale bar = 25 um. Only statistically significant comparisons are reported.

- Submitted by
- Invitrogen Antibodies (provider)
- Main image

- Experimental details
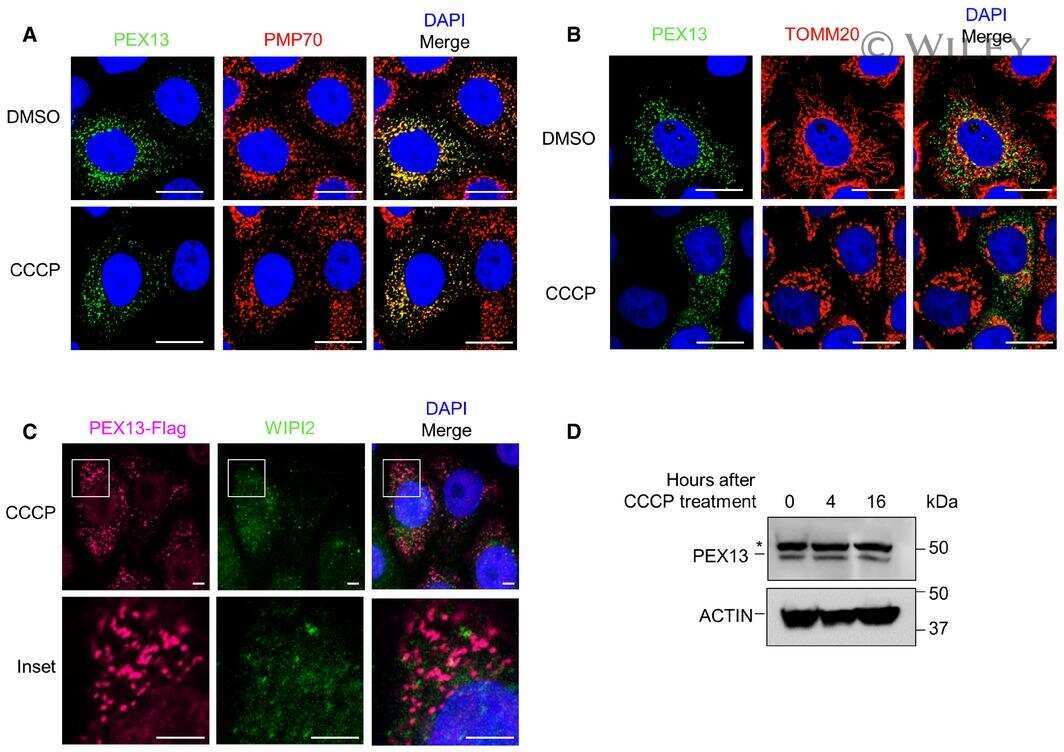
- Analysis of mitochondrial network morphology and peroxisomal distribution in CF and non-CF bronchial epithelia. Well-differentiated bronchial epithelia were generated from two F508del/F508del homozygous CF patients (donor ID: BE49 and BE55) and two non-CF subjects (donor ID: BE165 and BE168). ( A ) Microphotographs showing mitochondrial network as evidenced by staining for the mitochondrial marker TOMM20 in epithelia treated for 24 h either with vehicle alone (DMSO) or with VX-809 (3 uM). ( B ) Scatter dot plots showing results of TOMM20 signal texture analysis (based on SER features). Each dot represents the value obtained from the analysis of one region of 1050 um x 700 um. Lines indicate means +- SD, n = 6. ( C ) Microphotographs showing peroxisomes distribution as evidenced by staining for the peroxisomal markers PMP70 and PEX13 in epithelia treated for 24 h either with vehicle alone (DMSO) or with VX-809 (3 uM). ( D ) Quantification of the calculated percentage of PEX13-positive peroxisomes in each image field. Each dot represents the value obtained from the analysis of one region of 1050 um x 350 um. Lines indicate means +- SD, n = 9. Statistical significance of VX-809 treatment was tested using a Student's t -test. Symbols indicate statistical significance versus DMSO: *** p < 0.001; ** p < 0.01. Scale bar = 40 um. Only statistically significant comparisons are reported.

- Submitted by
- Invitrogen Antibodies (provider)
- Main image

- Experimental details
- 6 FIG. Altered hepatic nuclear receptor expression and FXR agonists in malnutrition. (A-C) Relative concentrations of FXR and PPARalpha protein in liver, determined by western blot, reveal a profound decrease of PPARalpha expression in malnourished male livers (n = 3-4). (D) Relative expression of PMP70 correlates directly with PPARalpha protein levels in malnourished male livers (n = 3-4) and supports qualitative evaluation by electron microscopy revealing loss of hepatocyte peroxisomes (Supporting Fig. S8). (E) Targeted bile acid mass spectrometry from liver, plasma, and stool found total fecal bile acid levels to be significantly decreased in malnourished male mice. (F) Individual stool bile acid metabolites show multiple decreased bile acids and sex specificity (n = 6). Individual liver and plasma bile acid metabolites are shown in Supporting Fig. S9. Data in (B-D) are mean + SD. Box and whisker plots (E,F) show interquartile range (box), median (vertical line), and outliers (whiskers). Student t test; **** P < 0.0001, ** P < 0.01, * P < 0.05 compared to control mice of the same sex. [Corrections added on October 24, 2020 after first online publication: the figure 6 has been replaced with the correct one.]
