 Explore
 Validate
 Learn
Learn Western blot
Antibody data
- Antibody Data
- Antigen structure
- References [1]
- Comments [0]
- Validations
- Western blot [2]
- Immunohistochemistry [1]
- Other assay [3]
Submit
Validation data
Reference
Comment
Report error
- Product number
- PA5-22302 - Provider product page

- Provider
- Invitrogen Antibodies
- Product name
- DPYD Polyclonal Antibody
- Antibody type
- Polyclonal
- Antigen
- Recombinant protein fragment
- Description
- Recommended positive controls: Raji, K562, NCI-H929.
- Concentration
- 0.59 mg/mL
Submitted references P53 represses pyrimidine catabolic gene dihydropyrimidine dehydrogenase (DPYD) expression in response to thymidylate synthase (TS) targeting.
Gokare P, Finnberg NK, Abbosh PH, Dai J, Murphy ME, El-Deiry WS
Scientific reports 2017 Aug 29;7(1):9711
Scientific reports 2017 Aug 29;7(1):9711
No comments: Submit comment
Supportive validation
- Submitted by
- Invitrogen Antibodies (provider)
- Main image
- Experimental details
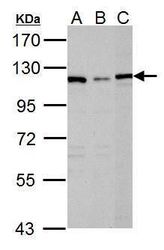
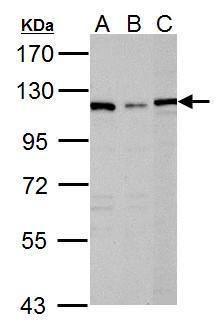
- Western blot analysis of DPYD using 30 µg of A) Raji (B) K562 and C) NCI-H929 lysate. Samples were loaded onto a 7.5% SDS-PAGE gel and probed with a DPYD polyclonal antibody (Product # PA5-22302) at a dilution of 1:1000.
- Submitted by
- Invitrogen Antibodies (provider)
- Main image
- Experimental details
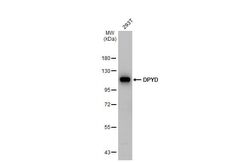
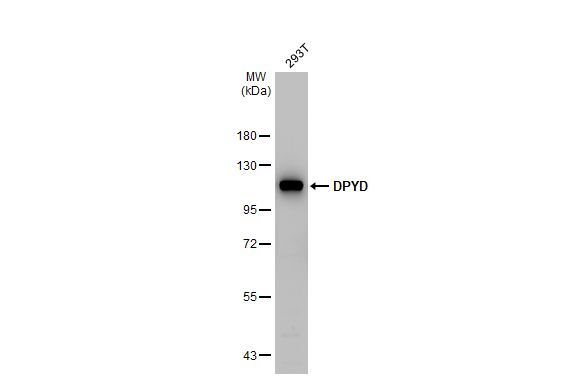
- Western Blot using DPYD Polyclonal Antibody (Product # PA5-22302). Whole cell extract (30 µg) was separated by 7.5% SDS-PAGE, and the membrane was blotted with DPYD Polyclonal Antibody (Product # PA5-22302) diluted at 1:1,000. The HRP-conjugated anti-rabbit IgG antibody was used to detect the primary antibody.
Supportive validation
- Submitted by
- Invitrogen Antibodies (provider)
- Main image

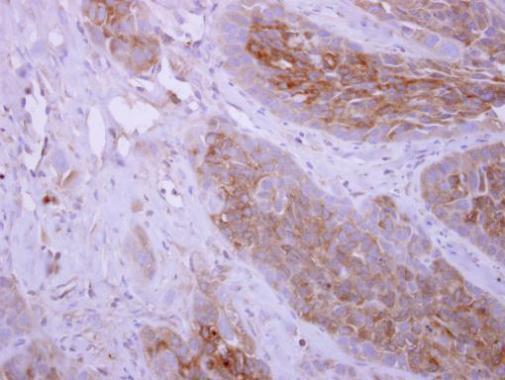
- Experimental details
- DPYD Polyclonal Antibody detects DPYD protein at cytoplasm on H358 xenograft by immunohistochemical analysis. Sample: Paraffin-embedded H358 xenograft. DPYD Polyclonal Antibody (Product # PA5-22302) dilution: 1:500. Antigen Retrieval: EDTA based buffer, pH 8.0, 15 min.
Supportive validation
- Submitted by
- Invitrogen Antibodies (provider)
- Main image
- Experimental details
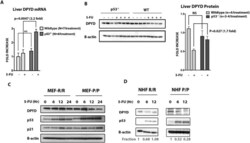
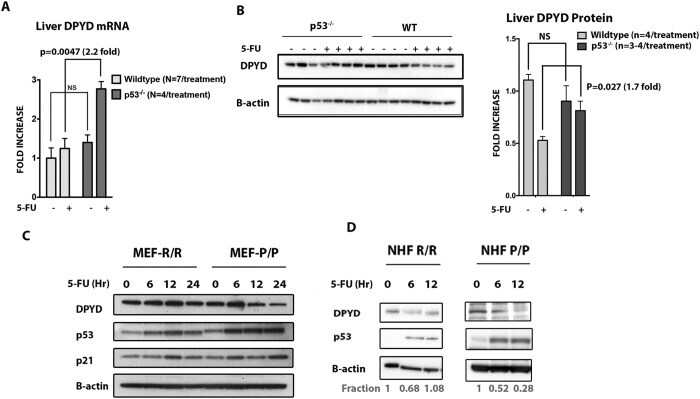
- Figure 2 p53-dependent repression of DPYD expression in intact liver and impact of human p53 polymorphic variants on liver expression of DPYD . ( A and B ) Fold-change in expression of DPYD mRNA and protein in livers of p53 +/+ (wild-type,) and p53 -/- mice. P-values are determined Multiple t test.and one way Anova [NT vs 5-FU in p53 +/+ mice for DPYD mRNA is p = 0.08; DPYD protein p = 0.0021and NT vs 5-FU in p53 -/- mice for DPYD mRNA is p = 0.040; DPYD protein p = 0.09] ( C ) HUPKI Codon R72P MEF-R/R or MEF-P/P were treated with 5-FU (384 muM) up to 24 hr and DPYD protein expression in MEF-P/P or MEF-R/R allele was evaluated by western blot. ( D ) DPYD protein expression in Normal human fibroblast cell line harboring Codon R72P polymorphism, i.e., NHF P/P and NHF R/R is evaluated by western blot after treatment with 5-FU for the indicated times.
- Submitted by
- Invitrogen Antibodies (provider)
- Main image

- Experimental details
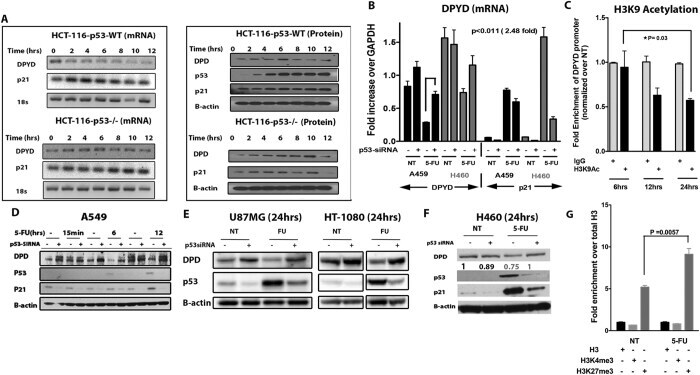
- Figure 3 The tumor suppressor p53 represses dihydropyrimidine dehydrogenase (DPYD) expression. (A) mRNA and protein expression of DPYD in HCT-116 p53 +/+ and HCT-116 p53 -/- cell lines at indicated times after 5-FU (384 muM) treatment. (B) Fold-expression of mRNA in A549 and H460 cell lines at 24 hr after 5-FU (384 muM) treatment with and without siRNA knockdown of p53 (P = 0.0011 N = 3). (C) H3K9 Acetylation at DPYD promoter following 5-FU treatment for indicated time points. Values are normalized in the sequence [input > IgG > total H3 > No Treatment (NT)] (N = 3). (D , E , F) Protein expression of DPYD in A549, U87MG, HT-1080 and H460 is shown after western blotting at the indicated time points with and without siRNA knockdown of p53. (G) H3K4me3 and H3K27me3 at DPYD promoter at 24hrs after 5-FU treatment. Values normalized in the sequence [input > IgG > total H3] (N = 3).
- Submitted by
- Invitrogen Antibodies (provider)
- Main image
- Experimental details
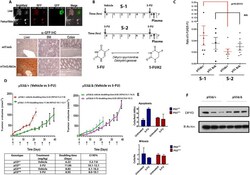
- Figure 4 TP53 -specific liver depletion upregulates the catabolism of 5-FU through DPYD. (A) . Liver specific expression of Cre in Albcre;mT/mG;p53 Delta/Delta mice as seen by expression of GFP and normal histology of liver, Bone marrow (BM) and colon in these mice (B) 5-FU treatment schedule for mice (p53 Delta/+ and p53 Delta/Delta ) with liver specific deletion of the TP53 gene, [S-1 = First dose Vehicle (6hrs) + second dose 5-FU(30 min)]; S-2 = [First dose 5-FU(6hrs) + second dose 5-FU(30 min)]. (C) Ratio of the amount of 5-FUH 2 /5-FU in plasma of liver specific p53 Delta/ + and p53 Delta/Delta genotypes following the treatment plan described in ( B ) (Values represent median n = 5-7; p = 0.0313 Wilcoxon-rank-sum test). (D) Tumor growth delay (TGD) of syngeneic p53dmc-Ras-Myc colonocytes injected subcutaneously (s.c.) into liver specific p53 Delta/ + and p53 Delta/Delta and treated with vehicle or 5-FU IV (100 mg/kg/week, for a total of 6 weeks) (N = 3-5, Doubling time calculated by exponential growth equation). (E) Analysis of cell death and proliferation in syngeneic tumors on p53 Delta/ + and p53 Delta/Delta at the study in ( C ) as indicated by number of apoptotic and mitotic nu clei(N = 3). (F) Representative western blot showing expression of DPYD in liver of p53 Delta/ + and p53 Delta/Delta mice with prior treatment of 5-FU for 6 hrs as indicated in ( B ) and ( C ).
