Antibody data
- Antibody Data
- Antigen structure
- References [11]
- Comments [0]
- Validations
- Western blot [5]
- Immunocytochemistry [5]
- Immunohistochemistry [3]
- Other assay [11]
Submit
Validation data
Reference
Comment
Report error
- Product number
- MA5-32307 - Provider product page

- Provider
- Invitrogen Antibodies
- Product name
- ACE2 Recombinant Rabbit Monoclonal Antibody (SN0754)
- Antibody type
- Monoclonal
- Antigen
- Synthetic peptide
- Description
- Recombinant rabbit monoclonal antibodies are produced using in vitro expression systems. The expression systems are developed by cloning in the specific antibody DNA sequences from immunoreactive rabbits. Then, individual clones are screened to select the best candidates for production. The advantages of using recombinant rabbit monoclonal antibodies include: better specificity and sensitivity, lot-to-lot consistency, animal origin-free formulations, and broader immunoreactivity to diverse targets due to larger rabbit immune repertoire.
- Reactivity
- Human, Mouse, Rat
- Host
- Rabbit
- Isotype
- IgG
- Antibody clone number
- SN0754
- Vial size
- 100 µL
- Concentration
- 1 mg/mL
- Storage
- Store at 4°C short term. For long term storage, store at -20°C, avoiding freeze/thaw cycles.
Submitted references More tools for our toolkit: The application of HEL-299 cells and dsRNA-nanoparticles to study human coronaviruses in vitro.
Spike protein multiorgan tropism suppressed by antibodies targeting SARS-CoV-2.
Human Nasal and Lung Tissues Infected Ex Vivo with SARS-CoV-2 Provide Insights into Differential Tissue-Specific and Virus-Specific Innate Immune Responses in the Upper and Lower Respiratory Tract.
Targeting Polyamines Inhibits Coronavirus Infection by Reducing Cellular Attachment and Entry.
Identification of Required Host Factors for SARS-CoV-2 Infection in Human Cells.
Lung cancer models reveal SARS-CoV-2-induced EMT contributes to COVID-19 pathophysiology.
Selinexor, a novel selective inhibitor of nuclear export, reduces SARS-CoV-2 infection and protects the respiratory system in vivo.
Dodging COVID-19 infection: low expression and localization of ACE2 and TMPRSS2 in multiple donor-derived lines of human umbilical cord-derived mesenchymal stem cells.
Tissue Distribution of ACE2 Protein in Syrian Golden Hamster (Mesocricetus auratus) and Its Possible Implications in SARS-CoV-2 Related Studies.
Elevated ACE-2 expression in the olfactory neuroepithelium: implications for anosmia and upper respiratory SARS-CoV-2 entry and replication.
Human Induced Pluripotent Stem Cell-Derived Lung Epithelial System for SARS-CoV-2 Infection Modeling and Its Potential in Drug Repurposing.
Semple SL, Alkie TN, Jenik K, Warner BM, Tailor N, Kobasa D, DeWitte-Orr SJ
Virus research 2022 Nov;321:198925
Virus research 2022 Nov;321:198925
Spike protein multiorgan tropism suppressed by antibodies targeting SARS-CoV-2.
Brady M, McQuaid C, Solorzano A, Johnson A, Combs A, Venkatraman C, Rahman A, Leyva H, Kwok WE, Wood RW, Deane R
Communications biology 2021 Nov 22;4(1):1318
Communications biology 2021 Nov 22;4(1):1318
Human Nasal and Lung Tissues Infected Ex Vivo with SARS-CoV-2 Provide Insights into Differential Tissue-Specific and Virus-Specific Innate Immune Responses in the Upper and Lower Respiratory Tract.
Alfi O, Yakirevitch A, Wald O, Wandel O, Izhar U, Oiknine-Djian E, Nevo Y, Elgavish S, Dagan E, Madgar O, Feinmesser G, Pikarsky E, Bronstein M, Vorontsov O, Jonas W, Ives J, Walter J, Zakay-Rones Z, Oberbaum M, Panet A, Wolf DG
Journal of virology 2021 Jun 24;95(14):e0013021
Journal of virology 2021 Jun 24;95(14):e0013021
Targeting Polyamines Inhibits Coronavirus Infection by Reducing Cellular Attachment and Entry.
Firpo MR, Mastrodomenico V, Hawkins GM, Prot M, Levillayer L, Gallagher T, Simon-Loriere E, Mounce BC
ACS infectious diseases 2021 Jun 11;7(6):1423-1432
ACS infectious diseases 2021 Jun 11;7(6):1423-1432
Identification of Required Host Factors for SARS-CoV-2 Infection in Human Cells.
Daniloski Z, Jordan TX, Wessels HH, Hoagland DA, Kasela S, Legut M, Maniatis S, Mimitou EP, Lu L, Geller E, Danziger O, Rosenberg BR, Phatnani H, Smibert P, Lappalainen T, tenOever BR, Sanjana NE
Cell 2021 Jan 7;184(1):92-105.e16
Cell 2021 Jan 7;184(1):92-105.e16
Lung cancer models reveal SARS-CoV-2-induced EMT contributes to COVID-19 pathophysiology.
Stewart CA, Gay CM, Ramkumar K, Cargill KR, Cardnell RJ, Nilsson MB, Heeke S, Park EM, Kundu ST, Diao L, Wang Q, Shen L, Xi Y, Zhang B, Della Corte CM, Fan Y, Kundu K, Gao B, Avila K, Pickering CR, Johnson FM, Zhang J, Kadara H, Minna JD, Gibbons DL, Wang J, Heymach JV, Byers LA
bioRxiv : the preprint server for biology 2021 Jan 28;
bioRxiv : the preprint server for biology 2021 Jan 28;
Selinexor, a novel selective inhibitor of nuclear export, reduces SARS-CoV-2 infection and protects the respiratory system in vivo.
Kashyap T, Murray J, Walker CJ, Chang H, Tamir S, Hou B, Shacham S, Kauffman MG, Tripp RA, Landesman Y
Antiviral research 2021 Aug;192:105115
Antiviral research 2021 Aug;192:105115
Dodging COVID-19 infection: low expression and localization of ACE2 and TMPRSS2 in multiple donor-derived lines of human umbilical cord-derived mesenchymal stem cells.
Hernandez JJ, Beaty DE, Fruhwirth LL, Lopes Chaves AP, Riordan NH
Journal of translational medicine 2021 Apr 14;19(1):149
Journal of translational medicine 2021 Apr 14;19(1):149
Tissue Distribution of ACE2 Protein in Syrian Golden Hamster (Mesocricetus auratus) and Its Possible Implications in SARS-CoV-2 Related Studies.
Suresh V, Parida D, Minz AP, Sethi M, Sahoo BS, Senapati S
Frontiers in pharmacology 2020;11:579330
Frontiers in pharmacology 2020;11:579330
Elevated ACE-2 expression in the olfactory neuroepithelium: implications for anosmia and upper respiratory SARS-CoV-2 entry and replication.
Chen M, Shen W, Rowan NR, Kulaga H, Hillel A, Ramanathan M Jr, Lane AP
The European respiratory journal 2020 Sep;56(3)
The European respiratory journal 2020 Sep;56(3)
Human Induced Pluripotent Stem Cell-Derived Lung Epithelial System for SARS-CoV-2 Infection Modeling and Its Potential in Drug Repurposing.
Surendran H, Nandakumar S, Pal R
Stem cells and development 2020 Nov 1;29(21):1365-1369
Stem cells and development 2020 Nov 1;29(21):1365-1369
No comments: Submit comment
Supportive validation
- Submitted by
- Invitrogen Antibodies (provider)
- Main image
- Experimental details
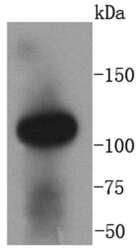
- Western blot analysis of ACE2 in human kidney lysates using a ACE2 Monoclonal antibody (Product # MA5-32307) at a dilution of 1:1,000.
- Submitted by
- Invitrogen Antibodies (provider)
- Main image
- Experimental details
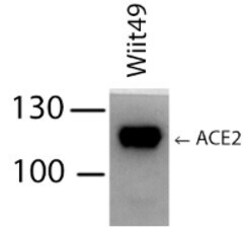
- Western blot analysis of ACE2 was performed by loading 100 ng of whole cell lysates in RIPA Lysis and Extraction buffer (Product # 89900) and Page Ruler Plus Protein Ladder (Product # 26619) onto a 30% Acrylamide/Bis gel. Proteins were transferred to membrane and blocked in 5% milk for one hour at room temperature. ACE2 was detected at approximately 120 kDa using a ACE2 monoclonal antibody (Product # MA5-32307) at a dilution of 1:500 in 5% milk overnight at 4°C on a rocking platform, followed by a goat anti-rabit IgG-HRP secondary antibody at a dilution of 1:5,000 for one hour. Chemiluminescent detection was performed using SuperSignal West Dura (Product # 34076) and the myECL Imager (Product # 62236). Data courtesy of Wei Xu’s laboratory at the University of Wisconsin.
- Submitted by
- Invitrogen Antibodies (provider)
- Main image
- Experimental details
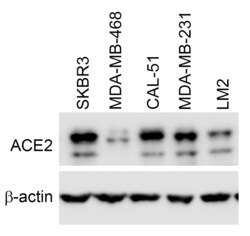
- Western blot analysis of ACE2 was performed by loading 100 ng of whole cell lysates of cell lines indicated in RIPA Lysis and Extraction buffer (Product # 89900) and Page Ruler Plus Protein Ladder (Product # 26619) onto a 30% Acrylamide/Bis gel. Proteins were transferred to membrane and blocked in 5% milk for one hour at room temperature. ACE2 was detected at approximately 120 kDa using a ACE2 monoclonal antibody (Product # MA5-32307) at a dilution of 1:500 in 5% milk overnight at 4°C on a rocking platform, followed by a goat anti-rabit IgG-HRP secondary antibody at a dilution of 1:5,000 for one hour. Chemiluminescent detection was performed using SuperSignal West Dura (Product # 34076) and the myECL Imager (Product # 62236). Data courtesy of Wei Xu’s laboratory at the University of Wisconsin.
- Submitted by
- Invitrogen Antibodies (provider)
- Main image

- Experimental details
- Knockout of ACE2 was achieved by CRISPR-Cas9 genome editing using LentiArray™ Lentiviral sgRNA (Product # A32042, Assay ID CRISPR685753_LV) and LentiArray Cas9 Lentivirus (Product # A32064). Western blot analysis of ACE2 was performed by loading 60 µg of HaCaT Cas9 (Lane 1) and HaCaT ACE2 KO (Lane 2) whole cell extracts. The samples were electrophoresed using NuPAGE™ 3-8% Tris-Acetate Protein Gel (Product # EA0378BOX). Resolved proteins were then transferred onto a nitrocellulose membrane (Product # IB23001) by iBlot® 2 Dry Blotting System (Product # IB21001). The blot was probed with Anti-ACE2 Recombinant Rabbit Monoclonal Antibody (SN0754) (Product # MA5-32307, 1:1000 dilution) and Goat anti-Rabbit IgG (H+L) Superclonal™ Recombinant Secondary Antibody, HRP (Product # A27036, 1:5000 dilution) using the iBright™ FL 1500 (Product # A44115). Chemiluminescent detection was performed using SuperSignal™ West Dura Extended Duration Substrate (Product # 34076). Loss of signal upon CRISPR mediated knockout (KO) using the LentiArray™ CRISPR product line confirms that antibody is specific to ACE2.
- Submitted by
- Invitrogen Antibodies (provider)
- Main image

- Experimental details
- Western Blot was performed using Anti-ACE2 Recombinant Rabbit Monoclonal Antibody (SN0754) (Product # MA5-32307) and a 120 kDa band corresponding to Angiotensin-converting enzyme 2 was observed across all cell lines and tissues tested except in BJ, U2-OS, Mouse Skeletal Muscle and Rat Skeletal Muscle which are known to be low expressing (DOI: 10.3892/mmr.2014.2266, 10.1038/s41433-020-0939-4). Membrane enriched extracts (50 µg lysate) of HaCaT (Lane 1), Hep G2 (Lane 2), RT-4 (Lane 3), BJ (Lane 4), U-2 OS (Lane 5), Mouse Testis (Lane 6), Rat Testis (Lane 7), Mouse Skeletal Muscle (Lane 8) and Rat Skeletal Muscle (Lane 9) were electrophoresed using NuPAGE™ 4-12% Bis-Tris Protein Gel (Product # NP0321BOX). Resolved proteins were then transferred onto a Nitrocellulose membrane (Product # IB23001) by iBlot® 2 Dry Blotting System (Product # IB21001). The Blot was probed with the primary antibody (1:1000 dilution) and detected by chemiluminescence with Goat anti-Rabbit IgG (H+L) Superclonal™ Recombinant Secondary Antibody, HRP (Product # A27036, 1:4000 dilution) using the iBright FL 1000 (Product # A32752). Chemiluminescent detection was performed using Novex® ECL Chemiluminescent Substrate Reagent Kit (Product # WP20005).
Supportive validation
- Submitted by
- Invitrogen Antibodies (provider)
- Main image

- Experimental details
- Immunocytochemical analysis of ACE2 in 293 cells using a ACE2 Monoclonal antibody (Product # MA5-32307) as seen in green. The nuclear counter stain is DAPI (blue). Cells were fixed in paraformaldehyde, permeabilised with 0.25% Triton X100/PBS.
- Submitted by
- Invitrogen Antibodies (provider)
- Main image
- Experimental details
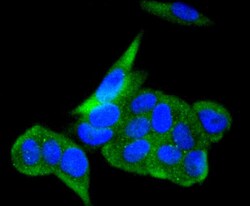
- Immunocytochemical analysis of ACE2 in MCF-7 cells using a ACE2 Monoclonal antibody (Product # MA5-32307) as seen in green. The nuclear counter stain is DAPI (blue). Cells were fixed in paraformaldehyde, permeabilised with 0.25% Triton X100/PBS.
- Submitted by
- Invitrogen Antibodies (provider)
- Main image
- Experimental details
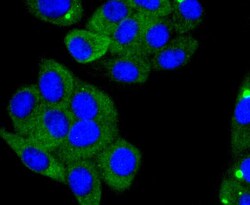
- Immunocytochemical analysis of ACE2 in HepG2 cells using a ACE2 Monoclonal antibody (Product # MA5-32307) as seen in green. The nuclear counter stain is DAPI (blue). Cells were fixed in paraformaldehyde, permeabilised with 0.25% Triton X100/PBS.
- Submitted by
- Invitrogen Antibodies (provider)
- Main image
- Experimental details
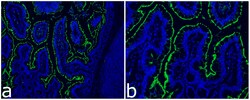
- Immunocytochemistry analysis of ACE-2 (green) in Rhesus Macaques. Cells were stained with ACE2 Recombinant Rabbit Monoclonal Antibody (SN0754) (Product # MA5-32307) followed by incubation with Goat anti-Rabbit IgG (H+L) Highly Cross-Adsorbed Secondary Antibody, Alexa Fluor 488 (Product # A-11034). Nuclei were stained with DAPI. The merged image is shown. Images were taken on EVOS2 at 10X (Fig. a) and 20X (Fig. b) magnification. Data courtesy of J. Arredondo and S. Dandekar at UC Davis.
- Submitted by
- Invitrogen Antibodies (provider)
- Main image
- Experimental details
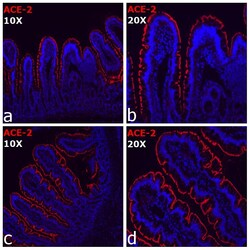
- Immunocytochemistry analysis of ACE-2 (red) in Rhesus Macaques. Cells were stained with ACE2 Recombinant Rabbit Monoclonal Antibody (SN0754) (Product # MA5-32307) followed by incubation with Goat anti-Rabbit IgG (H+L) Highly Cross-Adsorbed Secondary Antibody, Alexa Fluor 555 (Product # A32732). Nuclei were stained with DAPI. The merged images are shown. Images were taken on EVOS2 at 10X (Fig. a,c) and 20X (Fig. b,d) magnification. Data courtesy of J. Arredondo and S. Dandekar at UC Davis.
Supportive validation
- Submitted by
- Invitrogen Antibodies (provider)
- Main image
- Experimental details
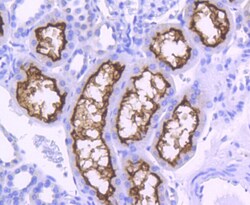
- Immunohistochemical analysis of ACE2 of paraffin-embedded Human kidney tissue using a ACE2 Monoclonal antibody (Product #MA5-32307). Counter stained with hematoxylin.
- Submitted by
- Invitrogen Antibodies (provider)
- Main image
- Experimental details
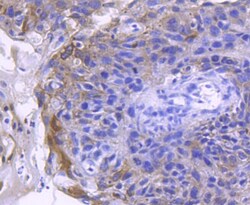
- Immunohistochemical analysis of ACE2 of paraffin-embedded Human breast carcinoma tissue using a ACE2 Monoclonal antibody (Product #MA5-32307). Counter stained with hematoxylin.
- Submitted by
- Invitrogen Antibodies (provider)
- Main image
- Experimental details
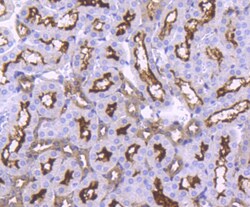
- Immunohistochemical analysis of ACE2 of paraffin-embedded Mouse kidney tissue using a ACE2 Monoclonal antibody (Product #MA5-32307). Counter stained with hematoxylin.
Supportive validation
- Submitted by
- Invitrogen Antibodies (provider)
- Main image

- Experimental details
- FIGURE 1 Validation of MA5-32307 and AF933 antibodies' reactivity and specificity toward hamster ACE2. (A) Immunoblot analysis showing the expression status of ACE2 with two different antibodies (MA5-32307 and AF933) in multiple organ tissues of the Syrian golden hamster. beta-actin was used as an internal control. (B) Immunoblots showing ACE2 expression in hamster kidney, human colorectal adenocarcinoma cells (Caco2), and recombinant human ACE-2 protein (rHu-ACE2) with two different antibodies. (C) Graph showing Ace2 relative mRNA expression in hamster kidney and spleen tissues. (D) Micrographs showing immunofluorescence and immunohistochemical staining of hamster kidney with antibody alone or antibody preincubated with rHu-ACE2 protein (in IHC, scale bar = 25 um).
- Submitted by
- Invitrogen Antibodies (provider)
- Main image
- Experimental details
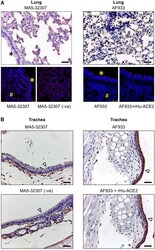
- FIGURE 2 ACE2 expression pattern in hamster lung and trachea tissues. (A , B) Micrographs showing immunohistochemical staining of hamster lung and trachea tissues for ACE2. Corresponding tissues stained without primary antibody or antibody with immunogen preadsorption were used as negative controls. Cells marked with *, #, and symbols indicate bronchial, alveolar, and tracheal epithelial cells (scale bar = 50 um).
- Submitted by
- Invitrogen Antibodies (provider)
- Main image

- Experimental details
- FIGURE 3 ACE2 expression pattern in hamster brain, liver, and heart. (A) Micrographs showing immunohistochemical staining of hamster brain, liver, and heart tissues for ACE2. The arrow symbol indicates positively stained cells in different tissues (scale bar = 50 um). (B) Graph showing Ace2 relative mRNA expression in hamster vital organs from different age and sex groups (n = 3).
- Submitted by
- Invitrogen Antibodies (provider)
- Main image

- Experimental details
- FIGURE 4 ACE2 expression pattern in different parts of the hamster gastrointestinal tract and tongue tissues. Immunohistochemical analysis showing representative images of ACE2 expression at different parts of the hamster gastrointestinal tract and tongue tissues. The arrow symbol indicates positively stained cells in different tissues (scale bar = 50 um).
- Submitted by
- Invitrogen Antibodies (provider)
- Main image
- Experimental details
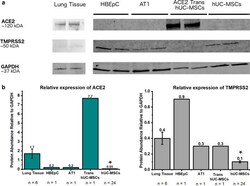
- Fig. 1 a Representative blots. b Expression levels of ACE2 and TMPRSS2 relative to GAPDH in protein homogenates from human lung, primary human bronchial epithelial cells (HBEpC), human pulmonary alveolar type 1 cells (AT1), transfected hUC-MSCs and hUC-MSCs. hUC-MSCs had significantly lower expression of ACE2 (p = 0.002) and TMPRSS2 (p = 0.008) compared to lung homogenates. The coefficient of variance for lung tissue was 46.9% and 52.3% for for hUC-MSC
- Submitted by
- Invitrogen Antibodies (provider)
- Main image

- Experimental details
- Fig. 3 Immunofluorescent staining of ACE2, TMPRSS2 and nuclei for primary human bronchial epithelial cells (HBEpC), human pulmonary alveolar type 1 cells (AT1), transfected hUC-MSCs and hUC-MSCs. White arrows indicate ACE2 expression
- Submitted by
- Invitrogen Antibodies (provider)
- Main image

- Experimental details
- Fig. 4 Flow cytometry for ACE2 and TMPRSS2 of primary human bronchial epithelial cells (HBEpC), human pulmonary alveolar type 1 cells (AT1), transfected hUC-MSCs and hUC-MSCs
- Submitted by
- Invitrogen Antibodies (provider)
- Main image
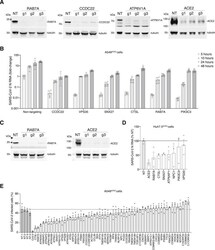
- Experimental details
- Figure S3 Validation of Top-Ranked Genes Using CRISPR Perturbations and RNA Interference, Related to Figure 4 (A) western blot analysis of RAB7A, CCDC22, ATP6V1A, and ACE2 after transduction of A549 ACE2 with the indicated CRISPR guide RNA and selection with puromycin for 7 days. For validation, we designed 3 independent guide RNAs per gene (i.e., distinct guide RNAs from those in the GeCKOv2 library). Beta tubulin was used as loading control. (B) Quantitative PCR (qPCR) of SARS-CoV-2 viral load present in A549 ACE2 CRISPR-perturbed cells infected with SARS-CoV-2 at MOI of 0.1. The qPCR was performed on cells collected at the indicated time (hours) post-infection (hpi) (n = 6 biological replicates, error bars indicate s.e.m.). (C) western blot analysis of RAB7A and ACE2 after transduction of Huh7.5 ACE2 with the indicated CRISPR guide RNA and selection with puromycin for 7 days. For validation, we designed 3 independent guide RNAs per gene (i.e., distinct guide RNAs from those in the GeCKOv2 library). Beta tubulin was used as loading control. (D) qPCR of SARS-CoV-2 viral load present in Huh7.5 ACE2 CRISPR-perturbed cells infected with SARS-CoV-2 at MOI of 0.1. The qPCR was performed on cells collected and fixed at 36 h.p.i (n = 3 guide RNAs with 6 biological replicates each, error bars indicate s.e.m.). (E) Immunofluorescence quantification of SARS-CoV-2 N protein at 36 hours post-infection (hpi) at MOI 0.1 in A549 ACE2 cells pretreated with siRNA pools for 48 hours (n = 3 te
- Submitted by
- Invitrogen Antibodies (provider)
- Main image

- Experimental details
- Figure 1 Selinexor inhibits nuclear export and forces nuclear accumulation of ACE-2 in vitro . Vero E6 cells were incubated with 500nM selinexor or DMSO for 24 hours. a) Cells were fixed with 3% paraformaldehyde, incubated with anti-ACE-2 antibody (Invitrogen, #MA5-32307) followed by a rabbit secondary antibody, Alexa Fluor 488, green-fluorescent dye (Thermo Fisher, #A11008) antibody, then visualized with the Echo Revolve fluorescent microscope (ECHO) at 60x magnification. Membrane-bound ACE-2 receptors are present in DMSO-treated cells only (white arrows). b) Sub-cellular fractionation was performed post-treatment then analyzed by immunoblots and c) quantified by densitometric analysis. d ) Vero E6 and HEK 293 cells were treated with selinexor (550nM, 24h) and whole protein lysates were analyzed on immunoblots. Figure 1
- Submitted by
- Invitrogen Antibodies (provider)
- Main image

- Experimental details
- FIGURE 1 Cellular location of angiotensin-converting enzyme 2 (ACE-2) in human nasal and tracheal biopsies. a-d) Confocal image of ACE-2 (red) and Krt18 (green) immunostaining in the olfactory neuroepithelium from healthy control (a and c) and chronic rhinosinusitis (CRS) patient (b and d). The three-dimensional image (a) shows that the ACE-2 is localised to the apical surface of Krt18-positive sustentacular cells in the olfactory epithelium. Confocal images were obtained under Z stack mode which covered 8 um in depth. The boxed area in panel (a and b) was highlighted in (c and d), respectively. e and f) The location of ACE-2- and DCX-positive immature (e) or PGP9.5-positive mature (f) olfactory sensory neurons in control. g) Confocal image verified the apical expression pattern of ACE-2 by co-staining of Goat anti-ACE-2 and another Rabbit anti-ACE-2 antibody (clone SN0754). The boxed area in (g) was highlighted in right panels. h) Quantification of ACE-2-positive cells per mm olfactory epithelium (OE). At least three images were collected from each specimen (four controls and nine CRS biopsies) using 40xobjectives under the Z stack scan mode at same depth. i and j) Expression of ACE-2 in glands (i) and nasal respiratory epithelium (j). k) No detectable signal in Goat IgG isotype control. l) Quantification of ACE-2-positive cells per mm epithelium. The positive cells in seven tracheal biopsies and 13 nasal specimen that contained both respiratory and olfactory epithelium were
- Submitted by
- Invitrogen Antibodies (provider)
- Main image

- Experimental details
- The ACE2 receptor is absent in HEL-299 cells. Following mRNA extraction from HEL-299 and the positive control HepG2 cell line, C t values for ACE2 and the beta-actin endogenous control were reported via qRT-PCR analysis ( A ). At the protein level, immunocytochemistry (ICC) was completed on HEL-299 cells to probe for the ACE2 receptor ( Bi ). This ICC was also completed on the positive control HepG2 cell line as these cells are known to contain the ACE2 receptor ( Bii ). Both cell types were formalin fixed to glass coverslips and nuclei were stained with DAPI following probing with the rabbit anti-ACE2 antibody. All data represents three independent replicates. Figure 2:
 Explore
 Validate
 Learn
Learn Western blot