Antibody data
- Antibody Data
- Antigen structure
- References [5]
- Comments [0]
- Validations
- Western blot [3]
- ELISA [1]
- Immunohistochemistry [2]
- Flow cytometry [1]
- Other assay [9]
Submit
Validation data
Reference
Comment
Report error
- Product number
- PA5-47488 - Provider product page

- Provider
- Invitrogen Antibodies
- Product name
- ACE2 Polyclonal Antibody
- Antibody type
- Polyclonal
- Antigen
- Recombinant full-length protein
- Description
- In Western blots, approximately 40% cross-reactivity with recombinant human ACE-2 is observed. Reconstitute at 0.2 mg/mL in sterile PBS.
- Reactivity
- Human, Mouse, Rat
- Host
- Goat
- Isotype
- IgG
- Vial size
- 100 µg
- Concentration
- 0.2 mg/mL
- Storage
- -20° C, Avoid Freeze/Thaw Cycles
Submitted references Supporting Cells of the Human Olfactory Epithelium Co-Express the Lipid Scramblase TMEM16F and ACE2 and May Cause Smell Loss by SARS-CoV-2 Spike-Induced Syncytia.
Age-dependent appearance of SARS-CoV-2 entry sites in mouse chemosensory systems reflects COVID-19 anosmia-ageusia symptoms.
Non-neuronal expression of SARS-CoV-2 entry genes in the olfactory system suggests mechanisms underlying COVID-19-associated anosmia.
Neonatal hyperoxia enhances age-dependent expression of SARS-CoV-2 receptors in mice.
Neonatal hyperoxia enhances age-dependent expression of SARS-CoV-2 receptors in mice.
Hernandez-Clavijo A, Gonzalez-Velandia KY, Rangaswamy U, Guarneri G, Boscolo-Rizzo P, Tofanelli M, Gardenal N, Sanges R, Dibattista M, Tirelli G, Menini A
Cellular physiology and biochemistry : international journal of experimental cellular physiology, biochemistry, and pharmacology 2022 Jun 7;56(3):254-269
Cellular physiology and biochemistry : international journal of experimental cellular physiology, biochemistry, and pharmacology 2022 Jun 7;56(3):254-269
Age-dependent appearance of SARS-CoV-2 entry sites in mouse chemosensory systems reflects COVID-19 anosmia-ageusia symptoms.
Brechbühl J, Lopes AC, Wood D, Bouteiller S, de Vallière A, Verdumo C, Broillet MC
Communications biology 2021 Jul 15;4(1):880
Communications biology 2021 Jul 15;4(1):880
Non-neuronal expression of SARS-CoV-2 entry genes in the olfactory system suggests mechanisms underlying COVID-19-associated anosmia.
Brann DH, Tsukahara T, Weinreb C, Lipovsek M, Van den Berge K, Gong B, Chance R, Macaulay IC, Chou HJ, Fletcher RB, Das D, Street K, de Bezieux HR, Choi YG, Risso D, Dudoit S, Purdom E, Mill J, Hachem RA, Matsunami H, Logan DW, Goldstein BJ, Grubb MS, Ngai J, Datta SR
Science advances 2020 Jul 31;6(31)
Science advances 2020 Jul 31;6(31)
Neonatal hyperoxia enhances age-dependent expression of SARS-CoV-2 receptors in mice.
Yee M, Cohen ED, Haak J, Dylag AM, O'Reilly MA
bioRxiv : the preprint server for biology 2020 Jul 22;
bioRxiv : the preprint server for biology 2020 Jul 22;
Neonatal hyperoxia enhances age-dependent expression of SARS-CoV-2 receptors in mice.
Yee M, David Cohen E, Haak J, Dylag AM, O'Reilly MA
Scientific reports 2020 Dec 28;10(1):22401
Scientific reports 2020 Dec 28;10(1):22401
No comments: Submit comment
Supportive validation
- Submitted by
- Invitrogen Antibodies (provider)
- Main image
- Experimental details
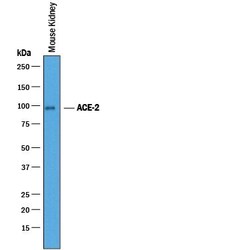
- Western blot analysis of ACE2 in mouse kidney tissue. Samples were incubated in ACE2 polyclonal antibody (Product # PA5-47488) using a dilution of 0.25 µg/mL followed by a HRP-conjugated Anti-Goat IgG secondary antibody. A specific band was detected for ACE‚2 at approximately 95 kDa (as indicated). This experiment was conducted under reducing conditions.
- Submitted by
- Invitrogen Antibodies (provider)
- Main image

- Experimental details
- Western blot analysis of ACE2 in 0.2 mg/mL lysates of mouse kidney tissue. Samples were incubated in ACE2 polyclonal antibody (Product # PA5-47488) using a dilution of 2.5 µg/mL followed by HRP-conjugated Anti-Goat IgG at a dilution of 0.0763888888888889. A specific band was detected for ACE‚2 at approximately 141 kDa (as indicated). This experiment was conducted under reducing conditions and using the 12-230 kDa separation system.
- Submitted by
- Invitrogen Antibodies (provider)
- Main image

- Experimental details
- Western Blot was performed using Anti-ACE2 Polyclonal Antibody (Product # PA5-47488) and a 120 kDa band corresponding to Angiotensin-converting enzyme 2 was observed across all tissues tested except Mouse Skeletal Muscle, Rat Heart, Rat Testis and Rat Skeletal Muscle. Tissue extracts (30 µg lysate) of Mouse Heart (Lane 1), Mouse Kidney (Lane 2), Mouse Testis (Lane 3), Mouse Skeletal Muscle (Lane 4), Mouse Brain (Lane 5), Rat Heart (Lane 6), Rat Kidney (Lane 7), Rat Testis (Lane 8) and Rat Skeletal Muscle (Lane 9) were electrophoresed using NuPAGE™ 4-12% Bis-Tris Protein Gel (Product # NP0321BOX). Resolved proteins were then transferred onto a Nitrocellulose membrane (Product # IB23001) by iBlot® 2 Dry Blotting System (Product # IB21001). The Blot was probed with the primary antibody (0.4 µg/mL) and detected by chemiluminescence with Rabbit anti-Goat IgG (H+L) Superclonal™ Recombinant Secondary Antibody, HRP (Product # A27014, 1:4000 dilution) using the iBright FL 1000 (Product # A32752). Chemiluminescent detection was performed using Novex® ECL Chemiluminescent Substrate Reagent Kit (Product # WP20005).
Supportive validation
- Submitted by
- Invitrogen Antibodies (provider)
- Main image
- Experimental details
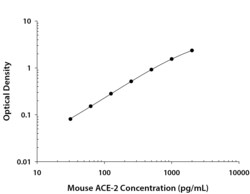
- ELISA of ACE2 in recombinant Mouse ACE-2 protein. Samples were incubated in ACE2 polyclonal antibody (Product # PA5-47488). Protein was serially diluted 2-fold. Antibody was biotinylated and incubated with the protein captured on the plate. Detection of the standard curve was achieved by incubating Streptavidin-HRP followed by Substrate Solution and stopping the enzymatic reaction with Stop Solution.
Supportive validation
- Submitted by
- Invitrogen Antibodies (provider)
- Main image
- Experimental details
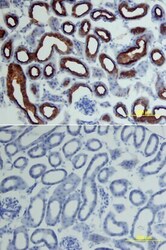
- Immunohistochemical analysis of ACE2 in perfusion fixed frozen sections of mouse kidney. Samples were incubated in ACE2 polyclonal antibody (Product # PA5-47488) using a dilution of 15 µg/mL overnight at 4 °C. Tissue was stained using the Anti-Goat HRP-DAB Cell & Tissue Staining Kit (brown) and counterstained with hematoxylin (blue). Lower panel shows a lack of labeling if primary antibodies are omitted and tissue is stained only with secondary antibody followed by incubation with detection reagents.
- Submitted by
- Invitrogen Antibodies (provider)
- Main image
- Experimental details
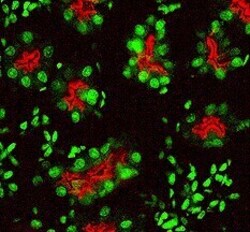
- Immunohistochemical analysis of ACE2 in perfusion fixed frozen sections of mouse kidney. Samples were incubated in ACE2 polyclonal antibody (Product # PA5-47488) using a dilution of 15 µg/mL overnight at 4 °C. Tissue was stained (red) and counterstained (green).
Supportive validation
- Submitted by
- Invitrogen Antibodies (provider)
- Main image
- Experimental details
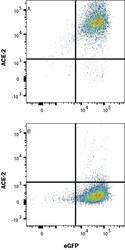
- Flow cytometry of ACE2 in HEK293 human embryonic kidney cell line transfected with (A) mouse ACE-2 or (B) irrelevant protein, and eGFP. Samples were incubated in ACE2 polyclonal antibody (Product # PA5-47488) followed by Allophycocyanin-conjugated Anti-Goat IgG Secondary Antibody. Quadrant markers were set based on Goat IgG control antibody.
Supportive validation
- Submitted by
- Invitrogen Antibodies (provider)
- Main image
- Experimental details
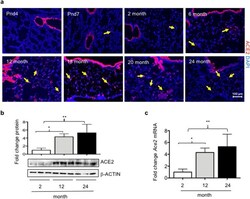
- Figure 1 ACE2 expression changes in lung as mice age. ( a ) Lungs harvested from mice of different ages were stained for ACE2 (red) and counterstained with DAPI (blue). ACE2 was detected in airways of all mice and alveolar regions (yellow arrows). Bar = 100 mm. ( b ) Lungs homogenates prepared from 2-month, 12-month, and 24-month-old mice were immunoblotted for ACE2 and beta-ACTIN as a loading control. Each lane represents an individual mouse. Band intensity of ACE2 to beta-ACTIN was quantified and graphed as fold change relative to 2-month samples. Bars reflect mean +- SD graphed. ( c ) qRT-PCR was used to quantify Ace2 mRNA in total lung homogenates of 2-month and 24-month-old mice. Data is graphed as the fold change of Ace2 after normalizing to 18S RNA from 5 mice per group. Bars reflect mean +- SD graphed as fold change over 2-month values. Statistical significance is comparisons for all pairs using Tukey-Kramer HSD test, with *P
- Submitted by
- Invitrogen Antibodies (provider)
- Main image
- Experimental details
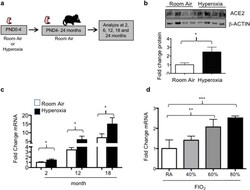
- Figure 3 Neonatal hyperoxia stimulates expression of ACE2 in adult mice. ( a ) Cartoon showing the experimental approach of exposing newborn mice to hyperoxia. ( b ) Total lung homogenates were immunoblotted for ACE2 and beta-ACTIN as a loading control. Data obtained from 5 mice per group is graphed as mean +- SD fold change over room air values. ( c ) qRT-PCR was used to quantify Ace2 mRNA in total lung homogenates of 2-, 12-, and 18-month-old mice exposed to room air or hyperoxia between PND0-4. Values were normalized to expression of 18S RNA and graphed as mean +- SD fold change of ACE2 in 2-month-old room air mice. N = 5 mice per group. ( d ) qRT-PCR was used to quantify Ace2 mRNA in total lung homogenates of 2-month-old mice exposed to room air, 40%, 60%, or 80% oxygen between PND0-4. Values were normalized to expression of 18S RNA and graphed as fold change of ACE2 in 2 month room air mice. N = 5 mice per group. Statistical significance for b-d is comparisons for all pairs using Tukey-Kramer HSD test with *P
- Submitted by
- Invitrogen Antibodies (provider)
- Main image
- Experimental details
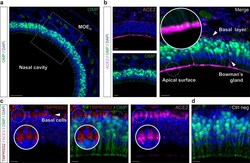
- Fig. 2 Expression profiles of the ACE2 and TMPRSS2 proteins in the MOE D . Immunohistochemical investigations on the MOE D for SARS-CoV-2 entry sites (ACE2, in pink; TMPRSS2, in red). Here, the olfactory marker protein (OMP, in green) allows the precise localization of the mature olfactory neurons. a Large view of OMP+ neurons of the MOE D . Chemosensory cells are in direct contact with the nasal cavity. b Enlarged view of (( a ), dashed rectangle), showing expression of ACE2 in the apical surface, Bowman's gland and basal layer. A zoom in view of the apical surface is shown. c Co-expression profiles of TMPRSS2 and ACE2 in OMP- basal cells (white arrowhead, highlighted with zoom in view). d Control experiment (Ctrl neg) illustrating the absence of fluorescent background expression. Nuclei are counterstained with Dapi (DAPI, in blue). Representative protein expression profiles obtained from heterozygous OMP-GFP mice of 20 ( a , b ) and 6 months old ( c , d ). Scale bars are 50 mum ( a ), 15 mum ( b ), and 10 mum ( c , d ).
- Submitted by
- Invitrogen Antibodies (provider)
- Main image
- Experimental details
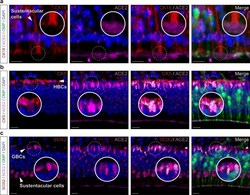
- Fig. 3 Non-neuronal and immature olfactory cell localization of ACE2 in MOE D . Cellular profile of ACE2 expression in the MOE D by immunohistochemistry. a Co-expression of ACE2 (in pink) with apical CK18+ sustentacular cells (CK18, in red). b , c Basal co-expression of ACE2 with CK5 + HBCs (CK5, in red; ( b )) and SOX2 + GBCs (SOX2, in red; ( c )). Nuclei of sustentacular cells ( c ) also expressed SOX2. Colocalization between red and pink signals is highlighted in light gray ( a - c ). Nuclei are counterstained with Dapi (DAPI, in blue). Horizontal basal cells (HBCs, ( b )), globose basal cells (GBCs, ( c )). Representative protein expression profile obtained from heterozygous OMP-GFP mice of 9 ( a , b ) and 7 months old ( c ). Scale bars are 5 mum ( a , b ) and 10 mum ( c ).
- Submitted by
- Invitrogen Antibodies (provider)
- Main image
- Experimental details
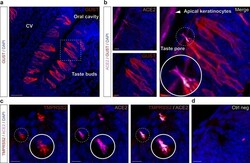
- Fig. 4 Expression profile of the ACE2 and TMPRSS2 proteins in the taste circumvallate papilla. Immunohistochemical investigations on the taste buds for SARS-CoV-2 entry sites in circumvallate papillae. a , b Here, the gustducin marker protein (GUST; in red) allows the localization of the gustatory sensory cells. a Large view of GUST+ sensory cells of the circumvallate papilla (CV). b Enlarged view of (( a ), dashed rectangle), showing expression of ACE2 (in pink) in the apical keratinocytes and in the microvilli of the chemosensory cells forming the taste pores, which are in direct contact with the oral cavity. A zoom in view of the microvilli of a taste pore is shown. c Co-expression profile of TMPRSS2 (in red) and ACE2 in the taste pores (highlighted with a zoom in view). d Control experiment (Ctrl neg) illustrating the absence of fluorescent background expression. Colocalization between red and pink signals is highlighted in light gray ( a - d ). Nuclei are counterstained with Dapi (DAPI, in blue). Representative protein expression profiles were obtained from heterozygous OMP-GFP mice of 6 ( a , b ), 5 ( c ), and 7 months old ( d ). Scale bars are 50 mum ( a ), 10 mum ( b - d ).
- Submitted by
- Invitrogen Antibodies (provider)
- Main image
- Experimental details
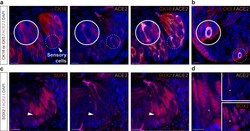
- Fig. 5 Precise protein expression profile of ACE2 in CV taste buds reveals its presence in mature sensory cells. Cellular profile of ACE2 expression in the CV taste buds by immunohistochemistry. a Co-expression of ACE2 (in pink) with CK18+ sensory cells (CK18, in red). Enlarged view (dashed white circle) shows episodic expression of ACE2 in sensory cell soma. b Limited basal co-expression of ACE2 in immature CK5+ cells (CK5, in red). c , d Somatic expression of ACE2 is associated with nuclear expression of SOX2+ (SOX2, in red). d Enlarged view of a nuclear expression of SOX2 (indicated by white asterisks) in a ACE2+ sensory cell (white arrowhead in ( c )). Colocalization between red and pink signals is highlighted in light gray ( a - d ). Nuclei are counterstained with Dapi (DAPI, in blue). Representative protein expression profile obtained from heterozygous OMP-GFP mice of 11 ( a , b ) and 13 months old ( c , d ). Scale bars are 10 mum ( a - c ) and 5 mum ( d ).
- Submitted by
- Invitrogen Antibodies (provider)
- Main image
- Experimental details
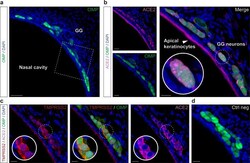
- Fig. 6 Expression profile of ACE2 and TMPRSS2 proteins in the GG. Immunohistochemical investigations on the GG for SARS-CoV-2 entry sites (ACE2, in pink; TMPRSS2, in red). Here, the olfactory marker protein (OMP, in green) allows the precise localization of the mature olfactory neurons. a General view of OMP+ neurons of the GG. Chemosensory cells are separated from the nasal cavity by a keratinocyte layer. b Enlarged view of (( a ), white dashed rectangle), showing expression of ACE2 in the apical keratinocytes and in GG neurons. A zoom in view of GG neurons is shown (white dashed circle). c Co-expression profile of TMPRSS2 and ACE2 in apical keratinocytes and OMP+ cells (zoom in view, white dashed circle). d Control experiment (Ctrl neg) illustrating the absence of fluorescent background expression. Nuclei are counterstained with Dapi (DAPI, in blue). Representative protein expression profile obtained from heterozygous OMP-GFP mice of 9 ( a , b , and d ) and 11 months old ( c ). Scale bars are 50 mum ( a ), 15 mum ( b - d ).
- Submitted by
- Invitrogen Antibodies (provider)
- Main image
- Experimental details
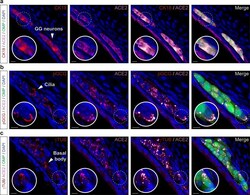
- Fig. 7 Precise protein expression profile of ACE2 in the GG reveals its neuronal type. OMP+ cellular profile of ACE2 expression in the GG by immunohistochemistry. a Co-expression of ACE2 (in pink) with CK18 + GG neurons (CK18, in red). b ACE2 is expressed together with pGCG+ GG primary cilia (pGCG, in red). c Co-expression of ACE2 with gammaTUB+ punctiform staining in GG neurons (gammaTUB, in red) indicating a localization in the basal body of GG primary cilia. Colocalization between red and pink signals is highlighted in light gray ( a - c ). Nuclei are counterstained with Dapi (DAPI, in blue). Representative protein expression profile obtained from heterozygous OMP-GFP mice of 11 ( a ) and 5 months old ( b , c ). Scale bars are 10 mum ( a - c ).
- Submitted by
- Invitrogen Antibodies (provider)
- Main image
- Experimental details
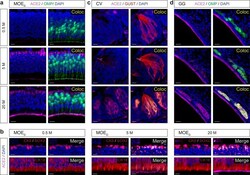
- Fig. 9 Age-dependent ACE2 expression in the MOE D , CV, and GG. Assessment of ACE2 expression (in pink) in chemosensory systems by immunohistochemistry at the indicated age in months (M). a A gradual increase in ACE2 expression is observed in the apical and basal cell layer of the MOE D . b Age-dependent increase of expression of ACE in the MOE D is not associated to an increased number of basal (CK5/SOX2+; upper part of panels) or sustentacular (CK18+; lower part of panels) cells. c In taste buds of the CV, ACE2 is sequentially expressed in the taste pore microvilli and in the sensory somas. d In the GG region, apical keratinocytes constantly express ACE2 while this expression is progressively observed in GG neurons (punctiform to somatic staining). Colocalization (Coloc, in yellow) in sensory cells of ACE2 with OMP ( a , d ) or GUST ( c ) markers are highlighted. Colocalization between red and pink signals is highlighted in light gray ( b ). Nuclei are counterstained with Dapi (DAPI, in blue). Representative protein expression profile obtained from heterozygous OMP-GFP mice of 0.5, 5 and 20 months old are indicated. Scale bars are 10 mum ( a - c ) and 20 mum ( d ).
 Explore
 Validate
 Learn
Learn Western blot
 Immunoprecipitation