 Explore
 Validate
 Learn
Learn Western blot
Antibody data
- Antibody Data
- Antigen structure
- References [1]
- Comments [0]
- Validations
- Western blot [1]
- Immunohistochemistry [1]
- Other assay [1]
Submit
Validation data
Reference
Comment
Report error
- Product number
- PA5-86730 - Provider product page

- Provider
- Invitrogen Antibodies
- Product name
- RGS1 Polyclonal Antibody
- Antibody type
- Polyclonal
- Antigen
- Synthetic peptide
- Reactivity
- Human, Mouse, Rat
- Host
- Rabbit
- Isotype
- IgG
- Vial size
- 100 µL
- Concentration
- 1 mg/mL
- Storage
- Store at 4°C short term. For long term storage, store at -20°C, avoiding freeze/thaw cycles.
Submitted references Single-Cell Transcriptome Analysis Reveals RGS1 as a New Marker and Promoting Factor for T-Cell Exhaustion in Multiple Cancers.
Bai Y, Hu M, Chen Z, Wei J, Du H
Frontiers in immunology 2021;12:767070
Frontiers in immunology 2021;12:767070
No comments: Submit comment
Supportive validation
- Submitted by
- Invitrogen Antibodies (provider)
- Main image
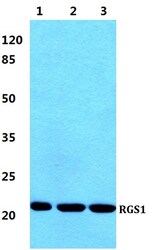
- Experimental details
- Western blot analysis of RGS1 in Lane 1: HeLa cell lysate, Lane 2: Raw264.7 cell lysate, Lane 3: H9C2 cell lysate. Sample was incubated with RGS1 polyclonal antibody (Product # PA5-86730) using a 1:500 dilution.

Supportive validation
- Submitted by
- Invitrogen Antibodies (provider)
- Main image

- Experimental details
- Immunohistochemical analysis of RGS1 in paraffin-embedded human colon carcinoma tissue showing cytoplasmic/nucleus staining and negative control (right). Sample was incubated with polyclonal RGS1 antibody (Product # PA5-86730) using a 1:50 dilution, and followed by goat anti-rabbit IgG-biotin and avidin-peroxidase secondary antibodies.

Supportive validation
- Submitted by
- Invitrogen Antibodies (provider)
- Main image

- Experimental details
- Figure 3 DEGs in Pre_exhasuted and Tex cells compared with Teff cells. (A) The common upregulated genes in Pre_exhasuted and Tex cells compared with Teff cells. (B) The mRNA expression value of RGS1 in single-cell dataset and TCGA database (C) . (D) The Kaplan-Meier overall survival curves of TCGA patients grouped by the middle expression value of RGS1 . The red and blue lines denote higher and lower expression group, respectively. (E) Representative IHC images of RGS1 protein in tumor and normal tissues of liver derived from the HPA database and verification experiment ( F , scale bar 100 um, magnification x20). (G) The protein expression value of RGS1 in hepatocarcinoma and adjacent noncancerous tissues in the IHC verification experiment. **p
