Antibody data
- Antibody Data
- Antigen structure
- References [7]
- Comments [0]
- Validations
- Western blot [2]
- Immunocytochemistry [2]
- Immunohistochemistry [3]
- Flow cytometry [1]
- Other assay [7]
Submit
Validation data
Reference
Comment
Report error
- Product number
- 40-6800 - Provider product page

- Provider
- Invitrogen Antibodies
- Product name
- DISC1 Polyclonal Antibody
- Antibody type
- Polyclonal
- Antigen
- Synthetic peptide
- Reactivity
- Human, Mouse
- Host
- Rabbit
- Isotype
- IgG
- Vial size
- 100 µg
- Concentration
- 0.25 mg/mL
- Storage
- -20°C
Submitted references Knock-Down of Hippocampal DISC1 in Immune-Challenged Mice Impairs the Prefrontal-Hippocampal Coupling and the Cognitive Performance Throughout Development.
Transient Knock-Down of Prefrontal DISC1 in Immune-Challenged Mice Causes Abnormal Long-Range Coupling and Cognitive Dysfunction throughout Development.
NMDA receptors are selectively partitioned into complexes and supercomplexes during synapse maturation.
Synergistic interactions between PDE4B and GSK-3: DISC1 mutant mice.
Genetic and pharmacological evidence for schizophrenia-related Disc1 interaction with GSK-3.
DISC1 regulates primary cilia that display specific dopamine receptors.
The von Economo neurons in frontoinsular and anterior cingulate cortex in great apes and humans.
Xu X, Song L, Hanganu-Opatz IL
Cerebral cortex (New York, N.Y. : 1991) 2021 Jan 5;31(2):1240-1258
Cerebral cortex (New York, N.Y. : 1991) 2021 Jan 5;31(2):1240-1258
Transient Knock-Down of Prefrontal DISC1 in Immune-Challenged Mice Causes Abnormal Long-Range Coupling and Cognitive Dysfunction throughout Development.
Xu X, Chini M, Bitzenhofer SH, Hanganu-Opatz IL
The Journal of neuroscience : the official journal of the Society for Neuroscience 2019 Feb 13;39(7):1222-1235
The Journal of neuroscience : the official journal of the Society for Neuroscience 2019 Feb 13;39(7):1222-1235
NMDA receptors are selectively partitioned into complexes and supercomplexes during synapse maturation.
Frank RA, Komiyama NH, Ryan TJ, Zhu F, O'Dell TJ, Grant SG
Nature communications 2016 Apr 27;7:11264
Nature communications 2016 Apr 27;7:11264
Synergistic interactions between PDE4B and GSK-3: DISC1 mutant mice.
Lipina TV, Wang M, Liu F, Roder JC
Neuropharmacology 2012 Mar;62(3):1252-62
Neuropharmacology 2012 Mar;62(3):1252-62
Genetic and pharmacological evidence for schizophrenia-related Disc1 interaction with GSK-3.
Lipina TV, Kaidanovich-Beilin O, Patel S, Wang M, Clapcote SJ, Liu F, Woodgett JR, Roder JC
Synapse (New York, N.Y.) 2011 Mar;65(3):234-48
Synapse (New York, N.Y.) 2011 Mar;65(3):234-48
DISC1 regulates primary cilia that display specific dopamine receptors.
Marley A, von Zastrow M
PloS one 2010 May 28;5(5):e10902
PloS one 2010 May 28;5(5):e10902
The von Economo neurons in frontoinsular and anterior cingulate cortex in great apes and humans.
Allman JM, Tetreault NA, Hakeem AY, Manaye KF, Semendeferi K, Erwin JM, Park S, Goubert V, Hof PR
Brain structure & function 2010 Jun;214(5-6):495-517
Brain structure & function 2010 Jun;214(5-6):495-517
No comments: Submit comment
Supportive validation
- Submitted by
- Invitrogen Antibodies (provider)
- Main image
- Experimental details
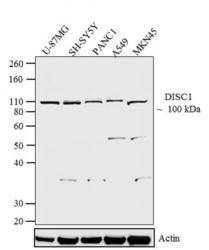
- Western blot analysis was performed on whole cell extracts (20 µg lysate) of U-87 MG (lane 1), SH-SY5Y (lane 2), PANC1 (lane 3), A549 (lane 4) and MKN45 (lane 5). The blots were probed with Anti-DISC1 Rabbit Polyclonal Antibody (Product # 40-6800, 1-3 µg/mL) and detected by chemiluminescence Goat anti-Rabbit IgG (H+L) Superclonal™ Secondary Antibody, HRP conjugate (Product # A27036, 0.4 µg/mL, 1:2500 dilution). A 100 kDa band corresponding to DISC1 was observed across cell lines tested. Known quantity of protein samples were electrophoresed using Novex® NuPAGE® 12 % Bis-Tris gel (Product # NP0342BOX), XCell SureLock™ Electrophoresis System (Product # EI0002) and Novex® Sharp Pre-Stained Protein Standard (Product # LC5800). Resolved proteins were then transferred onto a nitrocellulose membrane with iBlot® 2 Dry Blotting System (Product # IB21001). The membrane was probed with the relevant primary and secondary Antibody following blocking with 5 % skimmed milk. Chemiluminescent detection was performed using Pierce™ ECL Western Blotting Substrate (Product # 32106).
- Submitted by
- Invitrogen Antibodies (provider)
- Main image
- Experimental details
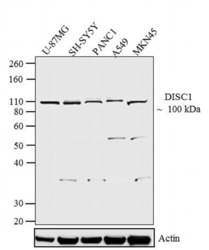
- Western blot analysis was performed on whole cell extracts (20 µg lysate) of U-87 MG (lane 1), SH-SY5Y (lane 2), PANC1 (lane 3), A549 (lane 4) and MKN45 (lane 5). The blots were probed with Anti-DISC1 Rabbit Polyclonal Antibody (Product # 40-6800, 1-3 µg/mL) and detected by chemiluminescence Goat anti-Rabbit IgG (H+L) Superclonal™ Secondary Antibody, HRP conjugate (Product # A27036, 0.4 µg/mL, 1:2500 dilution). A 100 kDa band corresponding to DISC1 was observed across cell lines tested. Known quantity of protein samples were electrophoresed using Novex® NuPAGE® 12 % Bis-Tris gel (Product # NP0342BOX), XCell SureLock™ Electrophoresis System (Product # EI0002) and Novex® Sharp Pre-Stained Protein Standard (Product # LC5800). Resolved proteins were then transferred onto a nitrocellulose membrane with iBlot® 2 Dry Blotting System (Product # IB21001). The membrane was probed with the relevant primary and secondary Antibody following blocking with 5 % skimmed milk. Chemiluminescent detection was performed using Pierce™ ECL Western Blotting Substrate (Product # 32106).
Supportive validation
- Submitted by
- Invitrogen Antibodies (provider)
- Main image
- Experimental details
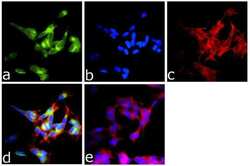
- Immunofluorescence analysis of DISC1 (C-TERM) was done on 70% confluent log phase SH-SY5Y cells. The cells were fixed with 4% paraformaldehyde for 15 minutes, permeabilized with 0.25% Triton™ X-100 for 10 minutes, and blocked with 5% BSA for 1 hour at room temperature. The cells were labeled with DISC1 (C-TERM) Rabbit Polyclonal Antibody (Product # 40-6800) at 1 µg/mL in 1% BSA and incubated for 3 hours at room temperature and then labeled with Goat anti-Rabbit IgG (H+L) Superclonal™ Secondary Antibody, Alexa Fluor® 488 conjugate (Product # A27034) at a dilution of 1:2000 for 45 minutes at room temperature (Panel a: green). Nuclei (Panel b: blue) were stained with SlowFade® Gold Antifade Mountant with DAPI (Product # S36938). F-actin (Panel c: red) was stained with Alexa Fluor® 555 Rhodamine Phalloidin (Product # R415, 1:300). Panel d is a merged image showing Cytoplasmic localization. Panel e is a no primary antibody control. The images were captured at 60X magnification.
- Submitted by
- Invitrogen Antibodies (provider)
- Main image
- Experimental details
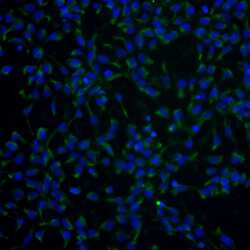
- Immunofluorescent analysis of DISC1 in human iPSC-derived neural stem cells cultured for 10 days in PSC Neural Induction Medium (Product # A16447801). At day 10 the cells were fixed with 4% paraformaldehyde for 15 min, permeabilized with 0.1% triton x-100 for 30 min, and blocked with 1% BSA for 30 min at room temperature. Cells were stained with anti-DISC1 (Product # 40-6800, green) at a dilution of (1:500) in 1% BSA staining buffer, overnight at 4C, and then incubated with Alexa Fluor secondary antibodies 488 donkey anti-rabbit (Product # R37118) at a dilution of 1:2000 for 60 min. at room temp. Images were taken on a Thermo Scientific CX5 CellInsight Instrument at 20X magnification.
Supportive validation
- Submitted by
- Invitrogen Antibodies (provider)
- Main image
- Experimental details
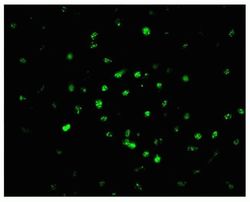
- Immunofluorescent punctate labelling of neuronal nuclei in mouse cerebral cortex using our Rabbit anti DISC1 (C-term) Polyclonal Antibody (C-term) (Product # 40-6800). Image courtesy of James I. Nagy, PhD, University of Manitoba, Canada.
- Submitted by
- Invitrogen Antibodies (provider)
- Main image
- Experimental details
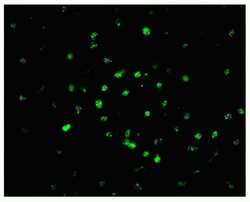
- Immunofluorescent punctate labelling of neuronal nuclei in mouse cerebral cortex using our Rabbit anti DISC1 (C-term) Polyclonal Antibody (C-term) (Product # 40-6800). Image courtesy of James I. Nagy, PhD, University of Manitoba, Canada.
- Submitted by
- Invitrogen Antibodies (provider)
- Main image
- Experimental details
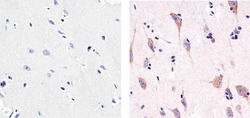
- Immunohistochemistry analysis of DISC1 (C-TERM) showing staining in the cytoplasm of paraffin-embedded human brain tissue (right) compared to a negative control without primary antibody (left). To expose target proteins, antigen retrieval was performed using 10 mM sodium citrate (pH 6.0), microwaved for 8-15 min. Following antigen retrieval, tissues were blocked in 3% H2O2-methanol for 15 min at room temperature, washed with ddH2O and PBS, and then probed with a DISC1 (C-TERM) Rabbit Polyclonal antibody (Product # 40-6800) diluted in 3% BSA-PBS at a dilution of 1:100 overnight at 4°C in a humidified chamber. Tissues were washed extensively in PBST and detection was performed using an HRP-conjugated secondary antibody followed by colorimetric detection using a DAB kit. Tissues were counterstained with hematoxylin and dehydrated with ethanol and xylene to prep for mounting.
Supportive validation
- Submitted by
- Invitrogen Antibodies (provider)
- Main image
- Experimental details
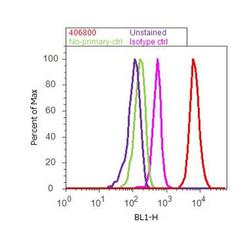
- Flow cytometry analysis of DISC1 was done on SH-SY5Y cells. Cells were fixed with 70% ethanol for 10 minutes, permeabilized with 0.25% Triton™ X-100 for 20 minutes, and blocked with 5% BSA for 30 minutes at room temperature. Cells were labeled with DISC1 Rabbit Polyclonal Antibody (406800, red histogram) or with rabbit isotype control (pink histogram) at 3-5 ug/million cells in 2.5% BSA. After incubation at room temperature for 2 hours, the cells were labeled with Alexa Fluor® 488 Goat Anti-Rabbit Secondary Antibody (A11008) at a dilution of 1:400 for 30 minutes at room temperature. The representative 10,000 cells were acquired and analyzed for each sample using an Attune® Acoustic Focusing Cytometer. The purple histogram represents unstained control cells and the green histogram represents no-primary-antibody control.
Supportive validation
- Submitted by
- Invitrogen Antibodies (provider)
- Main image
- Experimental details
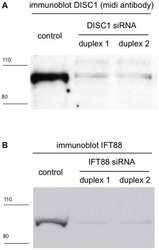
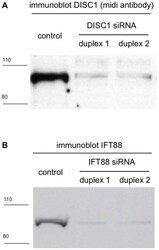
- Figure 2 Depletion of endogenous DISC1 and IFT88 by RNA interference. NIH3T3 cells were transfected with the indicated siRNA duplexes (sequences are listed in Materials and Method s ). Total cell extracts were prepared 72 hours later, and levels of DISC1 ( A ) or IFT88 ( B ) protein were assessed by immunoblot using antibodies recognizing the endogenous proteins. Representative immunoblots are shown. Densitometric scanning across multiple experiments verified >80% depletion of both proteins by the respective siRNA duplexes.
- Submitted by
- Invitrogen Antibodies (provider)
- Main image
- Experimental details
- NULL
- Submitted by
- Invitrogen Antibodies (provider)
- Main image
- Experimental details
- NULL
- Submitted by
- Invitrogen Antibodies (provider)
- Main image
- Experimental details
- NULL
- Submitted by
- Invitrogen Antibodies (provider)
- Main image
- Experimental details
- NULL
- Submitted by
- Invitrogen Antibodies (provider)
- Main image
- Experimental details
- Figure 2 Depletion of endogenous DISC1 and IFT88 by RNA interference. NIH3T3 cells were transfected with the indicated siRNA duplexes (sequences are listed in Materials and Method s ). Total cell extracts were prepared 72 hours later, and levels of DISC1 ( A ) or IFT88 ( B ) protein were assessed by immunoblot using antibodies recognizing the endogenous proteins. Representative immunoblots are shown. Densitometric scanning across multiple experiments verified >80% depletion of both proteins by the respective siRNA duplexes.
- Submitted by
- Invitrogen Antibodies (provider)
- Main image
- Experimental details
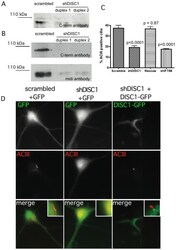
- Figure 7 DISC1 knockdown and rescue in striatal neurons. ( A ) Example immunoblot showing depletion of endogenous DISC1 detected in PC12 cells using the C-terminal antibody (see Materials and Methods ). The immunoreactive band corresponding to the major full length DISC1 species is shown. ( B ) Example of DISC1 depletion in striatal cultures, detected using the C-terminal (C-term) antibody and verified using the midi antibody, as indicated. ( C ) Quantification of knockdown and rescue phenotypes, based on count of cilia number compiled from 8 independent experiments. ( D ) Examples of the phenotypes observed in the indicated conditions (indicated above each column). The rescue condition (right column of images) shows the localization of DISC1-GFP rather than GFP. Insets indicate relevant regions of the cell body at higher magnification.
 Explore
 Validate
 Learn
Learn Western blot