 Explore
 Validate
 Learn
Learn Western blot
 Immunoprecipitation
Antibody data
- Antibody Data
- Antigen structure
- References [0]
- Comments [0]
- Validations
- Western blot [1]
- Immunohistochemistry [1]
- Other assay [10]
Submit
Validation data
Reference
Comment
Report error
- Product number
- MA3-916 - Provider product page

- Provider
- Invitrogen Antibodies
- Product name
- Ryanodine Receptor Monoclonal Antibody (C3-33)
- Antibody type
- Monoclonal
- Antigen
- Other
- Description
- MA3-916 detects ryanodine receptor 2 (RyR2) and shows cross-reactivity with RyR1 in amphibian, canine, chicken, fish, guinea pig and rat tissues. MA3-916 has been successfully used in Western blot, immunohistochemical, immunofluorescence, immunocytochemistry and immunoprecipitation procedures. By Western blot, this antibody detects a 565 kDa protein representing the ryanodine receptor. In non-mammalian vertebrates, a doublet is seen at 565 kDa representing the alpha and beta isoforms of the receptor. Immunohistochemical staining of RyR in rat cardiac tissue with MA3-916 results in intense staining of the myofiber, which is consistent with sarcoplasmic reticulum localization.
- Reactivity
- Human, Mouse, Rat, Canine, Chicken/Avian, Guinea Pig, Rabbit
- Host
- Mouse
- Isotype
- IgG
- Antibody clone number
- C3-33
- Vial size
- 100 µg
- Concentration
- 1 mg/mL
- Storage
- -20° C, Avoid Freeze/Thaw Cycles
No comments: Submit comment
Supportive validation
- Submitted by
- Invitrogen Antibodies (provider)
- Main image
- Experimental details
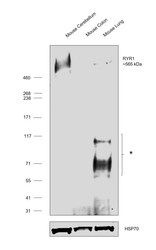
- Western blot was performed using Anti-Ryanodine Receptor Monoclonal Antibody (C3-33) (Product # MA3-916) and a 565 kDa band corresponding to Ryanodine receptor 1 was observed along with two uncharacterized band (*) at ~70 kDa and 100 kDa across tissues tested. Tissue extracts (30 µg lysate) of Mouse Cerebellum (Lane 1), Mouse Colon (Lane 2) and Mouse Lung (Lane 3) were electrophoresed using NuPAGE™ 3-8% Tris-Acetate Protein Gel (Product # EA0378BOX). Resolved proteins were then transferred onto a Nitrocellulose membrane (Product # LC2001) by iBlot® 2 Dry Blotting System (Product # IB21001). The blot was probed with the primary antibody (1 µg/mL) and detected by chemiluminescence with Goat anti-Mouse IgG (H+L) Superclonal™ Recombinant Secondary Antibody, HRP (Product # A28177, 1:4000 dilution) using the iBright FL 1000 (Product # A32752). Chemiluminescent detection was performed using SuperSignal™ West Dura Extended Duration Substrate (Product # 34076).

Supportive validation
- Submitted by
- Invitrogen Antibodies (provider)
- Main image

- Experimental details
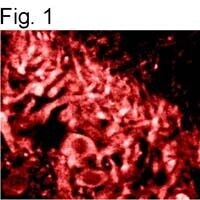
- Immunofluorescent analysis of rat brain hippocampus tissue shows that Ryanodine Receptor Monoclonal Antibody (Product # MA3-916) crossreacts with RyR1.
Supportive validation
- Submitted by
- Invitrogen Antibodies (provider)
- Main image

- Experimental details
- NULL
- Submitted by
- Invitrogen Antibodies (provider)
- Main image

- Experimental details
- NULL

- Submitted by
- Invitrogen Antibodies (provider)
- Main image

- Experimental details
- NULL

- Submitted by
- Invitrogen Antibodies (provider)
- Main image

- Experimental details
- NULL
- Submitted by
- Invitrogen Antibodies (provider)
- Main image

- Experimental details
- Figure 2--figure supplement 2. Analysis of RNA and protein expression levels of the major cardiac Ca 2+ -handling proteins in PLN/DWORF Tg mice. ( A ) RNA levels of the indicated genes as quantified by qRT-PCR in 16-week-old heart tissue. Atp2a2 , SERCA2a; Ryr2 , ryanodine receptor 2; Cacna1c, alpha1C-subunit of the L-type Ca 2+ channel; Casq2 , calsequestrin 2. Data are normalized to 18S and presented as expression level relative to WT, mean +-SD for n = 10 mice per genotype. ( B ) Representative immunoblots of cardiac homogenates from mice with the indicated genotypes. PS16, phospho-serine 16 on PLN; PT17, phospho-threonine 17 on PLN; tPLN, total phospholamban; RyR2, ryanodine receptor 2; LTCC, L-type Ca 2+ channel (alpha1C-subunit); Casq2, calsequestrin 2; GAPDH, glyceraldehyde 3-phosphate dehydrogenase. ( C ) Western blots for n = 9-10 mice of each genotype were quantified using ImageJ and data are normalized to GAPDH and expressed as mean +-SD relative to WT. ( D ) Quantification of total phospholamban and its phosphorylation status as assessed by western blot ( B ) and expressed as relative to WT. Western blots were quantified with ImageJ software. Phosphorylation blots (PS16 and PT17) were normalized to total PLN (tPLN). Total PLN was normalized to GAPDH. Data are expressed as mean +-SD for n = 9-10 mice per genotype. Statistical comparisons between groups were evaluated by Student's t-test. p-value *p

- Submitted by
- Invitrogen Antibodies (provider)
- Main image

- Experimental details
- Figure 6--figure supplement 1. Expression and post-translational modifications of Ca 2+ -handling proteins. ( A ) Immunoblots of cardiac homogenates from mice with the indicated genotypes. ( B ) Immunoblots were quantified using ImageJ and normalized to GAPDH. LTCC, L-type Ca 2+ channel (alpha1C-subunit); Casq2, calsequestrin 2; RyR2, ryanodine receptor 2; GAPDH, glyceraldehyde 3-phosphate dehydrogenase. ( C ) Quantification of the phosphorylation status and oligomerization of phospholamban as assessed by western blot (panel A ) and expressed as relative to WT. Western blots were quantified with ImageJ software. Phosphorylation blots (PS16 and PT17) were normalized to total PLN (tPLN). Total PLN was normalized to GAPDH. tPLN, total phospholamban; PS16, phospho-serine 16 on PLN; PT17, phospho-threonine 17 on PLN. Data are expressed as mean +-SD for n = 4-6 mice per genotype. ( D ) RNA levels of the indicated genes as quantified by qRT-PCR in 8-week-old heart tissue. Atp2a2 , SERCA2a; Cacna1c, alpha1C-subunit of the L-type Ca 2+ channel; Casq2 , calsequestrin 2; Pln , phosholamban; Ryr2 , ryanodine receptor 2. Data are normalized to 18S values and presented as expression level relative to WT, mean +-SD for n = 4-5 mice per genotype.

- Submitted by
- Invitrogen Antibodies (provider)
- Main image

- Experimental details
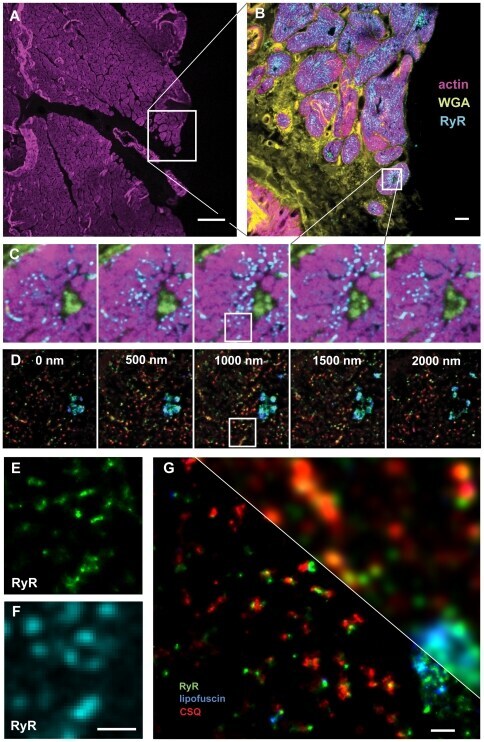
- Figure 3 Correlative confocal and super-resolution imaging of a human cardiac tissue section. The section was ~10 um thick and was labeled with phalloidin for f-Actin (Alexa 488), WGA for the cell membrane and extracellular matrix (Alexa 594), along with antibodies for the ryanodine receptor (RyR, Alexa 680) and calsequestrin (CSQ, Alexa 750). In addition to the applied labelling, a strong endogenous fluorescence signal from lipofuscin was recorded. The shorter wavelength labels (Actin, WGA, and RyR) were imaged on a confocal microscope, and the sample then taken to the localisation microscope where super-resolution imaging of the longer wavelength labels (RyR, lipofuscin, CSQ) was performed. Panel A shows an overview of the cellular structure across a large tissue area that is indicated by the actin labeling (largely muscle cell contractile protein). Scale bar 100 um. Panel B is a projection of a confocal stack taken of the region indicated in A. Scale bar 10 um. Panel C shows a confocal stack of a small detail area from B and panel D shows an optically sectioned super-resolution stack, within the region covered by the confocal stack in C. Panels E & F compare corresponding confocal (F) and super-resolution (E) images both using the RyR-Alexa 647 signal. Note the good correlation between the data and the improvement in resolution in E. Scale bar 1 um. G : 3-colour super-resolution image of a small area in the tissue sample, note the improved resolution as compared to the con
- Submitted by
- Invitrogen Antibodies (provider)
- Main image
- Experimental details
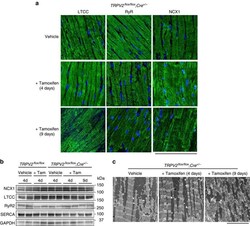
- Figure 7 Expression of Ca 2+ handling protein by isolated cardiomyocytes and electron micrographs of myofibrils in TRPV2-deficient hearts. ( a ) Time-dependent changes in the localization of the Ca 2+ regulatory proteins LTCC, RyR and NCX1 in tamoxifen-treated TRPV2 flox/flox ;Cre +/ - mice. Double staining with anti-LTCC antibody (green) and DAPI (blue) in cardiac muscle (left panels). Double staining with anti-RyR antibody (green) and DAPI (blue) in cardiac muscle (middle panels). Double staining with anti-NCX1 antibody (green) and DAPI (blue) in cardiomyocytes (right panels). Scale bar, 100 mum. ( b ) Expression of NCX1, LTCC, RyR and SERCA proteins in TRPV2-deficient heart extracts (10 mug per lane), using GAPDH as the internal control in cardiac muscle, (see full blots in Supplementary Fig. 6 ). ( c ) Electron micrographs of myofibrils in cardiomyocytes from TRPV2 flox/flox ;Cre +/ - mice, untreated or treated with tamoxifen. Scale bar, 5 mum.

- Submitted by
- Invitrogen Antibodies (provider)
- Main image
- Experimental details
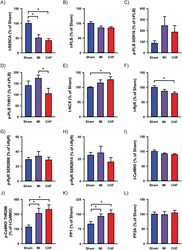
- Fig 6 Immunoblotting. Immunoblot analysis of key Ca 2+ handling proteins and phosphorylation was performed on tissue from left ventricles. SERCA2A abundance (A). PLB abundance (B) and phosphorylation on SER16 (C) and THR17 (D). NCX abundance (E). RyR abundance (F) with phosphorylation on SER2808 (G) and SER2814 (H). CaMKII abundance (I) and CaMKII phosphorylation on THR286 (J). PP1 (K) and PP2A (L) abundance. n heart = 6 for all analysis. *p

- Submitted by
- Invitrogen Antibodies (provider)
- Main image

- Experimental details
- Figure 3 Notch Inhibition Cooperates with AKT1 to Enhance Cardiac Reprogramming alphaMHC-GFP MEFs (or GCaMP MEFs in C) were infected with GHMT or AGHMT, and treated with DMSO (vehicle) or DAPT. (A) Representative immunostaining images of GFP, alpha-actinin, and cTnT at day 15 of reprogramming. Scale bar, 200 mum. (B) Quantification of cells positive for alpha-actinin and cTnT as determined by immunostaining; n = 3 biological replicates. (C) Quantification of Ca 2+ flux-positive cells in GCaMP MEFs at day 15; n = 3 biological replicates. (D) Percentage of beating cells, relative to the number of input cells; n = 3 biological replicates. (E) Immunoblot against the Ca 2+ handling proteins ryanodine receptor (RyR) and SERCA2 at day 15 of reprogramming. Densitometric quantification is shown as the average of every replicate, relative to GAPDH. Data are presented as mean +- SD. * p < 0.05, ** p < 0.01, *** p < 0.001.
