Explore
 Validate
 Learn
Learn Western blot
 ELISA
ELISAAntibody data
- Antibody Data
- Antigen structure
- References [4]
- Comments [0]
- Validations
- ELISA [2]
- Immunocytochemistry [3]
- Immunohistochemistry [2]
- Other assay [6]
Submit
Validation data
Reference
Comment
Report error
- Product number
- PA5-27343 - Provider product page

- Provider
- Invitrogen Antibodies
- Product name
- MIF Polyclonal Antibody
- Antibody type
- Polyclonal
- Antigen
- Recombinant full-length protein
- Description
- Recommended positive controls: Molt-4, mouse brain. Predicted reactivity: Mouse (89%), Rat (90%), Pig (94%), Sheep (91%), Rhesus Monkey (100%), Bovine (91%). Store product as a concentrated solution. Centrifuge briefly prior to opening the vial.
- Reactivity
- Human, Mouse, Rat
- Host
- Rabbit
- Isotype
- IgG
- Vial size
- 100 μL
- Concentration
- 0.1 mg/mL
- Storage
- Store at 4°C short term. For long term storage, store at -20°C, avoiding freeze/thaw cycles.
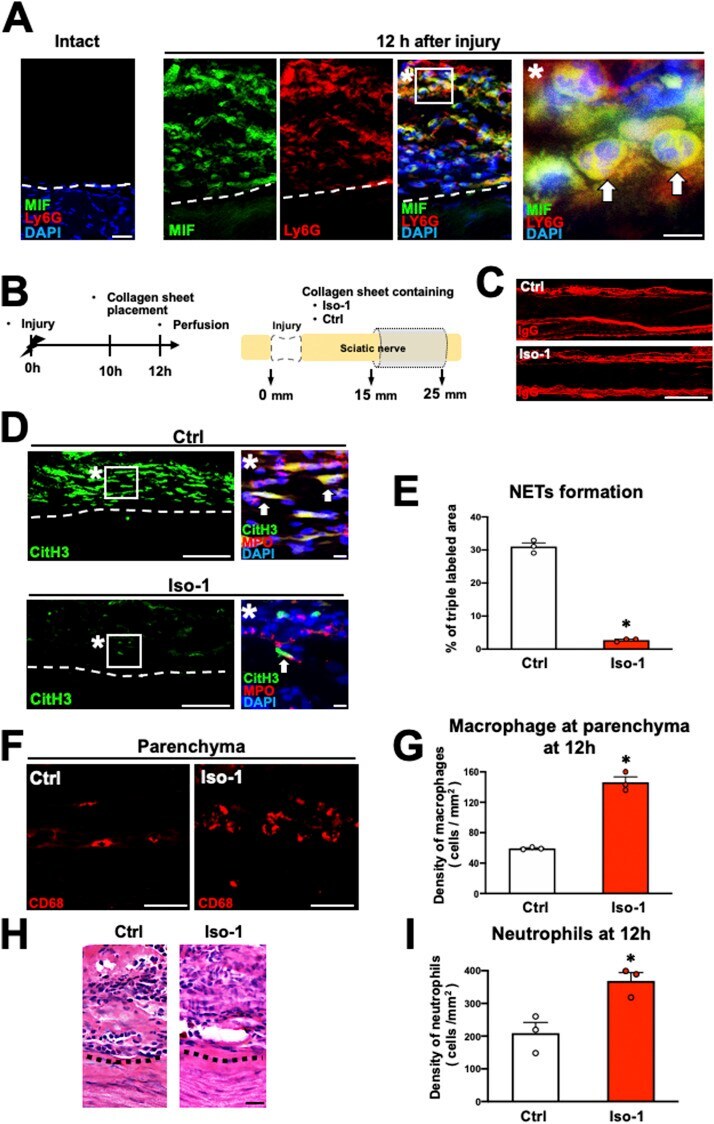
Submitted references Neutrophils delay repair process in Wallerian degeneration by releasing NETs outside the parenchyma.
Macrophage Migration Inhibitory Factor (MIF) and Its Homologue d-Dopachrome Tautomerase (DDT) Inversely Correlate with Inflammation in Discoid Lupus Erythematosus.
CD74 Signaling Links Inflammation to Intestinal Epithelial Cell Regeneration and Promotes Mucosal Healing.
Defense and protection mechanisms in lung exposed to asbestiform fiber: the role of macrophage migration inhibitory factor and heme oxygenase-1.
Yamamoto Y, Kadoya K, Terkawi MA, Endo T, Konno K, Watanabe M, Ichihara S, Hara A, Kaneko K, Iwasaki N, Ishijima M
Life science alliance 2022 Oct;5(10)
Life science alliance 2022 Oct;5(10)
Macrophage Migration Inhibitory Factor (MIF) and Its Homologue d-Dopachrome Tautomerase (DDT) Inversely Correlate with Inflammation in Discoid Lupus Erythematosus.
Caltabiano R, De Pasquale R, Piombino E, Campo G, Nicoletti F, Cavalli E, Mangano K, Fagone P
Molecules (Basel, Switzerland) 2021 Jan 1;26(1)
Molecules (Basel, Switzerland) 2021 Jan 1;26(1)
CD74 Signaling Links Inflammation to Intestinal Epithelial Cell Regeneration and Promotes Mucosal Healing.
Farr L, Ghosh S, Jiang N, Watanabe K, Parlak M, Bucala R, Moonah S
Cellular and molecular gastroenterology and hepatology 2020;10(1):101-112
Cellular and molecular gastroenterology and hepatology 2020;10(1):101-112
Defense and protection mechanisms in lung exposed to asbestiform fiber: the role of macrophage migration inhibitory factor and heme oxygenase-1.
Loreto C, Caltabiano R, Graziano ACE, Castorina S, Lombardo C, Filetti V, Vitale E, Rapisarda G, Cardile V, Ledda C, Rapisarda V
European journal of histochemistry : EJH 2020 Apr 16;64(2)
European journal of histochemistry : EJH 2020 Apr 16;64(2)
No comments: Submit comment
Supportive validation
- Submitted by
- Invitrogen Antibodies (provider)
- Main image

- Experimental details
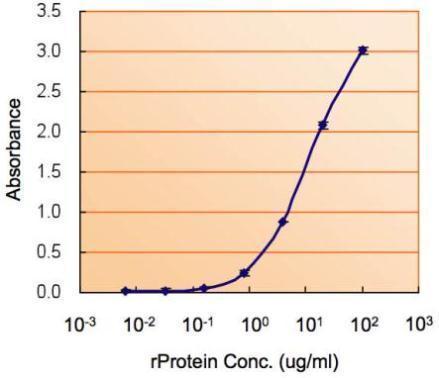
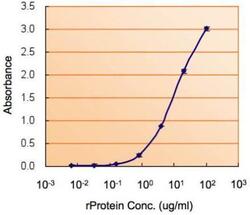
- ELISA detection of MIF using MIF Polyclonal Antibody (Product # PA5-27343) for capture at a concentration of 5 µg/mL and a MIF Polyclonal Antibody for detection at a concentration of 1.5 µg/mL.
- Submitted by
- Invitrogen Antibodies (provider)
- Main image
- Experimental details
- ELISA detection of MIF using MIF Polyclonal Antibody (Product # PA5-27343) for capture at a concentration of 5 µg/mL and a MIF Polyclonal Antibody for detection at a concentration of 1.5 µg/mL.

Supportive validation
- Submitted by
- Invitrogen Antibodies (provider)
- Main image

- Experimental details
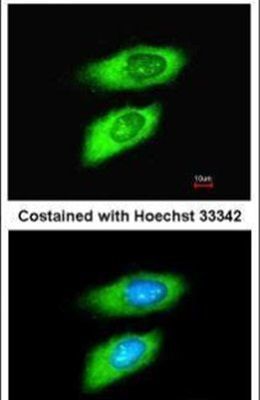
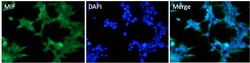
- Immunofluorescent analysis of MIF in methanol-fixed HeLa cells using a MIF polyclonal antibody (Product # PA5-27343) at a 1:200 dilution.
- Submitted by
- Invitrogen Antibodies (provider)
- Main image
- Experimental details
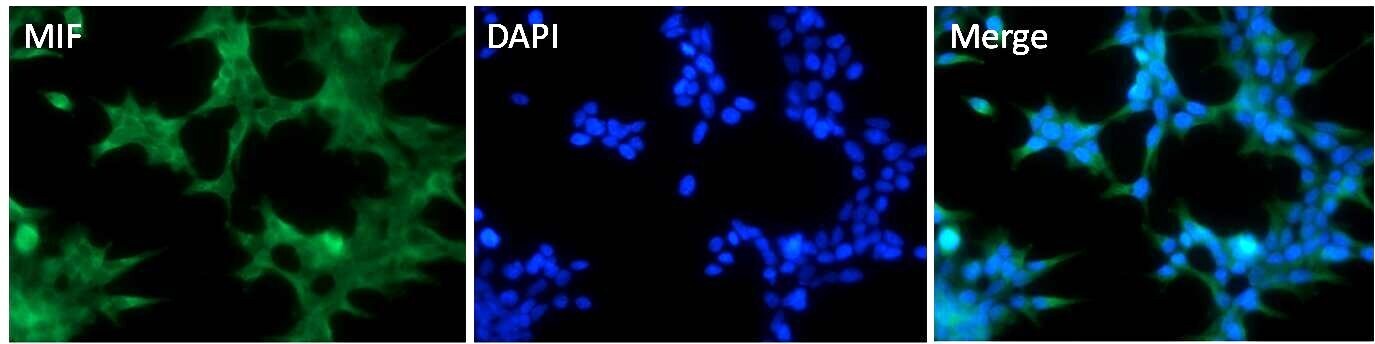
- Immunofluorescent analysis of 14-3-3 zeta (green) HEK293T cells. Cells fixed with 4% formaldehyde fixed were permeabilized and blocked with 1X PBS containing 5% BSA and 0.3% Triton X-100 for 1 hour at room temperature. Cells were probed with a 14-3-3 zeta ppolyclonal antibody (Product # PA5-27317) at a dilution of 1:100 overnight at 4°C in 1X PBS containing 1% BSA and 0.3% Triton X-100, washed with 1X PBS, and incubated with fluorophore-conjugated goat anti-rabbit IgG secondary antibody at a dilution of 1:200 for 1 hour at room temperature. Nuclei (blue) were stained with DAPI. Images were taken on a Leica DM1000 microscope at 40X magnification. Data courtesy of the Innovators Program.
- Submitted by
- Invitrogen Antibodies (provider)
- Main image

- Experimental details
- Immunofluorescent analysis of 14-3-3 zeta (green) HEK293T cells. Cells fixed with 4% formaldehyde fixed were permeabilized and blocked with 1X PBS containing 5% BSA and 0.3% Triton X-100 for 1 hour at room temperature. Cells were probed with a 14-3-3 zeta ppolyclonal antibody (Product # PA5-27317) at a dilution of 1:100 overnight at 4°C in 1X PBS containing 1% BSA and 0.3% Triton X-100, washed with 1X PBS, and incubated with fluorophore-conjugated goat anti-rabbit IgG secondary antibody at a dilution of 1:200 for 1 hour at room temperature. Nuclei (blue) were stained with DAPI. Images were taken on a Leica DM1000 microscope at 40X magnification. Data courtesy of the Innovators Program.

Supportive validation
- Submitted by
- Invitrogen Antibodies (provider)
- Main image
- Experimental details
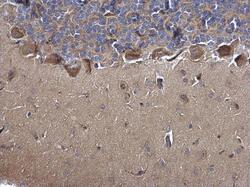
- Immunohistochemistry (Paraffin) analysis of MIF was performed in paraffin-embedded rat brain tissue using MIF Polyclonal Antibody (Product # PA5-27343) at a dilution of 1:500.

- Submitted by
- Invitrogen Antibodies (provider)
- Main image
- Experimental details
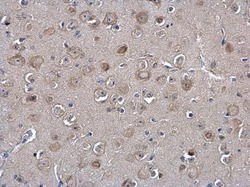
- Immunohistochemistry (Paraffin) analysis of MIF was performed in paraffin-embedded mouse brain tissue using MIF Polyclonal Antibody (Product # PA5-27343) at a dilution of 1:500.

Supportive validation
- Submitted by
- Invitrogen Antibodies (provider)
- Main image
- Experimental details
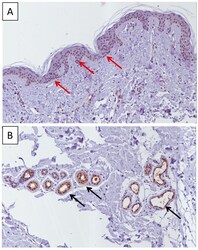
- Figure 1 Immunohistochemistry analysis of MIF expression in normal skin biopsies. High levels of MIF can be detected at the basal layer of the epidermis (red arrow) ( A ) and in the cutaneous appendages (eccrine glands and sebocytes) (black arrow) ( B ). Immunohistochemistry-positive staining was defined as the presence of brown chromogen detection within the cytoplasm. Representative microphotographs are shown.

- Submitted by
- Invitrogen Antibodies (provider)
- Main image
- Experimental details
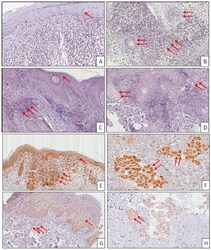
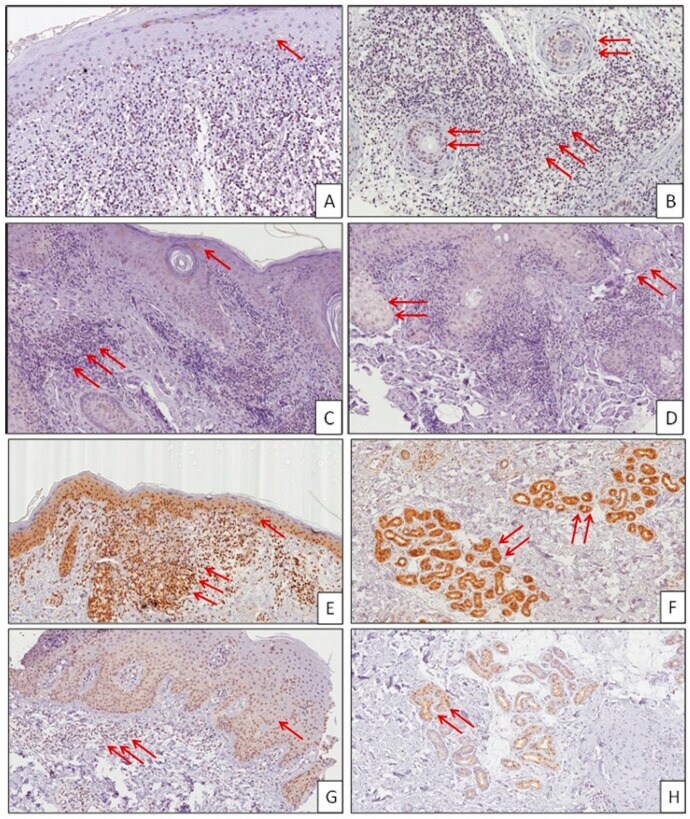
- Figure 2 Immunohistochemistry analysis of MIF expression in DLE skin biopsies. Thirty-seven patients with DLE were recruited for this study. Biopsies were performed after a six-month wash-out period from topical treatments. Hematoxylin and eosin staining was used for histopathological evaluation. Representative microphotographs are shown. ( A - D ) In the presence of a high inflammatory score (2+; 3+), MIF low expression (0; 1+) was observed in the epidermis (one arrow), appendages (two arrows), and inflammatory infiltrate (three arrows). (( A , B ): patient no. 1; ( C , D ): patient no. 2). ( E - H ) In the presence of a low inflammatory score (0; 1+), MIF high expression (2+; 3+) was observed in the epidermis (one arrow), appendages (two arrows), and inflammatory infiltrate (three arrows). Immunohistochemistry positive staining was defined as the presence of brown chromogen detection within the cytoplasm. ( E , F ): patient no. 3; ( G , H ): patient no. 4).
- Submitted by
- Invitrogen Antibodies (provider)
- Main image
- Experimental details
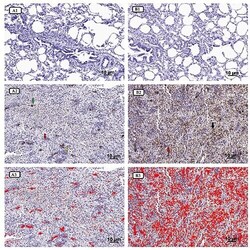
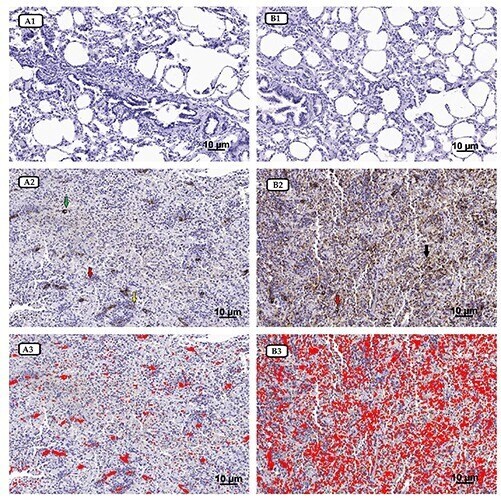
- Figure 1. A1) MIF IHC section of non-exposed sheep (magnification 200x). A2) MIF IHC section of exposed sheep; the fibrotic interstitium showed a strong scattered immunoreaction; green arrow indicates the intra-parenchymal stroma around a bronchiolar structure, yellow arrow shows MIF macrophages immunodetection while red arrow indicates FE deposit fibers (magnification 200x). A3) MIF immunostaining software image analysis of panel A2, in which mainly a high immunostained area (red color) was detected (magnification 200x). B1) HO-1 IHC section of non-exposed sheep (magnification 200x). B2) HO-1 IHC section of exposed sheep; in the lung fibrotic tissue, a strong and widespread immunostaining was demonstrated throughout the interstitium (black arrow) and bronchiolar structures (red arrow) (magnification 200x). B3) HO-1 immunostaining software image analysis of panel B2, in which mainly a high immunostained area (red color) was detected (magnification 200x).
- Submitted by
- Invitrogen Antibodies (provider)
- Main image

- Experimental details
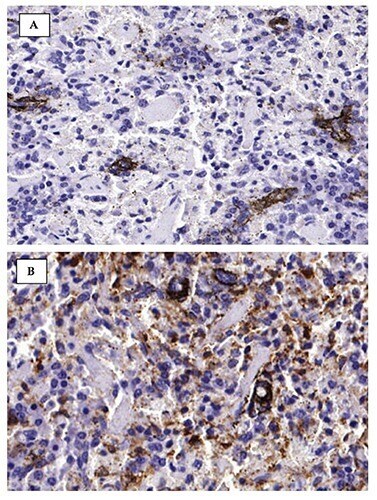
- Figure 2. A) Higher magnification of MIF immunohistochemical expression in exposed sheep section (magnification 400x). B) Higher magnification of HO-1 immunohistochemical expression in exposed sheep section (magnification 400x).
- Submitted by
- Invitrogen Antibodies (provider)
- Main image
- Experimental details
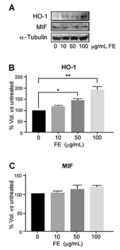
- Figure 4. HO-1 and MIF protein levels in human primary lung fibroblasts unexposed or FE-exposed for 72 h. Representative immunoblotting of HO-1 and MIF expressions (A). Results of three independent immunoblots are represented as percentage of HO-1 (B) and MIF (C) proteins with respect to untreated cells (*P

- Submitted by
- Invitrogen Antibodies (provider)
- Main image

- Experimental details
- Figure 8. Migration inhibitory factor (MIF) secreted from neutrophils promotes NET formation in rats. (A) Representative images of triple immunolabeling of longitudinal sections with MIF, Ly6G, and DAPI. Left is intact nerve, and other images were acquired at 20 mm distal to the injury site 12 h after injury. Dashed lines indicate the border between the epineurium and the parenchyma. The images marked with * is a high-magnification image of the boxed area. Arrows indicate neutrophils expressing MIF. Neutrophils at the epineurium expressed MIF. Scale bars: 10 mum in * images and 20 mum in all other images. (B) Schematic illustration of an experimental method to inhibit MIF at the epineurium in Wallerian degeneration. The nerve of the region of Wallerian degeneration was wrapped with collagen sheets containing iso-1 or control. (C) Representative images of IgG immunolabeling at 20 mm distal to the injury site. No IgG immunoreactivity was detected at the parenchyma in either group. Scale bar: 500 mum. (D) Representative images of immunolabeling with CitH3, MPO, and DAPI at 20 mm distal to the injury site 12 h after injury. Dashed lines indicate the border of the epineurium and the parenchyma. Images marked with * are high-magnification images of boxed areas in the epineurium. Arrows indicate triple immunolabeled NETs. Treatment with iso-1 dramatically inhibited NET formation. Scale bar: 10 mum. (E) Quantification of the NET formation detected by triple labeling with the CitH3, M