Explore
 Validate
 Learn
Learn Immunohistochemistry
Antibody data
- Antibody Data
- Antigen structure
- References [1]
- Comments [0]
- Validations
- Immunohistochemistry [1]
- Other assay [2]
Submit
Validation data
Reference
Comment
Report error
- Product number
- PA5-75314 - Provider product page

- Provider
- Invitrogen Antibodies
- Product name
- SALF Polyclonal Antibody
- Antibody type
- Polyclonal
- Antigen
- Synthetic peptide
- Description
- The antibody was affinity-purified from rabbit antiserum by affinity-chromatography using epitope-specific immunogen and the purity is > 95% (by SDS-PAGE).
- Reactivity
- Human, Mouse, Rat
- Host
- Rabbit
- Isotype
- IgG
- Vial size
- 100 µL
- Concentration
- 1 mg/mL
- Storage
- Store at 4°C short term. For long term storage, store at -20°C, avoiding freeze/thaw cycles.
Submitted references Three-Dimensional Genome Interactions Identify Potential Adipocyte Metabolism-Associated Gene STON1 and Immune-Correlated Gene FSHR at the rs13405728 Locus in Polycystic Ovary Syndrome.
Cao CH, Wei Y, Liu R, Lin XR, Luo JQ, Zhang QJ, Lin SR, Geng L, Ye SK, Shi Y, Xia X
Frontiers in endocrinology 2021;12:686054
Frontiers in endocrinology 2021;12:686054
No comments: Submit comment
Supportive validation
- Submitted by
- Invitrogen Antibodies (provider)
- Main image

- Experimental details
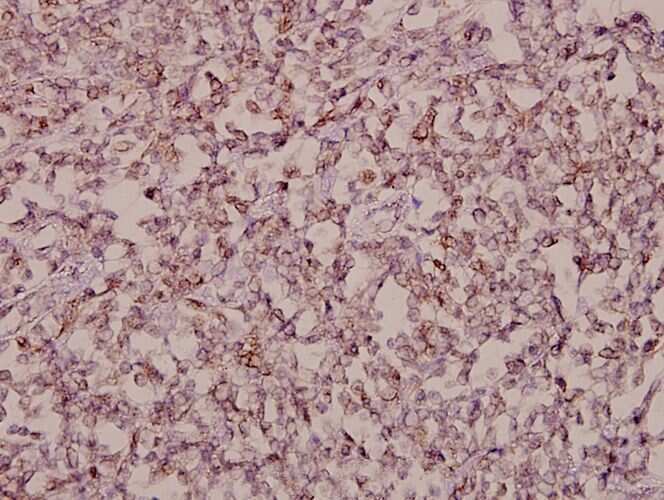
- Immunohistochemistry analysis of SALF in paraffin-embedded human tonsil carcinoma tissue. Samples were incubated with SALF polyclonal antibody (Product # PA5-75314) at a dilution of 1:50.
Supportive validation
- Submitted by
- Invitrogen Antibodies (provider)
- Main image
- Experimental details
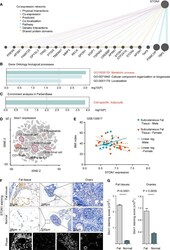
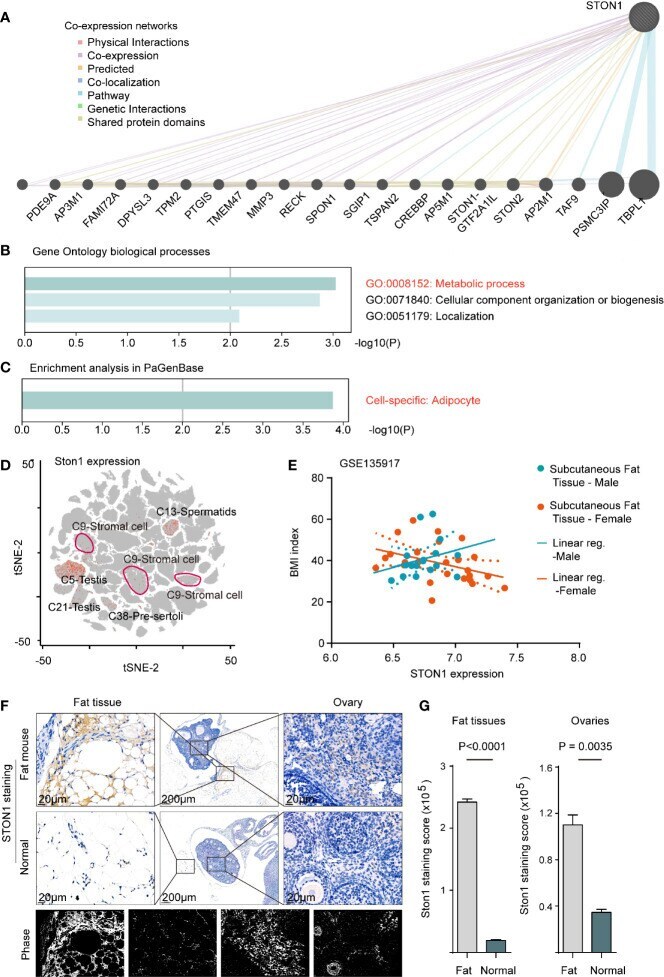
- Figure 3 STON1 was associated with metabolic processes in adipocytes and highly expressed in mouse fat and ovary tissue from fat-diet mice. (A) Co-expression networks of STON1 , co-expressed genes and interactions are indicated. (B) GO enrichment analysis of STON1 co-expressed genes. (C) Cell-specific analysis of STON1 co-expressed genes from PaGenBase. (D) tSNE map of STON1 in pooled mouse tissues from mouse single-cell sequencing data (Han et al., 2018), STON1 expression is shown with cluster labeled. (E) Correlation analysis between STON1 expression and BMI in males and females from GSE135917 dataset. IHC staining (F) and staining score (G) of STON1 in fat tissue and ovary tissue from fat-diet mice. GO, Gene Ontology; tSNE, t-distributed stochastic neighbor embedding; BMI, body mass index; IHC, immunohistochemistry.
- Submitted by
- Invitrogen Antibodies (provider)
- Main image

- Experimental details
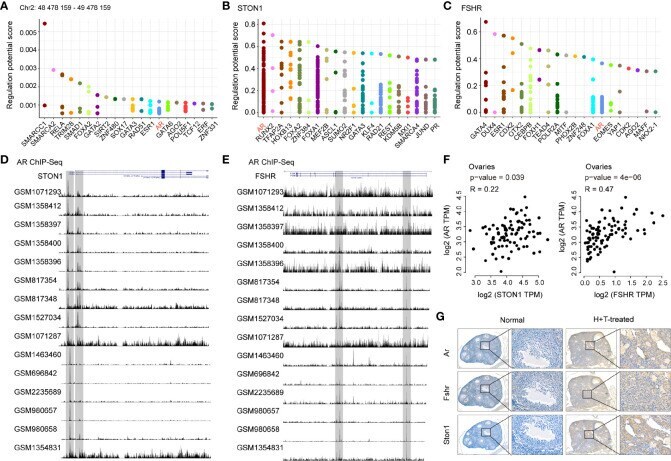
- Figure 5 AR was identified as the common transcription factor of STON1 and FSHR and positively correlated with STON1 and FSHR expression in ovary tissues. The top 20 transcription factors for the region of the rs13405728 locus (Chr2: 48478159-49478159) (A) STON1 (B) and FSHR (C) , regulatory potential (RP) represented the score to estimate how likely the TF could regulate the gene. Y-axis is the RP score, X-axis is different factors. Dots in the X-axis represent the same factors. ChIP-Seq peaks of AR in STON1 (D) and FSHR (E) from androgen receptor programming of human tissues (GSE56288 and GSE70079). Correlation analysis between the expression of AR and STON1 , AR and FSHR (F) in ovary tissues from GTEx dataset. (G) IHC staining of Ar, Fshr, and STON1 in normal mice and high-fat diet and testosterone-treated mice. AR, androgen receptor; GTEx, Genotype-Tissue Expression; H+T, high-fat diet and testosterone-treated.