Explore
 Validate
 Learn
Learn44-1125G
antibody from Invitrogen Antibodies
Targeting: MTOR
FLJ44809, FRAP, FRAP1, FRAP2, RAFT1, RAPT1
 Western blot
Antibody data
- Antibody Data
- Antigen structure
- References [13]
- Comments [0]
- Validations
- Western blot [2]
- Immunocytochemistry [1]
- Flow cytometry [1]
- Other assay [4]
Submit
Validation data
Reference
Comment
Report error
- Product number
- 44-1125G - Provider product page

- Provider
- Invitrogen Antibodies
- Product name
- Phospho-mTOR (Ser2448) Polyclonal Antibody
- Antibody type
- Polyclonal
- Antigen
- Synthetic peptide
- Reactivity
- Human, Mouse
- Host
- Rabbit
- Isotype
- IgG
- Vial size
- 100 µL
- Storage
- -20°C
Submitted references Role of mTORC1 activity during early retinal development and lamination in human-induced pluripotent stem cell-derived retinal organoids.
Dapagliflozin as an autophagic enhancer via LKB1/AMPK/SIRT1 pathway in ovariectomized/D-galactose Alzheimer's rat model.
ACSL4 contributes to sevoflurane-induced ferroptotic neuronal death in SH-SY5Y cells via the 5' AMP-activated protein kinase/mammalian target of rapamycin pathway.
PI3K/AKT/mTOR Signaling Pathway Is Required for JCPyV Infection in Primary Astrocytes.
Isolation and Establishment of a Highly Proliferative, Cancer Stem Cell-Like, and Naturally Immortalized Triple-Negative Breast Cancer Cell Line, KAIMRC2.
MM-129 as a Novel Inhibitor Targeting PI3K/AKT/mTOR and PD-L1 in Colorectal Cancer.
Ror2-mediated non-canonical Wnt signaling regulates Cdc42 and cell proliferation during tooth root development.
Implications of cell division cycle associated 4 on the Wilm's tumor cells viability via AKT/mTOR signaling pathway.
Sinoporphyrin sodium is a promising sensitizer for photodynamic and sonodynamic therapy in glioma.
Sirtuin1 activator SRT2183 suppresses glioma cell growth involving activation of endoplasmic reticulum stress pathway.
Silence of α1-Antitrypsin Inhibits Migration and Proliferation of Triple Negative Breast Cancer Cells.
Phase II study of the oral MEK inhibitor selumetinib in advanced acute myelogenous leukemia: a University of Chicago phase II consortium trial.
Identification of S6 kinase 1 as a novel mammalian target of rapamycin (mTOR)-phosphorylating kinase.
Lee SH, Han JW, Yang JY, Jun HO, Bang JH, Shin H, Choi JH, Lee J, Madrakhimov SB, Chung KH, Chang HS, Lyu J, Park TK
Cell death discovery 2022 Feb 8;8(1):56
Cell death discovery 2022 Feb 8;8(1):56
Dapagliflozin as an autophagic enhancer via LKB1/AMPK/SIRT1 pathway in ovariectomized/D-galactose Alzheimer's rat model.
Ibrahim WW, Kamel AS, Wahid A, Abdelkader NF
Inflammopharmacology 2022 Dec;30(6):2505-2520
Inflammopharmacology 2022 Dec;30(6):2505-2520
ACSL4 contributes to sevoflurane-induced ferroptotic neuronal death in SH-SY5Y cells via the 5' AMP-activated protein kinase/mammalian target of rapamycin pathway.
Cheng L, Zhu X, Liu Y, Zhu K, Lin K, Li F
Annals of translational medicine 2021 Sep;9(18):1454
Annals of translational medicine 2021 Sep;9(18):1454
PI3K/AKT/mTOR Signaling Pathway Is Required for JCPyV Infection in Primary Astrocytes.
Wilczek MP, Armstrong FJ, Mayberry CL, King BL, Maginnis MS
Cells 2021 Nov 18;10(11)
Cells 2021 Nov 18;10(11)
Isolation and Establishment of a Highly Proliferative, Cancer Stem Cell-Like, and Naturally Immortalized Triple-Negative Breast Cancer Cell Line, KAIMRC2.
Ali R, Al Zahrani H, Barhoumi T, Alhallaj A, Mashhour A, Alshammari MA, Alshawakir YA, Baz O, Alanazi AH, Khan AL, Al Nikhli H, Al Balwi MA, Al Riyees L, Boudjelal M
Cells 2021 May 24;10(6)
Cells 2021 May 24;10(6)
MM-129 as a Novel Inhibitor Targeting PI3K/AKT/mTOR and PD-L1 in Colorectal Cancer.
Hermanowicz JM, Pawlak K, Sieklucka B, Czarnomysy R, Kwiatkowska I, Kazberuk A, Surazynski A, Mojzych M, Pawlak D
Cancers 2021 Jun 26;13(13)
Cancers 2021 Jun 26;13(13)
Ror2-mediated non-canonical Wnt signaling regulates Cdc42 and cell proliferation during tooth root development.
Ma Y, Jing J, Feng J, Yuan Y, Wen Q, Han X, He J, Chen S, Ho TV, Chai Y
Development (Cambridge, England) 2021 Jan 21;148(2)
Development (Cambridge, England) 2021 Jan 21;148(2)
Implications of cell division cycle associated 4 on the Wilm's tumor cells viability via AKT/mTOR signaling pathway.
Li S, Qin C, Chen Y, Wei D, Tan Z, Meng J
Renal failure 2021 Dec;43(1):1470-1478
Renal failure 2021 Dec;43(1):1470-1478
Sinoporphyrin sodium is a promising sensitizer for photodynamic and sonodynamic therapy in glioma.
An YW, Liu HQ, Zhou ZQ, Wang JC, Jiang GY, Li ZW, Wang F, Jin HT
Oncology reports 2020 Oct;44(4):1596-1604
Oncology reports 2020 Oct;44(4):1596-1604
Sirtuin1 activator SRT2183 suppresses glioma cell growth involving activation of endoplasmic reticulum stress pathway.
Ye T, Wei L, Shi J, Jiang K, Xu H, Hu L, Kong L, Zhang Y, Meng S, Piao H
BMC cancer 2019 Jul 18;19(1):706
BMC cancer 2019 Jul 18;19(1):706
Silence of α1-Antitrypsin Inhibits Migration and Proliferation of Triple Negative Breast Cancer Cells.
Zhao Z, Ma J, Mao Y, Dong L, Li S, Zhang Y
Medical science monitor : international medical journal of experimental and clinical research 2018 Sep 27;24:6851-6860
Medical science monitor : international medical journal of experimental and clinical research 2018 Sep 27;24:6851-6860
Phase II study of the oral MEK inhibitor selumetinib in advanced acute myelogenous leukemia: a University of Chicago phase II consortium trial.
Jain N, Curran E, Iyengar NM, Diaz-Flores E, Kunnavakkam R, Popplewell L, Kirschbaum MH, Karrison T, Erba HP, Green M, Poire X, Koval G, Shannon K, Reddy PL, Joseph L, Atallah EL, Dy P, Thomas SP, Smith SE, Doyle LA, Stadler WM, Larson RA, Stock W, Odenike O
Clinical cancer research : an official journal of the American Association for Cancer Research 2014 Jan 15;20(2):490-8
Clinical cancer research : an official journal of the American Association for Cancer Research 2014 Jan 15;20(2):490-8
Identification of S6 kinase 1 as a novel mammalian target of rapamycin (mTOR)-phosphorylating kinase.
Holz MK, Blenis J
The Journal of biological chemistry 2005 Jul 15;280(28):26089-93
The Journal of biological chemistry 2005 Jul 15;280(28):26089-93
No comments: Submit comment
Supportive validation
- Submitted by
- Invitrogen Antibodies (provider)
- Main image
- Experimental details
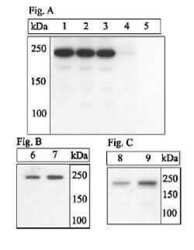
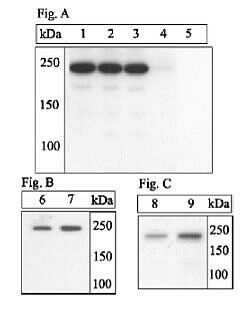
- Western Blotting ExperimentsLysates prepared from insulin-treated 3T3-L1 cells (Figure A, lanes 1-5), or CHO-T cells deprived of amino acids (i.e., grown in PBS for 2 hours) (Figure B, lane 6) or treated with insulin (Figure B, lane 7), or NIH3T3 fibroblasts
- Submitted by
- Invitrogen Antibodies (provider)
- Main image
- Experimental details
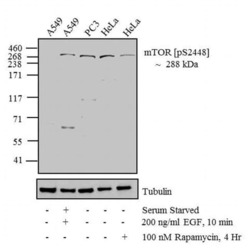
- Western blot analysis was performed on whole cell extracts (30 µg lysate) of A549 (Lane 1), A549 Serum Starved for overnight followed by treated for 10 minutes with 200 ng/mL of EGF (Lane 2), PC3 (Lane 3), HeLa (Lane 4) and HeLa treated for 4 hrs with 100 nM of Rapamycin (Lane 5). The blots were probed with Anti-mTOR (pS2448) Rabbit Polyclonal Antibody (Product # 44-1125G, 1:500-1:2000 dilution) and detected by chemiluminescence using Goat anti-Rabbit IgG (H+L) Secondary Antibody, HRP conjugate (Product # G-21234, 1:5000 dilution). A 288 kDa band corresponding to mTOR (pS2448) was observed in A549 treated with EGF and in PC3, while it decreased upon treatment with Rapamycin in HeLa. Known quantity of protein samples were electrophoresed using Novex® NuPAGE® 4-12 % Bis-Tris gel (Product # NP0321BOX), XCell SureLock™ Electrophoresis System (Product # EI0002) and Novex® Sharp Pre-Stained Protein Standard (Product # LC5800). Resolved proteins were then transferred onto a nitrocellulose membrane with overnight wet transfer system. The membrane was probed with the relevant primary and secondary Antibody using iBind™ Flex Western Starter Kit (Product # SLF2000S). Chemiluminescent detection was performed using Pierce™ ECL Western Blotting Substrate (Product # 32106).

Supportive validation
- Submitted by
- Invitrogen Antibodies (provider)
- Main image
- Experimental details
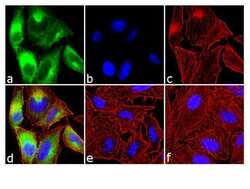
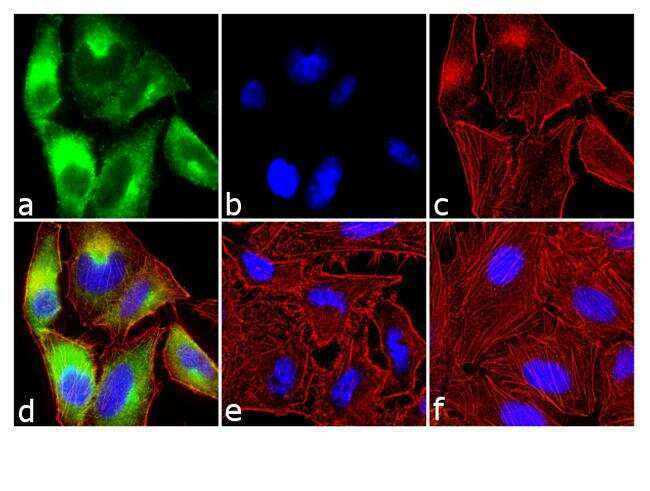
- Immunofluorescence analysis of Phospho-mTOR/FRAP pSer2448 was done on 70% confluent log phase A549 cells treated with serum starvation followed by 200 ng of EGF for 10 minutes. The cells were fixed with 4% paraformaldehyde for 10 minutes, permeabilized with 0.1% Triton™ X-100 for 10 minutes, and blocked with 1% BSA for 1 hour at room temperature. The cells were labeled with of Phospho-mTOR/FRAP pSer2448 Rabbit Polyclonal Antibody (Product # 44-1125G) at 1:250 dilution in 0.1% BSA and incubated for 3 hours at room temperature and then labeled with Goat anti-Rabbit IgG (H+L) Superclonal™ Secondary Antibody, Alexa Fluor® 488 conjugate (Product # A27034) at a dilution of 1:2000 for 45 minutes at room temperature (Panel a: green). Nuclei (Panel b: blue) were stained with SlowFade® Gold Antifade Mountant with DAPI (Product # S36938). F-actin (Panel c: red) was stained with Rhodamine Phalloidin (Product # R415, 1:300). Panel d is a merged image showing cytoplasmic localization. Panel e is untreated cell with no signal. Panel f is a no primary antibody control. The images were captured at 60X magnification.
Supportive validation
- Submitted by
- Invitrogen Antibodies (provider)
- Main image
- Experimental details
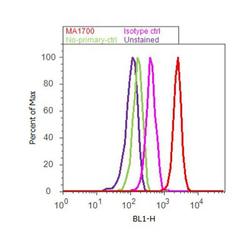
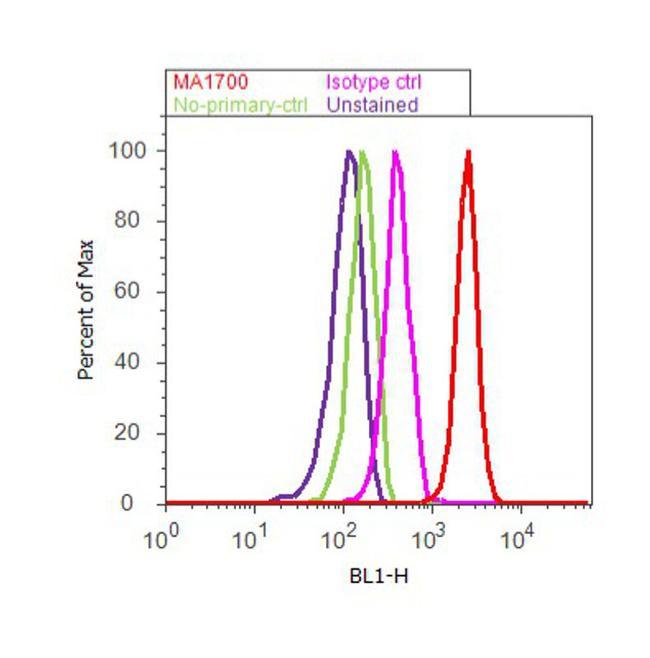
- Flow cytometry analysis of MTOR [PS2448] was done on U-87 MG cells. Cells were fixed with 70% ethanol for 10 minutes, permeabilized with 0.25% Triton™ X-100 for 20 minutes, and blocked with 5% BSA for 30 minutes at room temperature. Cells were labeled with MTOR [PS2448] Rabbit Polyclonal Antibody (441125G, red histogram) or with rabbit isotype control (pink histogram) at 3-5 ug/million cells in 2.5% BSA. After incubation at room temperature for 2 hours, the cells were labeled with Alexa Fluor® 488 Goat Anti-Rabbit Secondary Antibody (A11008) at a dilution of 1:400 for 30 minutes at room temperature. The representative 10,000 cells were acquired and analyzed for each sample using an Attune® Acoustic Focusing Cytometer. The purple histogram represents unstained control cells and the green histogram represents no-primary-antibody control.
Supportive validation
- Submitted by
- Invitrogen Antibodies (provider)
- Main image
- Experimental details
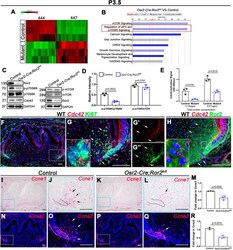
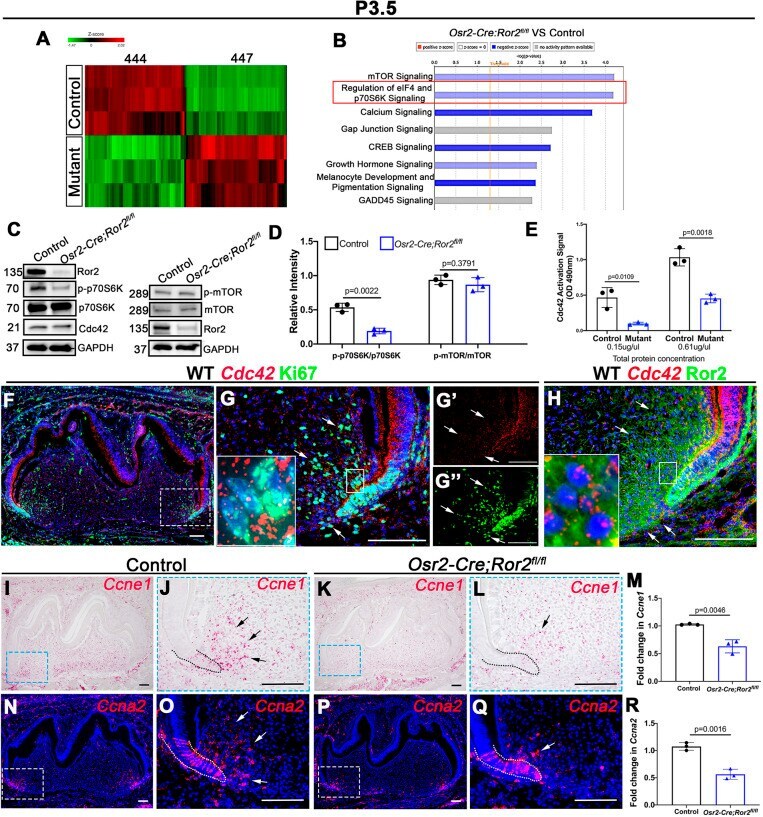
- Fig. 5. Putative downstream targets after loss of Ror2 in dental mesenchyme. (A) Heat map showing the gene expression profiles of dental mesenchyme in control and Osr2-Cre;Ror2 fl/fl (mutant) mandibular molars at P3.5. (B) Ingenuity pathway analysis based on RNA-seq data shows the downregulation of eIF4 and p70S6K signaling in Osr2-Cre;Ror2 fl/fl mice (indicated by the red box). (C) Western blot of Ror2, Cdc42, p70S6K, phospho (p)-p70S6K, mTOR, p-mTOR and GAPDH in the dental mesenchyme from control and Osr2-Cre;Ror2 fl/fl mice at P3.5. (D) Quantification of the relative intensity of p-p70S6K/p70S6K and p-mTOR/mTOR based on western blotting analysis ( n =3; unpaired, two-tailed Student's t -test). (E) The level of Cdc42 activation was measured in both equalized protein concentrations (0.15 µg/ul and 0.61 µg/ul) from control and Osr2-Cre;Ror2 fl/fl (mutant) molars at P3.5 by reading at OD 490 nm ( n =3; unpaired, two-tailed Student's t -test). (F,G) RNAscope in situ hybridization of Cdc42 (red) and immunostaining of Ki67 (green) on sagittal sections of mandibular molars from wild-type (WT) mice at P3.5. The box in F is shown at higher magnification in G (merged), G' ( Cdc42 ) and G'' (Ki67). The small box in G is shown in the inset at higher magnification to reveal the expression of Cdc42 and Ki67 in the dental mesenchymal cells. (H) RNAscope in situ hybridization of Cdc42 (red) and immunostaining of Ror2 (green) on sagittal sections of mandibular molars from wild-t
- Submitted by
- Invitrogen Antibodies (provider)
- Main image
- Experimental details
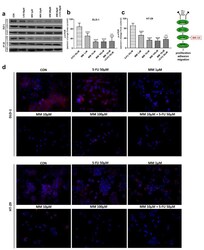
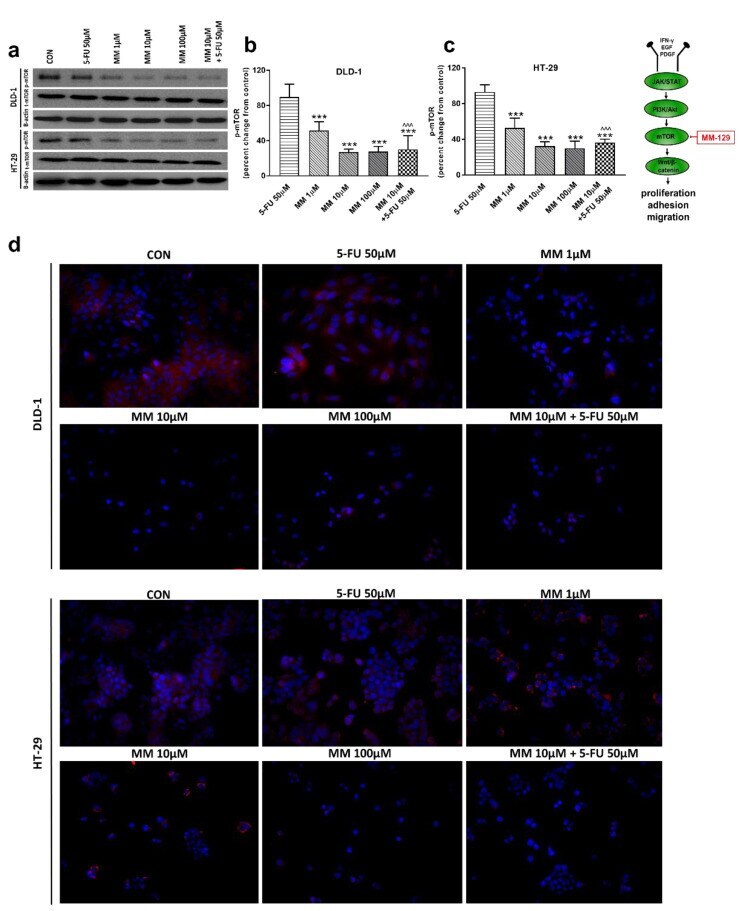
- Figure 4 Phosphorylated mTOR (p-mTOR), total mTOR (t-mTOR), and beta-actin expression as determined by Western blot ( a ) and phosphorylated mTOR (p-mTOR) determined by confocal microscopy ( d ) in DLD-1 and HT-29 cells treated with 5-FU (5-FU 50 uM), MM-129 (MM 1 uM, 10 uM, 100 uM), and their combination (MM 10 uM + 5-FU 50 uM) for 24 h. The samples used for electrophoresis consisted of 20 ug of protein from 6 pooled cell extracts. The samples used for electrophoresis consisted of 20 ug of protein from 6 pooled cell extracts from independent experiments ( n = 6). Band staining was quantified by densitometry ( b , c ). The corresponding uncropped blots are shown in Supplementary Figures S3a-c and S4a-c . Cells were incubated with rabbit polyclonal antibody against phospho mTOR and secondary goat polyclonal antibody against rabbit (red label). The nuclei were stained with Hoechst 33342 (blue label) ( d ). The results are presented as means +- SDs; *** p < 0.001 vs. CON, ^^^ p < 0.001 vs. 5-FU.
- Submitted by
- Invitrogen Antibodies (provider)
- Main image
- Experimental details
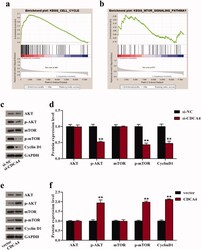
- Figure 4. CDCA4 affected cell cycle and AKT/mTOR signaling pathway. (a-b) GSEA was utilized to identify the relative signaling pathway associated with high CDCA4 expression. (c-f) The effects of CDCA4-knockdown (c-d) and -overexpression (e-f) on the AKT/mTOR relative markers and Cyclin D1 protein were evaluated using western blot analysis. (d) Quantification of c. (f) Quantification of e. ** p < 0.01 vs . si-NC or vector group.

- Submitted by
- Invitrogen Antibodies (provider)
- Main image

- Experimental details
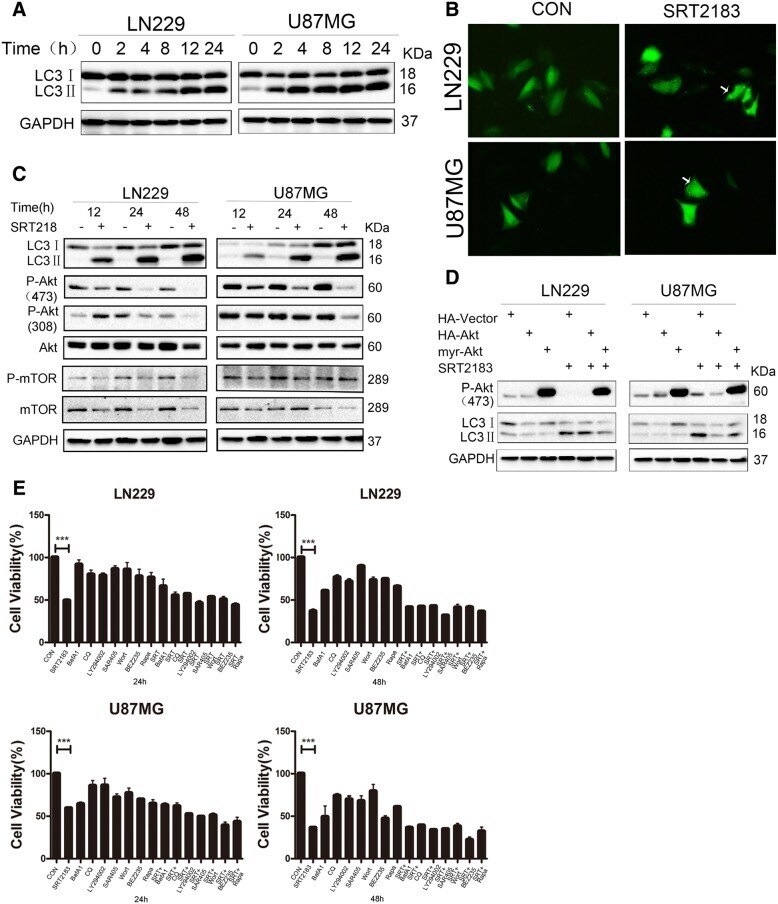
- Fig. 4 a SRT2183 induces autophagy in glioma cells. LN229 and U87MG cells were treated with vehicle or 10 muM SRT2183 for 2, 4, 8, 12, 24 h, expression levels of LC3 and GAPDH were measured by IB analysis. b LN229 and U87MG cells were pre-transfected with GFP-LC3,after 24 h the cells were treated with vehicle or 10 uM SRT2183 for 24 h. The results were observed by confocal microscope. c LN229 and U87MG cells were treated with vehicle or SRT2183 for 12, 24 and 48 h. Expression levels of LC3, P-Akt (473), P-Akt (308), Akt, P-mTOR, and mTOR were analyzed by IB. GAPDH was used as a control for equal loading. d LN229 and U87MG cells were transfected with HA-Vector, HA-Akt, and myr-Akt for 24 h, then they were treated with vehicle or SRT2183 for 24 h. Expression levels of P-Akt (473) and LC3 were analyzed by IB. e LN229 and U87MG cells were treated with vehicle or SRT2183 following pre-treatment with either autophagy inducers BEZ235 and Rapamycin (Rapa), or autophagy inhibitors Bafilomycin A1 (BafA1), Chloroquine (CQ), and SAR405, or PI3K inhibitors LY294002 and Wortmannin (Wort). CCK8 analysis was employed to determine cell growth inhibition. The above experiments were performed three times with comparable results. Results portrayed as the mean +- SEM (*** p < 0.001).