Explore
 Validate
 Learn
LearnPA1-46296
antibody from Invitrogen Antibodies
Targeting: ACTB
 Western blot
 ELISA Immunocytochemistry Immunoprecipitation Immunohistochemistry Flow cytometry Blocking/Neutralizing Other assay
Antibody data
- Antibody Data
- Antigen structure
- References [12]
- Comments [0]
- Validations
- Western blot [4]
- Immunocytochemistry [3]
- Immunohistochemistry [1]
- Flow cytometry [2]
- Other assay [6]
Submit
Validation data
Reference
Comment
Report error
- Product number
- PA1-46296 - Provider product page

- Provider
- Invitrogen Antibodies
- Product name
- beta Actin Polyclonal Antibody
- Antibody type
- Polyclonal
- Antigen
- Synthetic peptide
- Description
- This antibody is expected to cross-react with a wide range of species based on sequence homology.
- Reactivity
- Human, Mouse, Rat, Bovine, Chicken/Avian, Hamster, Porcine, Rabbit
- Host
- Rabbit
- Isotype
- IgG
- Vial size
- 50 µL
- Concentration
- 1 mg/mL
- Storage
- 4° C, do not freeze
Submitted references Cell clusters containing intestinal stem cells line, the zebrafish intestine intervillus pocket.
Poria Acid, Triterpenoids Extracted from Poria cocos, Inhibits the Invasion and Metastasis of Gastric Cancer Cells.
Betulonic Acid, as One of the Active Components of the Celastrus orbiculatus Extract, Inhibits the Invasion and Metastasis of Gastric Cancer Cells by Mediating Cytoskeleton Rearrangement In Vitro.
Molecular neurobiological markers in the onset of sodium appetite.
Immune Synapse Residency of Orai1 Alters Ca(2+) Response of T Cells.
Reduction of Renal Preservation/Reperfusion Injury by Controlled Hyperthermia During Ex Vivo Machine Perfusion.
CoQ10 augments candesartan protective effect against tourniquet-induced hind limb ischemia-reperfusion: Involvement of non-classical RAS and ROS pathways.
Proteome Analysis of Human Natural Killer Cell Derived Extracellular Vesicles for Identification of Anticancer Effectors.
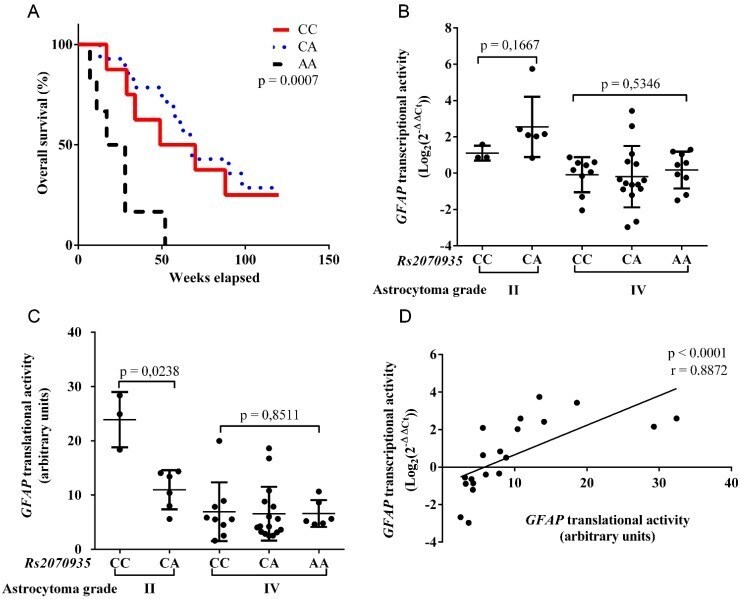
GFAP expression is influenced by astrocytoma grade and rs2070935 polymorphism.
Knockdown of COBRA1 decreases the proliferation and migration of hepatocellular carcinoma cells.
Molecular Magnetic Resonance Imaging of Tumor Response to Therapy.
Gestation age dependent transfer of human immunoglobulins across placenta in timed-pregnant guinea pigs.
Tavakoli S, Zhu S, Matsudaira P
iScience 2022 May 20;25(5):104280
iScience 2022 May 20;25(5):104280
Poria Acid, Triterpenoids Extracted from Poria cocos, Inhibits the Invasion and Metastasis of Gastric Cancer Cells.
Wang H, Luo Y, Chu Z, Ni T, Ou S, Dai X, Zhang X, Liu Y
Molecules (Basel, Switzerland) 2022 Jun 6;27(11)
Molecules (Basel, Switzerland) 2022 Jun 6;27(11)
Betulonic Acid, as One of the Active Components of the Celastrus orbiculatus Extract, Inhibits the Invasion and Metastasis of Gastric Cancer Cells by Mediating Cytoskeleton Rearrangement In Vitro.
Chu Z, Luo Y, Ni T, Zhu M, Feng X, Liu Y, Wang H
Molecules (Basel, Switzerland) 2022 Feb 2;27(3)
Molecules (Basel, Switzerland) 2022 Feb 2;27(3)
Molecular neurobiological markers in the onset of sodium appetite.
Porcari CY, Cambiasso MJ, Mecawi AS, Caeiro XE, Antunes-Rodrigues J, Vivas LM, Godino A
Scientific reports 2022 Aug 20;12(1):14224
Scientific reports 2022 Aug 20;12(1):14224
Immune Synapse Residency of Orai1 Alters Ca(2+) Response of T Cells.
Voros O, Panyi G, Hajdu P
International journal of molecular sciences 2021 Oct 26;22(21)
International journal of molecular sciences 2021 Oct 26;22(21)
Reduction of Renal Preservation/Reperfusion Injury by Controlled Hyperthermia During Ex Vivo Machine Perfusion.
Minor T, von Horn C
Clinical and translational science 2021 Mar;14(2):544-549
Clinical and translational science 2021 Mar;14(2):544-549
CoQ10 augments candesartan protective effect against tourniquet-induced hind limb ischemia-reperfusion: Involvement of non-classical RAS and ROS pathways.
Awad AS, Nour El-Din M, Kamel R
Saudi pharmaceutical journal : SPJ : the official publication of the Saudi Pharmaceutical Society 2021 Jul;29(7):724-733
Saudi pharmaceutical journal : SPJ : the official publication of the Saudi Pharmaceutical Society 2021 Jul;29(7):724-733
Proteome Analysis of Human Natural Killer Cell Derived Extracellular Vesicles for Identification of Anticancer Effectors.
Choi JW, Lim S, Kang JH, Hwang SH, Hwang KC, Kim SW, Lee S
Molecules (Basel, Switzerland) 2020 Nov 9;25(21)
Molecules (Basel, Switzerland) 2020 Nov 9;25(21)
GFAP expression is influenced by astrocytoma grade and rs2070935 polymorphism.
Sereika M, Urbanaviciute R, Tamasauskas A, Skiriute D, Vaitkiene P
Journal of Cancer 2018;9(23):4496-4502
Journal of Cancer 2018;9(23):4496-4502
Knockdown of COBRA1 decreases the proliferation and migration of hepatocellular carcinoma cells.
El Zeneini E, Kamel S, El-Meteini M, Amleh A
Oncology reports 2017 Mar;37(3):1896-1906
Oncology reports 2017 Mar;37(3):1896-1906
Molecular Magnetic Resonance Imaging of Tumor Response to Therapy.
Shuhendler AJ, Ye D, Brewer KD, Bazalova-Carter M, Lee KH, Kempen P, Dane Wittrup K, Graves EE, Rutt B, Rao J
Scientific reports 2015 Oct 6;5:14759
Scientific reports 2015 Oct 6;5:14759
Gestation age dependent transfer of human immunoglobulins across placenta in timed-pregnant guinea pigs.
Xu Y, Ma L, Norton MG, Stuart C, Zhao Z, Toibero D, Dahlen S, Zhong L, Zhang P, Struble EB
Placenta 2015 Dec;36(12):1370-7
Placenta 2015 Dec;36(12):1370-7
No comments: Submit comment
Supportive validation
- Submitted by
- Invitrogen Antibodies (provider)
- Main image

- Experimental details
- Western blot analysis of beta Actin using a polyclonal antibody (Product # PA1-46296).

- Submitted by
- Invitrogen Antibodies (provider)
- Main image

- Experimental details
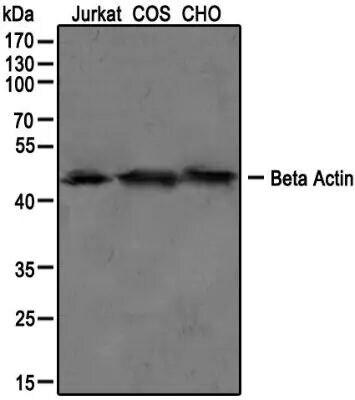
- Western blot analysis of beta Actin in Jurkat, COS, and CHO cell lysate. Samples were incubated in beta Actin polyclonal antibody (Product # PA1-46296) using a dilution of 1:100.

- Submitted by
- Invitrogen Antibodies (provider)
- Main image

- Experimental details
- Western blot analysis of beta Actin in Jurkat, COS, and CHO cell lysate. Samples were incubated in beta Actin polyclonal antibody (Product # PA1-46296) using a dilution of 1:100.
- Submitted by
- Invitrogen Antibodies (provider)
- Main image

- Experimental details
- Western blot analysis of beta Actin in 0.1 mg/mL HeLa lysate. Samples were incubated in beta Actin polyclonal antibody (Product # PA1-46296). This experiment was performed under reducing conditions using the 12-230 kDa separation system.

Supportive validation
- Submitted by
- Invitrogen Antibodies (provider)
- Main image

- Experimental details
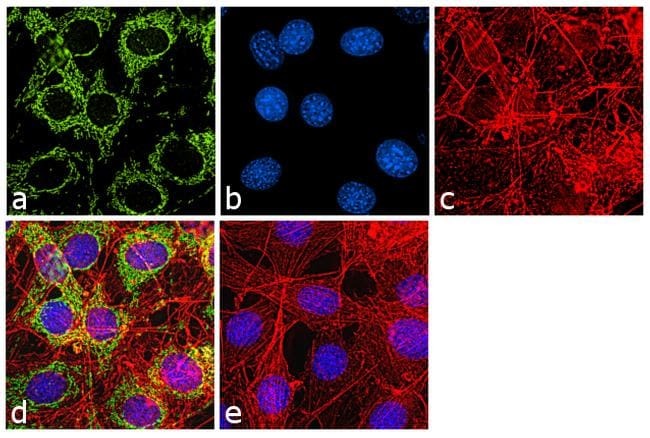
- Immunofluorescence analysis of beta Actin was performed using 70% confluent log phase A549 cells. The cells were fixed with 4% paraformaldehyde for 10 minutes, permeabilized with 0.1% Triton™ X-100 for 10 minutes, and blocked with 1% BSA for 1 hour at room temperature. The cells were labeled with beta Actin Rabbit Polyclonal Antibody (Product # PA1-46296) at 2µg/mL in 0.1% BSA and incubated for 3 hours at room temperature and then labeled with Goat anti-Rabbit IgG (H+L) Superclonal™ Secondary Antibody, Alexa Fluor® 488 conjugate (Product # A27034) at a dilution of 1:2000 for 45 minutes at room temperature (Panel a: green). Nuclei (Panel b: blue) were stained with SlowFade® Gold Antifade Mountant with DAPI (Product # S36938). F-actin (Panel c: red) was stained with Rhodamine Phalloidin (Product # R415, 1:300). Panel d represents the merged image showing cytoplasmic localization. Panel e shows the no primary antibody control. The images were captured at 60X magnification.

- Submitted by
- Invitrogen Antibodies (provider)
- Main image

- Experimental details
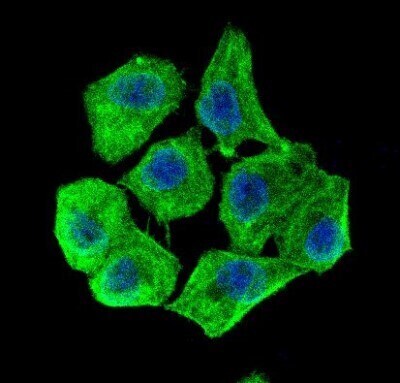
- Immunocytochemistry analysis of beta Actin in HeLa cells. Samples were incubated in beta Actin polyclonal antibody (Product # PA1-46296) followed by Alexa Fluor 488-conjugated Goat to rabbit IgG secondary antibody (green). DAPI was used to stain the cell nuclei (blue).
- Submitted by
- Invitrogen Antibodies (provider)
- Main image

- Experimental details
- Immunofluorescence analysis of beta Actin was performed using 70% confluent log phase NIH/3T3 cells. The cells were fixed with 4% paraformaldehyde for 10 minutes, permeabilized with 0.1% Triton™ X-100 for 10 minutes, and blocked with 1% BSA for 1 hour at room temperature. The cells were labeled with beta Actin Rabbit Polyclonal Antibody (Product # PA1-46296) at 2µg/mL in 0.1% BSA and incubated for 3 hours at room temperature and then labeled with Goat anti-Rabbit IgG (H+L) Superclonal™ Secondary Antibody, Alexa Fluor® 488 conjugate (Product # A27034) at a dilution of 1:2000 for 45 minutes at room temperature (Panel a: green). Nuclei (Panel b: blue) were stained with SlowFade® Gold Antifade Mountant with DAPI (Product # S36938). F-actin (Panel c: red) was stained with Rhodamine Phalloidin (Product # R415, 1:300). Panel d represents the merged image showing cytoplasmic localization. Panel e shows the no primary antibody control. The images were captured at 60X magnification.
Supportive validation
- Submitted by
- Invitrogen Antibodies (provider)
- Main image

- Experimental details
- Immunohistochemical analysis of beta Actin in mouse epidermis. Samples were incubated in beta Actin polyclonal antibody (Product # PA1-46296) followed by DAB with hematoxylin counterstain.

Supportive validation
- Submitted by
- Invitrogen Antibodies (provider)
- Main image

- Experimental details
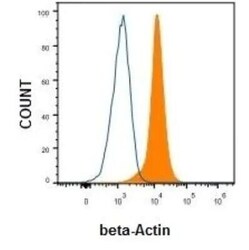
- Flow cytometry of beta Actin in HeLa cells (blue) and a matched isotype control (orange). Samples were incubated in beta Actin polyclonal antibody (Product # PA1-46296) using a dilution of 5 µg/mL for 30 minutes at room temperature. Cells were fixed with 4% PFA and then permeabilized with 0.1% saponin. Both antibodies were conjugated to Alexa Fluor 488.

- Submitted by
- Invitrogen Antibodies (provider)
- Main image
- Experimental details
- Flow cytometry of beta Actin in HeLa cells. Samples were incubated in beta Actin polyclonal antibody (Product # PA1-46296). Antibody (Orange) and Isotype control Antibody (Blue).

Supportive validation
- Submitted by
- Invitrogen Antibodies (provider)
- Main image

- Experimental details
- Figure 2 Animal models of metronomic chemotherapy and radiation therapy. ( a ) The scheme for generating each animal model is provided, where blue represents tumor growth phase, red represents treatment phase, and green represents imaging phase. ( b ) Tumor size was measured over time from the initiation of treatment, with fold-volume change relative to pre-treatment provided for untreated (black), metronomic chemotherapy (blue, 3x DOX) or radiation treatment (green, 7.6 Gy Radiation). ( c ) Western blot showing activation of caspase-3 (cleaved caspase-3) two days following radiation therapy or the end of metronomic chemotherapy. Values are cleaved caspase-3 band intensities normalized to actin loading control. ( d ) Prior to MR imaging, caspase-3 activation in tumors was determined using our fluorescent, quenched C-SNAM analog (Q-C-SNAF), confirming elevated caspase-3 activity following radiation and chemotherapy relative to untreated animals. ( e ) Tumor-to-leg fluorescence intensity ratio is provided for untreated (black), or mice treated with metronomic chemotherapy (blue) or radiation therapy (green). * p < 0.05 (ANOVA), n = 4.

- Submitted by
- Invitrogen Antibodies (provider)
- Main image

- Experimental details
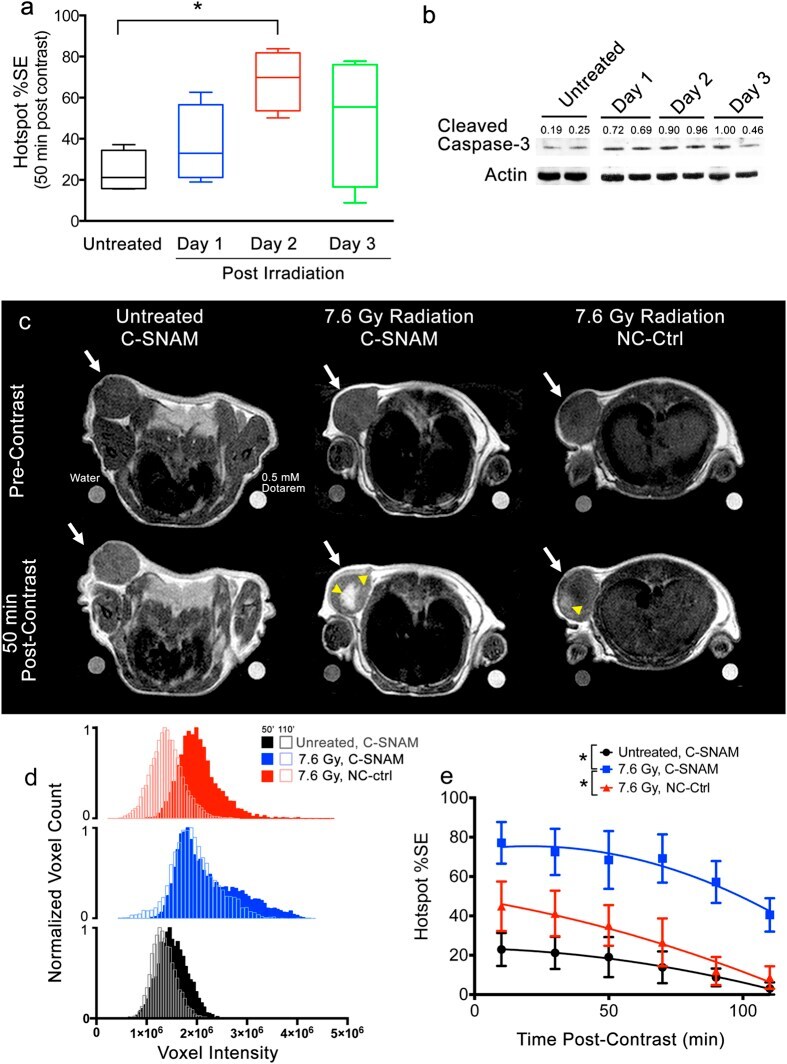
- Figure 4 Imaging the therapeutic response to single dose radiation therapy in HeLa tumor-bearing mice. ( a ) Box plot showing hotspot %SE due to caspase-3 activation for untreated mice (black), or for mice receiving 7.6 Gy tumor irradiation and imaged 1 (blue), 2 (red), or 3 days (green) later. All imaging was performed with C-SNAM. * p < 0.05 (ANOVA), n = 4 mice per group. ( b ) Western blot following cleaved caspase-3 expression in untreated mice and over time after tumor irradiation. Values are cleaved caspase-3 band intensities normalized to actin loading control. ( c ) Representative MR images of untreated (left) and treated mice (center) receiving C-SNAM, and treated mice receiving NC-ctrl (right) pre-contrast (top) and 50 min post-contrast (bottom). Tumor is indicated by white arrow, and hot spots are indicated by yellow arrowhead. Water and 0.5 mM Dotarem phantoms are shown on bottom left and right, respectively, of each image. ( d ) Representative voxel histograms for untreated (black) and treated (blue) mice receiving C-SNAM, and treated mice receiving NC-ctrl (red). Histograms are shown 50 min post-contrast (solid bars) and 110 min post-contrast (open bars). ( e ) The percent signal enhancement (%SE) for hotspot signal enhancement (mean signal within the top quartile of the enhancement histogram) is plotted over time for untreated (black) and treated (blue) mice receiving C-SNAM, and treated mice receiving NC-ctrl (red). Values are mean +- s.d., * p < 0.05 (general
- Submitted by
- Invitrogen Antibodies (provider)
- Main image

- Experimental details
- Figure 6 Effect of neutralizing antibodies against beta-actin and fibrinogen on the anticancer effect of EVs. Individual EVs mixed with/without neutralizing antibodies specific to beta-actin and fibrinogen were applied to 5 different types of cancer cells, and viability of cancer cells was measured. Experiments were performed in triplicate. Significant differences were determined via ANOVA, with p -values indicated as * p < 0.05 compared to the EVs without neutralizing antibodies.

- Submitted by
- Invitrogen Antibodies (provider)
- Main image

- Experimental details
- Fig. 6 Effect of candesartan, CoQ10 and their combination on phospho-p38 MAPK expression in rat gastrocnemius. (A) Representative western blots for phospho-p38 MAPK, p38 MAPK, and beta-actin proteins expression (B) Quantification of phospho-p38 MAPK protein expression relative to p38 MAPK (presented as fold change from control). Data are expressed as mean +- S.D (n = 6). a, b, c, d: significantly different from control, tourniquet, candesartan, CoQ10 groups, respectively, at p < 0.05.

- Submitted by
- Invitrogen Antibodies (provider)
- Main image

- Experimental details
- Localization of Prmt1-expressing cells in the intervillous pocket (A) Longitudinal sections of an adult zebrafish intestine stained with anti-beta-actin antibody (red), DAPI (blue) and anti-PRMT1 antibody (white). Prmt1 expression is localized within the mesenchyme (arrowhead m), adjacent to the basal lamina (arrowhead bl), or within the basal epithelium (arrowhead e). n > 10. Scale bar = 40 mum. (B) Longitudinal sections of promoter-driven recombinant tissues and stained with anti-PRMT1 antibody (white). CreER T2 under control of the prmt1 promoter changes the dTomato (red) expression to CFP (cyan) expression in enterocytes and goblet cells (yellow arrowheads) lining the flanking walls of IVP2. Anti-PRMT1 labeled cells (white) are located at the base of IVP1 and IVP2 (green arrowheads). Nuclei are labeled with DAPI (blue). n > 10. Scale bar = 40 mum. All the tissue samples were from anterior and middle sections of the zebrafish intestine.

- Submitted by
- Invitrogen Antibodies (provider)
- Main image
- Experimental details
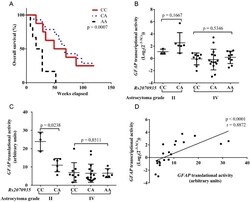
- Figure 2 Rs2070935 polymorphism is linked with varying GFAP expression and different grade IV astrocytoma patient survival. A) Kaplan-Meier curve for grade IV astrocytoma patient overall survival in accordance to rs2070935 genotypes. B) GFAP transcriptional activity, as detected by qRT-PCR assay and subdivided by genotypes of rs2070935 as well as tumor grade. C) GFAP translational activity, as observed by western blot assay and grouped by rs2070935 polymorphism as well as astrocytoma grade. D) Correlation between GFAP transcriptional and translational activities in the group of rs2070935 CA heterozygotes. In all graphs GFAP expression values at mRNA and protein levels were normalized to that of the reference gene ( Beta-actin ). GFAP transcriptional activity for tumor samples is in relation to the reference human brain control.