 Explore
 Validate
 Learn
Learn Flow cytometry
Antibody data
- Antibody Data
- Antigen structure
- References [40]
- Comments [0]
- Validations
- Flow cytometry [1]
- Other assay [32]
Submit
Validation data
Reference
Comment
Report error
- Product number
- 14-0259-82 - Provider product page

- Provider
- Invitrogen Antibodies
- Product name
- CD25 Monoclonal Antibody (BC96), eBioscience™
- Antibody type
- Monoclonal
- Antigen
- Other
- Description
- Description: The BC96 monoclonal antibody reacts with human CD25, the 55 kDa interleukin-2 receptor alpha chain (IL-2Ralpha). CD25 is expressed by early progenitors of T and B lineage as well as by activated mature T and B lymphocytes. By itself, CD25 binds IL-2 only with low affinity. However, CD25 associates with CD122 (IL-2 receptor beta chain) and CD132 (common gamma chain) to form the high affinity IL-2 receptor. CD25 plays a role in lymphocyte differentiating and activation/proliferation. Applications Reported: The BC96 antibody has been reported for use in flow cytometric analysis. Applications Tested: The BC96 antibody has been tested by flow cytometric analysis of PHA-activated normal human peripheral blood cells. This can be used at less than or equal to 1 µg per test. A test is defined as the amount (µg) of antibody that will stain a cell sample in a final volume of 100 µL. Cell number should be determined empirically but can range from 10^5 to 10^8 cells/test. It is recommended that the antibody be carefully titrated for optimal performance in the assay of interest. Purity: Greater than 90%, as determined by SDS-PAGE. Aggregation: Less than 10%, as determined by HPLC. Filtration: 0.2 µm post-manufacturing filtered.
- Reactivity
- Human
- Host
- Mouse
- Isotype
- IgG
- Antibody clone number
- BC96
- Vial size
- 100 µg
- Concentration
- 0.5 mg/mL
- Storage
- 4° C
Submitted references Rotenone aggravates PD-like pathology in A53T mutant human α-synuclein transgenic mice in an age-dependent manner.
Identification of celastrol as a novel HIV-1 latency reversal agent by an image-based screen.
Epinephrine Production in Th17 Cells and Experimental Autoimmune Encephalitis.
Human endoglin-CD3 bispecific T cell engager antibody induces anti-tumor effect in vivo.
Notch4 signaling limits regulatory T-cell-mediated tissue repair and promotes severe lung inflammation in viral infections.
FABP4 facilitates inflammasome activation to induce the Treg/Th17 imbalance in preeclampsia via forming a positive feedback with IL-17A.
Numerical optimization of microfluidic vortex shedding for genome editing T cells with Cas9.
T cell receptor-dependent S-acylation of ZAP-70 controls activation of T cells.
Soluble fibrinogen‑like protein 2 levels are decreased in patients with ischemic heart failure and associated with cardiac function.
Imbalance between T helper 1 and regulatory T cells plays a detrimental role in experimental Parkinson's disease in mice.
Th2 Biased Immunity With Altered B Cell Profiles in Circulation of Patients With Sporotrichosis Caused by Sporothrix globosa.
Potential of neutrophil to lymphocyte ratio in predicting sustained remission in rheumatoid arthritis compared to other immune activation markers.
Th17 reprogramming of T cells in systemic juvenile idiopathic arthritis.
Phase I Study of Ficlatuzumab and Cetuximab in Cetuximab-Resistant, Recurrent/Metastatic Head and Neck Cancer.
T-Lymphocyte Subset Distribution and Activity in Patients With Glaucoma.
Transcriptional down-regulation of ccr5 in a subset of HIV+ controllers and their family members.
Disruption of PD-1 Enhanced the Anti-tumor Activity of Chimeric Antigen Receptor T Cells Against Hepatocellular Carcinoma.
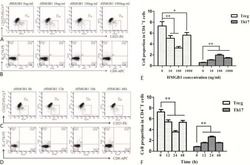
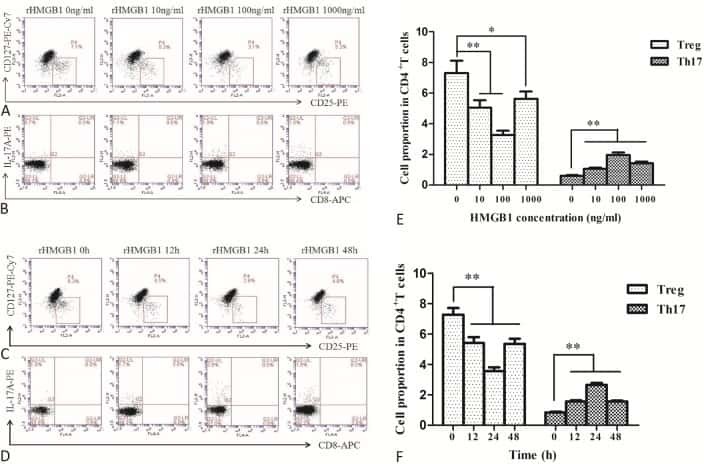
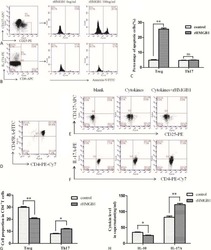
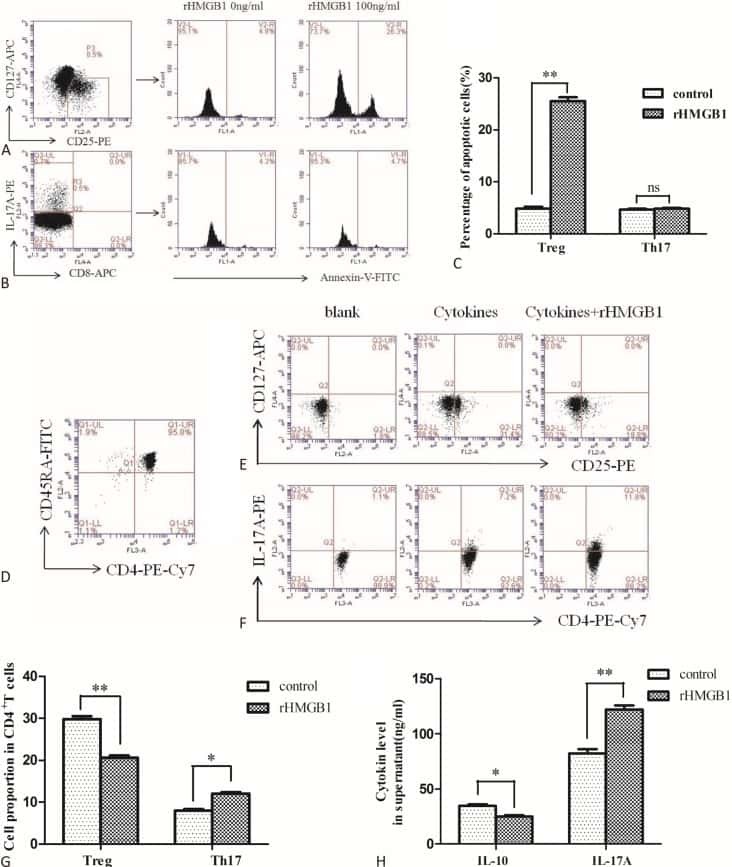
The Effects of High Mobility Group Box-1 Protein on Peripheral Treg/Th17 Balance in Patients with Atherosclerosis.
A probiotic modulates the microbiome and immunity in multiple sclerosis.
Induction of porcine-specific regulatory T cells with high specificity and expression of IL-10 and TGF-β1 using baboon-derived tolerogenic dendritic cells.
Hormonal vitamin D up-regulates tissue-specific PD-L1 and PD-L2 surface glycoprotein expression in humans but not mice.
Alteration of Th17 and Foxp3(+) regulatory T cells in patients with unexplained recurrent spontaneous abortion before and after the therapy of hCG combined with immunoglobulin.
Combinations of isoform-targeted histone deacetylase inhibitors and bryostatin analogues display remarkable potency to activate latent HIV without global T-cell activation.
Equilibrium of Treg/Th17 cells of peripheral blood in syphilitic patients with sero-resistance.
The prognostic effects of tumor infiltrating regulatory T cells and myeloid derived suppressor cells assessed by multicolor flow cytometry in gastric cancer patients.
Human Head and Neck Squamous Cell Carcinoma-Associated Semaphorin 4D Induces Expansion of Myeloid-Derived Suppressor Cells.
Alloantigen-specific regulatory T cells generated with a chimeric antigen receptor.
Immune responses induced by T-cell vaccination in patients with rheumatoid arthritis.
Generation and in vivo evaluation of IL10-treated dendritic cells in a nonhuman primate model of AAV-based gene transfer.
Microbe-specific unconventional T cells induce human neutrophil differentiation into antigen cross-presenting cells.
γδ T cells restrain extrathymic development of Foxp3+-inducible regulatory T cells via IFN-γ.
In vivo expansion of co-transplanted T cells impacts on tumor re-initiating activity of human acute myeloid leukemia in NSG mice.
Protective roles of epithelial cells in the survival of adult T-cell leukemia/lymphoma cells.
Decrease in proportion of CD19+ CD24(hi) CD27+ B cells and impairment of their suppressive function in Graves' disease.
HTLV-1 modulates the frequency and phenotype of FoxP3+CD4+ T cells in virus-infected individuals.
HTLV-1 propels thymic human T cell development in "human immune system" Rag2⁻/⁻ gamma c⁻/⁻ mice.
IL-15 transpresentation promotes both human T-cell reconstitution and T-cell-dependent antibody responses in vivo.
Fc receptor-like 3 protein expressed on IL-2 nonresponsive subset of human regulatory T cells.
Phosphoantigen-activated V gamma 2V delta 2 T cells antagonize IL-2-induced CD4+CD25+Foxp3+ T regulatory cells in mycobacterial infection.
IL-15 trans-presentation promotes human NK cell development and differentiation in vivo.
Chen AD, Cao JX, Chen HC, Du HL, Xi XX, Sun J, Yin J, Jing YH, Gao LP
Frontiers in aging neuroscience 2022;14:842380
Frontiers in aging neuroscience 2022;14:842380
Identification of celastrol as a novel HIV-1 latency reversal agent by an image-based screen.
Liu H, Hu PW, Dubrulle J, Stossi F, Nikolai BC, Mancini MA, Rice AP
PloS one 2021;16(4):e0244771
PloS one 2021;16(4):e0244771
Epinephrine Production in Th17 Cells and Experimental Autoimmune Encephalitis.
Yang P, Tian H, Zou YR, Chambon P, Ichinose H, Honig G, Diamond B, Kim SJ
Frontiers in immunology 2021;12:616583
Frontiers in immunology 2021;12:616583
Human endoglin-CD3 bispecific T cell engager antibody induces anti-tumor effect in vivo.
Zhong L, Shi W, Gan L, Liu X, Huo Y, Wu P, Zhang Z, Wu T, Peng H, Huang Y, Zhao Y, Yuan Y, Deng Z, Tang H
Theranostics 2021;11(13):6393-6406
Theranostics 2021;11(13):6393-6406
Notch4 signaling limits regulatory T-cell-mediated tissue repair and promotes severe lung inflammation in viral infections.
Harb H, Benamar M, Lai PS, Contini P, Griffith JW, Crestani E, Schmitz-Abe K, Chen Q, Fong J, Marri L, Filaci G, Del Zotto G, Pishesha N, Kolifrath S, Broggi A, Ghosh S, Gelmez MY, Oktelik FB, Cetin EA, Kiykim A, Kose M, Wang Z, Cui Y, Yu XG, Li JZ, Berra L, Stephen-Victor E, Charbonnier LM, Zanoni I, Ploegh H, Deniz G, De Palma R, Chatila TA
Immunity 2021 Jun 8;54(6):1186-1199.e7
Immunity 2021 Jun 8;54(6):1186-1199.e7
FABP4 facilitates inflammasome activation to induce the Treg/Th17 imbalance in preeclampsia via forming a positive feedback with IL-17A.
Chang GP, Yang XL, Liu W, Lin S, Yang SL, Zhao MY
Molecular therapy. Nucleic acids 2021 Jun 4;24:743-754
Molecular therapy. Nucleic acids 2021 Jun 4;24:743-754
Numerical optimization of microfluidic vortex shedding for genome editing T cells with Cas9.
Jarrell JA, Sytsma BJ, Wilson LH, Pan FL, Lau KHWJ, Kirby GTS, Lievano AA, Pawell RS
Scientific reports 2021 Jun 3;11(1):11818
Scientific reports 2021 Jun 3;11(1):11818
T cell receptor-dependent S-acylation of ZAP-70 controls activation of T cells.
Tewari R, Shayahati B, Fan Y, Akimzhanov AM
The Journal of biological chemistry 2021 Jan-Jun;296:100311
The Journal of biological chemistry 2021 Jan-Jun;296:100311
Soluble fibrinogen‑like protein 2 levels are decreased in patients with ischemic heart failure and associated with cardiac function.
You Y, Huang S, Liu H, Fan C, Liu K, Wang Z
Molecular medicine reports 2021 Aug;24(2)
Molecular medicine reports 2021 Aug;24(2)
Imbalance between T helper 1 and regulatory T cells plays a detrimental role in experimental Parkinson's disease in mice.
Li W, Luo Y, Xu H, Ma Q, Yao Q
The Journal of international medical research 2021 Apr;49(4):300060521998471
The Journal of international medical research 2021 Apr;49(4):300060521998471
Th2 Biased Immunity With Altered B Cell Profiles in Circulation of Patients With Sporotrichosis Caused by Sporothrix globosa.
Zu J, Yao L, Song Y, Cui Y, Guan M, Chen R, Zhen Y, Li S
Frontiers in immunology 2020;11:570888
Frontiers in immunology 2020;11:570888
Potential of neutrophil to lymphocyte ratio in predicting sustained remission in rheumatoid arthritis compared to other immune activation markers.
Chandrashekara S, Lingaraju DC, Renuka P, Anupama KR
The Indian journal of medical research 2020 Sep;152(3):234-243
The Indian journal of medical research 2020 Sep;152(3):234-243
Th17 reprogramming of T cells in systemic juvenile idiopathic arthritis.
Henderson LA, Hoyt KJ, Lee PY, Rao DA, Jonsson AH, Nguyen JP, Rutherford K, Julé AM, Charbonnier LM, Case S, Chang MH, Cohen EM, Dedeoglu F, Fuhlbrigge RC, Halyabar O, Hazen MM, Janssen E, Kim S, Lo J, Lo MS, Meidan E, Son MBF, Sundel RP, Stoll ML, Nusbaum C, Lederer JA, Chatila TA, Nigrovic PA
JCI insight 2020 Mar 26;5(6)
JCI insight 2020 Mar 26;5(6)
Phase I Study of Ficlatuzumab and Cetuximab in Cetuximab-Resistant, Recurrent/Metastatic Head and Neck Cancer.
Bauman JE, Ohr J, Gooding WE, Ferris RL, Duvvuri U, Kim S, Johnson JT, Soloff AC, Wallweber G, Winslow J, Gaither-Davis A, Grandis JR, Stabile LP
Cancers 2020 Jun 11;12(6)
Cancers 2020 Jun 11;12(6)
T-Lymphocyte Subset Distribution and Activity in Patients With Glaucoma.
Yang X, Zeng Q, Göktas E, Gopal K, Al-Aswad L, Blumberg DM, Cioffi GA, Liebmann JM, Tezel G
Investigative ophthalmology & visual science 2019 Mar 1;60(4):877-888
Investigative ophthalmology & visual science 2019 Mar 1;60(4):877-888
Transcriptional down-regulation of ccr5 in a subset of HIV+ controllers and their family members.
Gonzalo-Gil E, Rapuano PB, Ikediobi U, Leibowitz R, Mehta S, Coskun AK, Porterfield JZ, Lampkin TD, Marconi VC, Rimland D, Walker BD, Deeks S, Sutton RE
eLife 2019 Apr 9;8
eLife 2019 Apr 9;8
Disruption of PD-1 Enhanced the Anti-tumor Activity of Chimeric Antigen Receptor T Cells Against Hepatocellular Carcinoma.
Guo X, Jiang H, Shi B, Zhou M, Zhang H, Shi Z, Du G, Luo H, Wu X, Wang Y, Sun R, Li Z
Frontiers in pharmacology 2018;9:1118
Frontiers in pharmacology 2018;9:1118
The Effects of High Mobility Group Box-1 Protein on Peripheral Treg/Th17 Balance in Patients with Atherosclerosis.
Ding JW, Zhou T, Zheng XX, Wang XA, Tong XH, Luo CY, Zhang ZQ, Yu B
Acta Cardiologica Sinica 2018 Sep;34(5):399-408
Acta Cardiologica Sinica 2018 Sep;34(5):399-408
A probiotic modulates the microbiome and immunity in multiple sclerosis.
Tankou SK, Regev K, Healy BC, Tjon E, Laghi L, Cox LM, Kivisäkk P, Pierre IV, Hrishikesh L, Gandhi R, Cook S, Glanz B, Stankiewicz J, Weiner HL
Annals of neurology 2018 Jun;83(6):1147-1161
Annals of neurology 2018 Jun;83(6):1147-1161
Induction of porcine-specific regulatory T cells with high specificity and expression of IL-10 and TGF-β1 using baboon-derived tolerogenic dendritic cells.
Li M, Eckl J, Abicht JM, Mayr T, Reichart B, Schendel DJ, Pohla H
Xenotransplantation 2018 Jan;25(1)
Xenotransplantation 2018 Jan;25(1)
Hormonal vitamin D up-regulates tissue-specific PD-L1 and PD-L2 surface glycoprotein expression in humans but not mice.
Dimitrov V, Bouttier M, Boukhaled G, Salehi-Tabar R, Avramescu RG, Memari B, Hasaj B, Lukacs GL, Krawczyk CM, White JH
The Journal of biological chemistry 2017 Dec 15;292(50):20657-20668
The Journal of biological chemistry 2017 Dec 15;292(50):20657-20668
Alteration of Th17 and Foxp3(+) regulatory T cells in patients with unexplained recurrent spontaneous abortion before and after the therapy of hCG combined with immunoglobulin.
Sha J, Liu F, Zhai J, Liu X, Zhang Q, Zhang B
Experimental and therapeutic medicine 2017 Aug;14(2):1114-1118
Experimental and therapeutic medicine 2017 Aug;14(2):1114-1118
Combinations of isoform-targeted histone deacetylase inhibitors and bryostatin analogues display remarkable potency to activate latent HIV without global T-cell activation.
Albert BJ, Niu A, Ramani R, Marshall GR, Wender PA, Williams RM, Ratner L, Barnes AB, Kyei GB
Scientific reports 2017 Aug 7;7(1):7456
Scientific reports 2017 Aug 7;7(1):7456
Equilibrium of Treg/Th17 cells of peripheral blood in syphilitic patients with sero-resistance.
Zhao J, Ma J, Zhang X, Li Q, Yang X
Experimental and therapeutic medicine 2016 Jun;11(6):2300-2304
Experimental and therapeutic medicine 2016 Jun;11(6):2300-2304
The prognostic effects of tumor infiltrating regulatory T cells and myeloid derived suppressor cells assessed by multicolor flow cytometry in gastric cancer patients.
Choi HS, Ha SY, Kim HM, Ahn SM, Kang MS, Kim KM, Choi MG, Lee JH, Sohn TS, Bae JM, Kim S, Kang ES
Oncotarget 2016 Feb 16;7(7):7940-51
Oncotarget 2016 Feb 16;7(7):7940-51
Human Head and Neck Squamous Cell Carcinoma-Associated Semaphorin 4D Induces Expansion of Myeloid-Derived Suppressor Cells.
Younis RH, Han KL, Webb TJ
Journal of immunology (Baltimore, Md. : 1950) 2016 Feb 1;196(3):1419-29
Journal of immunology (Baltimore, Md. : 1950) 2016 Feb 1;196(3):1419-29
Alloantigen-specific regulatory T cells generated with a chimeric antigen receptor.
MacDonald KG, Hoeppli RE, Huang Q, Gillies J, Luciani DS, Orban PC, Broady R, Levings MK
The Journal of clinical investigation 2016 Apr 1;126(4):1413-24
The Journal of clinical investigation 2016 Apr 1;126(4):1413-24
Immune responses induced by T-cell vaccination in patients with rheumatoid arthritis.
Ivanova I, Seledtsova G, Mamaev S, Shishkov A, Seledtsov V
Human vaccines & immunotherapeutics 2014;10(5):1221-7
Human vaccines & immunotherapeutics 2014;10(5):1221-7
Generation and in vivo evaluation of IL10-treated dendritic cells in a nonhuman primate model of AAV-based gene transfer.
Moreau A, Vandamme C, Segovia M, Devaux M, Guilbaud M, Tilly G, Jaulin N, Le Duff J, Cherel Y, Deschamps JY, Anegon I, Moullier P, Cuturi MC, Adjali O
Molecular therapy. Methods & clinical development 2014;1:14028
Molecular therapy. Methods & clinical development 2014;1:14028
Microbe-specific unconventional T cells induce human neutrophil differentiation into antigen cross-presenting cells.
Davey MS, Morgan MP, Liuzzi AR, Tyler CJ, Khan MWA, Szakmany T, Hall JE, Moser B, Eberl M
Journal of immunology (Baltimore, Md. : 1950) 2014 Oct 1;193(7):3704-3716
Journal of immunology (Baltimore, Md. : 1950) 2014 Oct 1;193(7):3704-3716
γδ T cells restrain extrathymic development of Foxp3+-inducible regulatory T cells via IFN-γ.
Visperas A, Shen B, Min B
European journal of immunology 2014 Aug;44(8):2448-56
European journal of immunology 2014 Aug;44(8):2448-56
In vivo expansion of co-transplanted T cells impacts on tumor re-initiating activity of human acute myeloid leukemia in NSG mice.
von Bonin M, Wermke M, Cosgun KN, Thiede C, Bornhauser M, Wagemaker G, Waskow C
PloS one 2013;8(4):e60680
PloS one 2013;8(4):e60680
Protective roles of epithelial cells in the survival of adult T-cell leukemia/lymphoma cells.
Miyatake Y, Oliveira AL, Jarboui MA, Ota S, Tomaru U, Teshima T, Hall WW, Kasahara M
The American journal of pathology 2013 May;182(5):1832-42
The American journal of pathology 2013 May;182(5):1832-42
Decrease in proportion of CD19+ CD24(hi) CD27+ B cells and impairment of their suppressive function in Graves' disease.
Zha B, Wang L, Liu X, Liu J, Chen Z, Xu J, Sheng L, Li Y, Chu Y
PloS one 2012;7(11):e49835
PloS one 2012;7(11):e49835
HTLV-1 modulates the frequency and phenotype of FoxP3+CD4+ T cells in virus-infected individuals.
Satou Y, Utsunomiya A, Tanabe J, Nakagawa M, Nosaka K, Matsuoka M
Retrovirology 2012 May 30;9:46
Retrovirology 2012 May 30;9:46
HTLV-1 propels thymic human T cell development in "human immune system" Rag2⁻/⁻ gamma c⁻/⁻ mice.
Villaudy J, Wencker M, Gadot N, Gillet NA, Scoazec JY, Gazzolo L, Manz MG, Bangham CR, Dodon MD
PLoS pathogens 2011 Sep;7(9):e1002231
PLoS pathogens 2011 Sep;7(9):e1002231
IL-15 transpresentation promotes both human T-cell reconstitution and T-cell-dependent antibody responses in vivo.
Huntington ND, Alves NL, Legrand N, Lim A, Strick-Marchand H, Mention JJ, Plet A, Weijer K, Jacques Y, Becker PD, Guzman C, Soussan P, Kremsdorf D, Spits H, Di Santo JP
Proceedings of the National Academy of Sciences of the United States of America 2011 Apr 12;108(15):6217-22
Proceedings of the National Academy of Sciences of the United States of America 2011 Apr 12;108(15):6217-22
Fc receptor-like 3 protein expressed on IL-2 nonresponsive subset of human regulatory T cells.
Nagata S, Ise T, Pastan I
Journal of immunology (Baltimore, Md. : 1950) 2009 Jun 15;182(12):7518-26
Journal of immunology (Baltimore, Md. : 1950) 2009 Jun 15;182(12):7518-26
Phosphoantigen-activated V gamma 2V delta 2 T cells antagonize IL-2-induced CD4+CD25+Foxp3+ T regulatory cells in mycobacterial infection.
Gong G, Shao L, Wang Y, Chen CY, Huang D, Yao S, Zhan X, Sicard H, Wang R, Chen ZW
Blood 2009 Jan 22;113(4):837-45
Blood 2009 Jan 22;113(4):837-45
IL-15 trans-presentation promotes human NK cell development and differentiation in vivo.
Huntington ND, Legrand N, Alves NL, Jaron B, Weijer K, Plet A, Corcuff E, Mortier E, Jacques Y, Spits H, Di Santo JP
The Journal of experimental medicine 2009 Jan 16;206(1):25-34
The Journal of experimental medicine 2009 Jan 16;206(1):25-34
No comments: Submit comment
Supportive validation
- Submitted by
- Invitrogen Antibodies (provider)
- Main image

- Experimental details
- Staining of PHA stimulated human PBMC with Anti-Human CD25 PE. Appropriate isotype controls were used (open histogram). Total viable cells were used for analysis.

Supportive validation
- Submitted by
- Invitrogen Antibodies (provider)
- Main image

- Experimental details
- NULL

- Submitted by
- Invitrogen Antibodies (provider)
- Main image

- Experimental details
- NULL

- Submitted by
- Invitrogen Antibodies (provider)
- Main image

- Experimental details
- NULL

- Submitted by
- Invitrogen Antibodies (provider)
- Main image

- Experimental details
- NULL

- Submitted by
- Invitrogen Antibodies (provider)
- Main image

- Experimental details
- NULL

- Submitted by
- Invitrogen Antibodies (provider)
- Main image
- Experimental details
- NULL
- Submitted by
- Invitrogen Antibodies (provider)
- Main image
- Experimental details
- NULL
- Submitted by
- Invitrogen Antibodies (provider)
- Main image

- Experimental details
- NULL

- Submitted by
- Invitrogen Antibodies (provider)
- Main image

- Experimental details
- NULL

- Submitted by
- Invitrogen Antibodies (provider)
- Main image

- Experimental details
- Figure 5 S-acylation of ZAP-70 is required for T cell activation. A , IL-2 production by P116 (ZAP-70 -/-) Jurkat T cells stably rescued with WT or acylation-deficient C564R ZAP-70. IL-2 concentrations were measured by ELISA in supernatants from resting cells or cells stimulated for 24 h with plate-bound anti-CD3 antibody. Data shown are representative of three independent biological repeats and represented as mean +- SEM. B and C , Expression of CD25 and CD69 T cell surface activation markers by P116 stably rescued with WT or C564R ZAP-70. Cells were stimulated for 24 h with plate-bound anti-CD3 antibody and analyzed by flow cytometry. D and E , Quantification of CD25 and CD69 expression measured by flow cytometry. Data shown are pooled from three independent biological repeats and represented as mean +- SEM.

- Submitted by
- Invitrogen Antibodies (provider)
- Main image

- Experimental details
- Figure 1. Flow cytometric mapping of the CD4 + CD25 + Foxp3 + cells in peripheral blood withdrawn from the syphilitic patients with sero-resistance. Foxp3, forkhead box P3.

- Submitted by
- Invitrogen Antibodies (provider)
- Main image

- Experimental details
- Figure 5. Percentage of regulatory T-cells in the course of T-cell vaccination in RA patients. PBMC from RA patients (n = 11) were analyzed by flow cytometry for ""naive"" regulatory CD4 + CD25 + FoxP3 + T-cells (closed bars) and induced regulatory CD4 + CD25 - FoxP3 + T-cells (open bars) before the onset and in course of T-cell vaccination (observation period 12 mo), as compared with PBMC from healthy donors (n = 10). Percentage of positive cells from the total lymphoid cell population ( y -axis) was determined by flow cytometry. ** P < 0.01, as compared with the levels before therapy (U criterion). Error bars denote means +- SEM (percentage of positive cells).

- Submitted by
- Invitrogen Antibodies (provider)
- Main image

- Experimental details
- Figure 7 Synergistic combinations avoid global T-cell activation and induction of cytokine release. Resting CD4+ CD25- T-cells were isolated from a HIV-1 negative donor blood. Cells were incubated 24 h with 1 nM bryologs and 100 nM HDAC inhibitor. Cells were stained with fluorescent-conjugated antibodies (a) CD25-APC and (b) CD69-FITC and analyzed by FACS (see Methods). Data indicate mean values and error bars indicate mean +- s.e.m. (n >= 3). ***p < 0.001, (ANOVA). (c) ELISA results for cytokine release from CD4+ CD25- T-cells following 24 h incubation with LRA combinations (see Methods). ( d ) Toxicity profile of LRA combinations. Resting CD4+ T-cells were incubated with compounds at indicated concentrations and MTT toxicity assay was performed as described in Methods.

- Submitted by
- Invitrogen Antibodies (provider)
- Main image

- Experimental details
- Figure 5 Notch4 deficiency reprograms the lung Treg cell transcriptome of poly(I:C)-treated mice (A-C) Volcano plot (A), heatmap (B), and pathway analysis (C) of gene transcripts of lung Treg cells isolated from Foxp3 YFPCre and Foxp3 YFPCre Notch4 Delta/Delta mice treated with poly(I:C) (n = 4 and n = 5, respectively). (D) Flow cytometry histograms and graphical representation of lung tissue Treg cell expression of CD25, Helios, CTLA4, ICOS, and OX40 in Foxp3 YFPCre and Foxp3 YFPCre Notch4 Delta/Delta mice sampled on day 7 after poly(I:C) treatment (n = 5 for each time point). (E-H) Flow cytometry analysis (E and G) and graphical representation (F and H) of Helios expression in Foxp3 + Notch4 + and Foxp3 + Notch4 - lung tissue Treg cells in Foxp3 YFPCre mice sampled at the indicated dates after poly(I:C) treatment (n = 5 for each time point). Each symbol represents one mouse. Numbers in flow plots indicate percentages. Error bars indicate SEM. Statistical tests: pairwise comparisons of differential gene expression were computed using DESeq2 (A-C); Student''s unpaired two-tailed t test (D) and two-way ANOVA with Sidak''s post hoc analysis (F and H). * p < 0.05, ** p < 0.01, *** p < 0.001, **** p < 0.0001.

- Submitted by
- Invitrogen Antibodies (provider)
- Main image

- Experimental details
- Figure 1. Patients with Parkinson's disease (PD) and mice with experimental PD exhibit decreased regulatory T (Treg) and increased T helper 1 (Th1) cell numbers in the blood. Treg cells were defined as CD3+CD4+CD25+FoxP3+ cells, whereas Th1 cells were identified as CD3+CD4+T-bet+ cells. (a) Representative plots of Treg and Th1 cells in patients with PD and healthy volunteers (HVs). (b) Representative plots of Treg and Th1 cells in control mice (Saline) and 1-methyl-4-phenyl-1,2,3,6-tetrahydropyridine (MPTP)-treated mice. (c) Patients with PD exhibited lower Treg cell levels and greater Th1 cell levels in the blood than HVs. n = 20. ****, p < 0.0001 by a two-tailed Student's t tests. (d) MPTP-induced experimental PD mice had fewer Treg and more Th1 cells in the circulation than saline-treated mice. n = 9/group in each experiment performed in triplicate. ***, p < 0.001; ****, p < 0.0001, according to Student's t test.

- Submitted by
- Invitrogen Antibodies (provider)
- Main image
- Experimental details
- Figure 4 Surface marker expression and cytokine secretion levels minimally perturbed with Cas9 and uVS . ( A ) CD25, and ( B ) PD-1 expression levels were quantified in cells transfected with uVS or electroporation. Surface marker expression levels were measured in the total live cell and TRAC-1 KO live population via flow cytometry at Days 1, 4, 7, 10 and 14 post-transfection. ( C ) ELISA quantification of IFNgamma supernatant levels in transfected and non-transfected cells at Day 1, 4, 7, and 10 post-transfection. Non-targeting gRNA as a Cas9-RNP complex served as a non-editing control. Cells mixed with P3 buffer (EP--non-transfection) or Opti-MEM buffer ( uVS --non-transfection) that were not transfected served as non-transfection controls for electroporation and uVS samples, respectively. Data represent mean +- SD of n = 3 samples per condition. *P < 0.05, **P < 0.01 by unpaired, two-tailed, heteroscedastic t tests. Figure generated using Adobe Illustrator Creative Cloud (adobe.com/products/illustrator.html) and GraphPad Prism 9 (graphpad.com/scientific-software/prism/).

- Submitted by
- Invitrogen Antibodies (provider)
- Main image

- Experimental details
- Figure 1. The percentage of T helper 17 (Th17) and regulatory T (Treg) cells in peripheral blood mononuclear cells (PBMCs) and the Th17/Treg ratio varies in patients with a successful pregnancy after immunotherapy. The percentage of Th17 and Treg cells in PBMCs were detected by flow cytometry in patients with unexplained recurrent spontaneous abortion (URSA) before and after therapy. Representative CD3 + CD8 + IL-17A + flow cytometry plots from patients with URSA are shown (A) before and (B) after therapy. Representative CD4 + CD25 + Foxp3 + flow cytometry plots from patients with URSA are shown (C) before and (D) after therapy. (E) The percentage of Th17 cells in PBMCs significantly decreased after therapy. The percentage of Treg cells in PBMCs significantly increased after therapy (*P

- Submitted by
- Invitrogen Antibodies (provider)
- Main image
- Experimental details
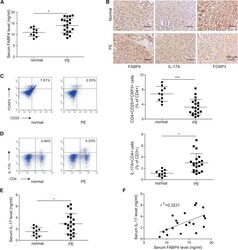
- Figure 1 Elevation of FABP4 is accompanied with Treg/Th17 imbalance in PE (A) The serum level of FABP4 was determined by ELISA (normal pregnant women, n = 10; PE, n = 20). (B) The immunoreactivities of FABP4, IL-17A, and FOXP3 in placental tissues were monitored by IHC analysis. (C and D) The percentages of Treg (C) and Th17 cells (D) in peripheral blood were assessed by FACS (normal pregnant women, n = 10; PE, n = 20). (E) The serum level of IL-17A was determined by ELISA (normal pregnant women, n = 10; PE, n = 20). (F) Pearson's correlation analysis between IL-17A and FABP4 expression. Data were representative images. *p < 0.05.

- Submitted by
- Invitrogen Antibodies (provider)
- Main image

- Experimental details
- Figure 1. Serum sFGL2 levels and circulating Tregs frequencies are decreased in patients with IHF. (A) Serum sFGL2 levels were analyzed by ELISA. (B) The frequency of Tregs was compared in each group. (C) Representative FSC/SSC pseudo-color density image shows the gated CD4 + T cells and representative fluorescence-activated cell sorting plots of CD4 + CD25 + Foxp3 + Tregs from a single patient in each group. ***P

- Submitted by
- Invitrogen Antibodies (provider)
- Main image

- Experimental details
- Figure 2. Serum sFGL2 levels and circulating Tregs frequencies are decreased with the elevation of NYHA classification. (A) sFGL2 levels were analyzed by ELISA. (B) The proportion of Tregs was compared in each subgroup. (C) Representative fluorescence-activated cell sorting plots of CD4 + CD25 + Foxp3 + Tregs from a single person in each subgroup. **P

- Submitted by
- Invitrogen Antibodies (provider)
- Main image

- Experimental details
- Figure 3. Serum sFGL2 levels and circulating Tregs frequencies are decreased with the reduction of LVEF. (A) sFGL2 levels were analyzed by ELISA. (B) The proportion of Tregs was compared in each subgroup. (C) Representative fluorescence-activated cell sorting plots of CD4 + CD25 + Foxp3 + Tregs from a single person in each subgroup. *P

- Submitted by
- Invitrogen Antibodies (provider)
- Main image

- Experimental details
- Figure 2 Tregs' frequency and the ratio of effector T cells/Tregs in PBMCs of patients and HC. (A) PBMCs were stained with CD4, CD25 and CD127 mAbs. CD4 + T cells were gated according to CD4 staining and SSC and the proportion of CD4 + CD25 + CD127 - Tregs in CD4 + T cells were determined. The graphs are representative for patients, indicated subgroups and HC. Mean value of Tregs' percentage is shown in each target quadrant. (B-E) Statistical graphs for comparing Tregs' percentage and Th/Tregs ratios of the whole patients and indicated subgroups with HC. (SP, n = 46; SD, n = 20; LD, n = 26, FF, n = 30; LF, n = 16; HC, n = 25). Error bars represent mean+-SD. ** P < 0.01, * P < 0.05, and NS P >= 0.05.

- Submitted by
- Invitrogen Antibodies (provider)
- Main image

- Experimental details
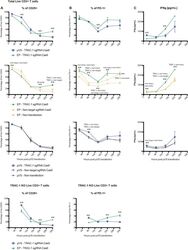
- Figure 3 hEND-CD3/BiTE activates T cells, stimulates T-cell proliferation, and increases secretion of Th1 cytokines. (A) PBMCs were co-cultured with 293T (grey signal) or 293T-hE (pink signal) cells in the presence of hEND-CD3/BiTE. The expression of T-cell activation markers CD69 (left panels) and CD25 (right panels) was detected in CD4 + (upper rows) and CD8 + (lower rows) by flow cytometry. (B) Proliferation of CFSE-labeled T cells in response to hEND-CD3/BiTE and other indicated reagents in the solid phase was measured using flow cytometry. The proliferation index was calculated using the ModFit LT software. (C) Supernatants were collected from the co-cultures of PBMCs with 293T (white bar) or 293T-hE cells (purple bar) in the presence of hEND-CD3/BiTE. The secretion of Th1 cytokines, including IFN-gamma, and TNF-alpha, and Th2 cytokine IL10 was measured using ELISA assays. * P < 0.001.

- Submitted by
- Invitrogen Antibodies (provider)
- Main image

- Experimental details
- 10.7554/eLife.44360.007 Figure 3. Lower proliferative responses and CCR2 and CCR5 cell surface levels in activated CD4 +T cells from ECr/VCrs. ( A ) Reduced CD69, but not CD25 levels in activated CD4 +T cells from ECr/VCrs. Graph shows representative data N = 13 (Ctrl), n = 9 (EC/VC) and n = 21 (ECr/VCr). ( B ) Comparable frequencies of naive CD45RA + and memory CD45RO + T cells after anti-CD3/CD28 activation between groups (n = 2 per group). ( C ) CCR5 and CCR2 cell surface levels measured by flow cytometry are reduced in freshly thawed (NS, non-stimulated) and activated CD4 +T cells (anti-CD3/28) from ECr/VCr. ( D ) Percentages of CCR5 +in effector memory (EM) and central memory (CM) compartments of activated CD4 +T cells (n = 2 per group). ( E ) Reduced CCR2 and CCR5 cell surface levels, expressed as MFI, in activated (anti-CD3/28) CD4 +T cells from ECr/VCr. Data in D-E shown pooled results from different experiments with n = 10 (Ctrl and EC/VC) and n = 19 (ECr/VCr). ( F ) Positive correlation between CCR2 and CCR5 cell surface levels. ( G ) Positive correlation observed between ccr2/ccr5 RNA levels and cell surface expression. Values obtained using the non-parametric Spearman correlation test. *p

- Submitted by
- Invitrogen Antibodies (provider)
- Main image

- Experimental details
- 10.1371/journal.pone.0244771.g004 Fig 4 Celastrol does not activate resting CD4+ T cells. Resting CD4 + T cells were isolated from three healthy donors and treated with 400 nM celastrol, 200 nM JQ1, 400 nM vorinostat, 20 nM romidepsin, or 0.2 ng/ml bryostatin for 24 hours. Expression of CD25 and CD69 was quantified by flow cytometry.

- Submitted by
- Invitrogen Antibodies (provider)
- Main image

- Experimental details
- Fig. 3 Flow cytometric analysis of CD4 + CD25 + FOXP3 + cells. ( A ) Lymphocytes are gated in forward light scatter (FS) vs. side light scatter (SS) dot plot, then ( B ) CD3+ cells gated in CD3- E610 vs. SS, followed by ( C ) CD4+ gating in CD3- E610 vs. CD4- FITC. ( D ) CD4+ cells gated are plotted CD25-PC5 vs. FoxP3-PE for assessing CD4+CD25+FoxP3+ (C2) cell expression.

- Submitted by
- Invitrogen Antibodies (provider)
- Main image

- Experimental details
- FIGURE 6 The effect of rotenone on subpopulations of Peyer's patches lymphocytes in halpha-syn +/- mice. Flow cytometry was used to detect the changes in lymphocyte subsets, namely, CD4 + , CD8 + , and CD4 + CD25 + lymphocytes, respectively, in Peyer's patches in mice of different ages. (A) Changes of lymphocyte subsets in Peyer's patches of 6-month-old halpha-syn +/- mice by flow cytometry, n = 6. (B) Statistics of the number of cells in Peyer's patches of 6-month-old halpha-syn +/- mice. (C) Changes of lymphocyte subsets in Peyer's patches of 12-month-old halpha-syn +/- mice by flow cytometry, n = 6. (D) Statistics of the number of cells in Peyer's patches of 12-month-old halpha-syn +/- mice.

- Submitted by
- Invitrogen Antibodies (provider)
- Main image

- Experimental details
- LBS effect on immune cells profile. Fluorescent-activated cell sorting (FACS) analysis was used to compare frequencies of (A-D) CD4 + IL-10 + T cells, CD39 + CD127 low CD25 high T cells, CD4 + LAP + T cells, and effector memory CD8 T cells in healthy controls (HC) and multiple sclerosis patients (MS) at the indicated time points determined by Wilcoxon signed-rank test. * p < 0.05; # p < 0.1. FACS analysis was used to compare (E,F) frequencies of intermediate monocytes, inflammatory monocytes, as well as CD80 mean fluorescence intensity (MFI) on classical monocytes and HLA-DR MFI on dendritic cells in HC and MS patients at the indicated time points determined by Wilcoxon signed-rank test, * p < 0.05; ** p < 0.01; # p < 0.1. The following markers were used for the lineage pool: CD3, CD14, CD16, CD19, CD20, and CD56. HLA-DR = human leukocyte antigen D related.

- Submitted by
- Invitrogen Antibodies (provider)
- Main image

- Experimental details
- FIGURE 5 Effects of disruption of PD-1 on cytotoxicity, cytokines production, and phenotype of GPC3-CAR T cells in vitro . (A) Cytotoxic activities of UTD and GPC3-CAR T cells with intact or deficient PD-1 against GPC3-positive (PLC/PRF/5 and SK-HEP-1/GPC3) and GPC3-negative (SK-HEP-1) HCC cells at an effector:target ratio of 1:1. (B,C) The production of IL-2 (B) and IFN-gamma (C) by the UTD and GPC3-CAR T cells with intact or deficient PD-1 cocultured with GPC3-positive (PLC/PRF/5 and SK-HEP-1/GPC3) or GPC3-negative (SK-HEP-1) HCC cells at an effector:target ratio of 1:1. (D) CD4 and CD8 subsets constitution of wild-type and PD-1-deficient GPC3-CAR T cells. The expressions of CD4 and CD8 on CAR T cells were measured by flow cytometry. (E) The expressions of early (CD69), and intermediate or late (CD25) activation markers on cell surface of wild-type and PD-1-deficient GPC3-CAR T cells. The expressions of CD25 and CD69 were determined by flow cytometry. Data shown were mean +- SD from triplicates. Bars, SD. * P < 0.05, ** P < 0.01, and *** P < 0.001 by one way ANOVA with Turkey post hoc test.

- Submitted by
- Invitrogen Antibodies (provider)
- Main image

- Experimental details
- Figure 6. 1,25D-dependent PD-L1 increase in epithelial cells results in reduction of activation of co-cultured CD4 + and CD8 + T cell populations. Flow cytometry of T cells co-cultured with 1,25D-pretreated SCC25 cells and stained for CD8 ( A-C ), CD4 ( D-F ), and the activation markers CD25 ( A and D ), CD71 ( B and E ), and CD69 ( C and F ). p values were calculated for treated (vitamin D, 1,25D) versus control (vehicle) in IgG and alphaPD-L1 groups separately and for control (IgG) versus control (PD-L1). Shown is vitamin D pretreatment for 24 h with 100 n m 1,25D ( n = 3); ns > 0.05 >= *. Error bars , S.D.

- Submitted by
- Invitrogen Antibodies (provider)
- Main image

- Experimental details
- Figure 2 T-lymphocyte subset distribution in glaucoma. Mononuclear cells isolated from peripheral blood samples from glaucoma (n = 32) and control (n = 21) groups were analyzed by multicolor flow cytometry for T-cell subset markers. (A) The percentage of CD4+/CD25+/FoxP3+ Tregs (CD4-Tregs) within the entire CD4+ T-cell population was significantly lower in glaucomatous samples than nonglaucomatous controls (ANOVA, P < 0.001). (B, C) The Treg to Th1 or Treg to Th17 ratios were also significantly lower in the glaucoma group than control (ANOVA, P < 0.001). Bars on univariate scatterplots represent the group mean. (D) Shown are representative flow cytometry images after CD4/CD25/FoxP3 immunostaining for Tregs.

- Submitted by
- Invitrogen Antibodies (provider)
- Main image

- Experimental details
- Figure 3 T-lymphocyte subset distribution in glaucoma. Mononuclear cells isolated from peripheral blood samples from glaucoma (n = 32) and control (n = 21) groups were analyzed by multicolor flow cytometry for T-cell subset markers. (A) Similar to CD4+ Tregs, the percentage of CD8+/CD25+/FoxP3+ Tregs (CD8-Tregs) was also significantly lower in glaucomatous samples than nonglaucomatous controls (ANOVA, P < 0.001). (B) Shown are representative flow cytometry images after CD8/CD25/FoxP3 immunostaining for Tregs.
