 Explore
 Validate
 Learn
Learn Flow cytometry
Antibody data
- Antibody Data
- Antigen structure
- References [8]
- Comments [0]
- Validations
- Flow cytometry [1]
- Other assay [9]
Submit
Validation data
Reference
Comment
Report error
- Product number
- 25-0257-42 - Provider product page

- Provider
- Invitrogen Antibodies
- Product name
- CD25 Monoclonal Antibody (CD25-4E3), PE-Cyanine7, eBioscience™
- Antibody type
- Monoclonal
- Antigen
- Other
- Description
- Description: This CD25-4E3 monoclonal antibody reacts to human CD25, which is also known as the low-affinity interleukin (IL)-2 receptor alpha. CD25 is expressed on activated T cells (including a subset of regulatory T cells), B cells, and macrophages. This receptor subunit associates with CD122, the IL-2 receptor beta chain, and CD132, the common gamma chain, to form the high-affinity IL-2 receptor. IL-2 receptor signaling has been linked to cell proliferation and survival in lymphocytes. CD25 is a marker for Hodgkin's disease, and has been associated with such autoimmune diseases as Type I diabetes. This monoclonal antibody is cross-reactive to rhesus monkey. Applications Reported: This CD25-4E3 antibody has been reported for use in flow cytometric analysis. Applications Tested: This CD25-4E3 antibody has been pre-titrated and tested by flow cytometric analysis of normal human peripheral blood cells. This can be used at 5 µL (0.125 µg) per test. A test is defined as the amount (µg) of antibody that will stain a cell sample in a final volume of 100 µL. Cell number should be determined empirically but can range from 10^5 to 10^8 cells/test. Light sensitivity: This tandem dye is sensitive photo-induced oxidation. Please protect this vial and stained samples from light. Fixation: Samples can be stored in IC Fixation Buffer (Product # 00-8222) (100 µL cell sample + 100 µL IC Fixation Buffer) or 1-step Fix/Lyse Solution (Product # 00-5333) for up to 3 days in the dark at 4°C with minimal impact on brightness and FRET efficiency/compensation. Some generalizations regarding fluorophore performance after fixation can be made, but clone specific performance should be determined empirically. Excitation: 488-561 nm; Emission: 775 nm; Laser: Blue Laser, Green Laser, Yellow-Green Laser. Filtration: 0.2 µm post-manufacturing filtered.
- Reactivity
- Human
- Host
- Mouse
- Isotype
- IgG
- Antibody clone number
- CD25-4E3
- Vial size
- 100 Tests
- Concentration
- 5 µL/Test
- Storage
- 4° C, store in dark, DO NOT FREEZE!
Submitted references Increased TNF-α Initiates Cytoplasmic Vacuolization in Whole Blood Coculture with Dengue Virus.
Remote Limb Ischemic Postconditioning Protects Against Ischemic Stroke by Promoting Regulatory T Cells Thriving.
Murlentamab, a Low Fucosylated Anti-Müllerian Hormone Type II Receptor (AMHRII) Antibody, Exhibits Anti-Tumor Activity through Tumor-Associated Macrophage Reprogrammation and T Cell Activation.
HDAC Inhibitor, CG-745, Enhances the Anti-Cancer Effect of Anti-PD-1 Immune Checkpoint Inhibitor by Modulation of the Immune Microenvironment.
Single residue in CD28-costimulated CAR-T cells limits long-term persistence and antitumor durability.
Tumor specific regulatory T cells in the bone marrow of breast cancer patients selectively upregulate the emigration receptor S1P1.
HDAC inhibition potentiates immunotherapy in triple negative breast cancer.
HLA Class II tetramers reveal tissue-specific regulatory T cells that suppress T-cell responses in breast carcinoma patients.
Satria RD, Huang TW, Jhan MK, Shen TJ, Tseng PC, Wang YT, Yang ZY, Hsing CH, Lin CF
Journal of immunology research 2021;2021:6654617
Journal of immunology research 2021;2021:6654617
Remote Limb Ischemic Postconditioning Protects Against Ischemic Stroke by Promoting Regulatory T Cells Thriving.
Yu HH, Ma XT, Ma X, Chen M, Chu YH, Wu LJ, Wang W, Qin C, Tian DS
Journal of the American Heart Association 2021 Nov 16;10(22):e023077
Journal of the American Heart Association 2021 Nov 16;10(22):e023077
Murlentamab, a Low Fucosylated Anti-Müllerian Hormone Type II Receptor (AMHRII) Antibody, Exhibits Anti-Tumor Activity through Tumor-Associated Macrophage Reprogrammation and T Cell Activation.
Prat M, Salon M, Allain T, Dubreuil O, Noël G, Preisser L, Jean B, Cassard L, Lemée F, Tabah-Fish I, Pipy B, Jeannin P, Prost JF, Barret JM, Coste A
Cancers 2021 Apr 13;13(8)
Cancers 2021 Apr 13;13(8)
HDAC Inhibitor, CG-745, Enhances the Anti-Cancer Effect of Anti-PD-1 Immune Checkpoint Inhibitor by Modulation of the Immune Microenvironment.
Kim YD, Park SM, Ha HC, Lee AR, Won H, Cha H, Cho S, Cho JM
Journal of Cancer 2020;11(14):4059-4072
Journal of Cancer 2020;11(14):4059-4072
Single residue in CD28-costimulated CAR-T cells limits long-term persistence and antitumor durability.
Guedan S, Madar A, Casado-Medrano V, Shaw C, Wing A, Liu F, Young RM, June CH, Posey AD Jr
The Journal of clinical investigation 2020 Jun 1;130(6):3087-3097
The Journal of clinical investigation 2020 Jun 1;130(6):3087-3097
Tumor specific regulatory T cells in the bone marrow of breast cancer patients selectively upregulate the emigration receptor S1P1.
Rathinasamy A, Domschke C, Ge Y, Böhm HH, Dettling S, Jansen D, Lasitschka F, Umansky L, Gräler MH, Hartmann J, Herold-Mende C, Schuetz F, Beckhove P
Cancer immunology, immunotherapy : CII 2017 May;66(5):593-603
Cancer immunology, immunotherapy : CII 2017 May;66(5):593-603
HDAC inhibition potentiates immunotherapy in triple negative breast cancer.
Terranova-Barberio M, Thomas S, Ali N, Pawlowska N, Park J, Krings G, Rosenblum MD, Budillon A, Munster PN
Oncotarget 2017 Dec 26;8(69):114156-114172
Oncotarget 2017 Dec 26;8(69):114156-114172
HLA Class II tetramers reveal tissue-specific regulatory T cells that suppress T-cell responses in breast carcinoma patients.
Schmidt HH, Ge Y, Hartmann FJ, Conrad H, Klug F, Nittel S, Bernhard H, Domschke C, Schuetz F, Sohn C, Beckhove P
Oncoimmunology 2013 Jun 1;2(6):e24962
Oncoimmunology 2013 Jun 1;2(6):e24962
No comments: Submit comment
Supportive validation
- Submitted by
- Invitrogen Antibodies (provider)
- Main image

- Experimental details
- Staining of unstimulated (left) or overnight PHA-stimulated (right) normal human peripheral blood cells with Anti-Human CD4 FITC (Product # 11-0047-42) and Anti-Human/Non-Human Primate CD25 PE-Cyanine7. Cells in the lymphocyte gate were used for analysis. Quadrant lines are based on staining with Mouse IgG2b K Isotype Control PE-Cyanine7 (Product # 25-4732-81).

Supportive validation
- Submitted by
- Invitrogen Antibodies (provider)
- Main image
- Experimental details
- NULL

- Submitted by
- Invitrogen Antibodies (provider)
- Main image

- Experimental details
- Fig. 1 Decreased frequencies of Treg subpopulations in the BM of breast cancer patients. a Representative plot of a healthy donor showing the CD4+ T-cell gating strategy. b-c CD4+ cells were analyzed for FoxP3 and CD25 expression. CD25+ FoxP3+ cells were gated as Treg, and CD25- FoxP3- cells were gated as Tcon. Representative plots illustrating Treg frequencies in BM and PB of a healthy donor ( b ) and a breast cancer patient ( c ). Red circle and square represents the CD4 gate and CD25+ FoxP3+ Treg gate, respectively. d Cumulative data of CD25+ FoxP3+ Treg frequencies in PB and BM of all patients and healthy donors analyzed--Healthy donor PB ( n = 7) and BM ( n = 8), patients with matched PB and BM samples ( n = 50). Data distribution in 1 d is represented by mean with SEM. For healthy donors unpaired t test and for patient samples, paired t test was used for statistical analysis. Epigenetic PCR was performed on DNA isolated from tumor areas from FFPE sections obtained from 42 patients. Samples that passed quality control [Treg ( n = 33) and CD3 ( n = 40)] were taken into analysis. e, f Treg and CD3 T-cell percentage ( e ) and counts per mm 3 volume of tumor ( f ). Data distribution is represented by median with interquartile range in e and f. g Graph bridging data of Treg frequencies in BM, PB, and tumor--ratio of Treg in BM to PB correlated to ratio of Treg in tumor to PB [for all patients with Treg frequencies >4.6% in PB ( n = 18)]. Non-parametric Spearman Correlation wa

- Submitted by
- Invitrogen Antibodies (provider)
- Main image

- Experimental details
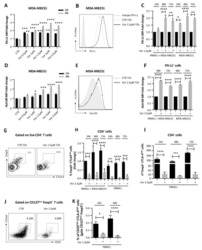
- Figure 4 Murlentamab opsonization of SKOV3-R2 + activates an effective anti-tumor T cell immune response. SKOV3-R2 + ovarian tumor cells were labeled with different 3C23K antibodies (3C23K-FcKO control, 3C23K-CHO normally fucosylated or murlentamab the low fucosylated form) and cultured in the presence of human monocyte-derived macrophages from healthy donors unstimulated (M0) or stimulated with M-CSF and IL-10 (TAMs). After 3 days of co-culture, activated T cells coming from the same healthy donor were added in the culture well for 4 more days. ( A ) The CD4 + Th1/Th2 polarization profile, ( B ) the proportion of CD3 + CD4 + CD25 + regulatory T cells and ( C ) the activation of T CD8 + cells were determined by flow cytometry after four days of co-culture. Data shown (boxplots) are the results from two different experiments (performed with two different healthy donors). * p < 0.05; ** p < 0.01; *** p < 0.001. p values were determined using one-way ANOVA analysis followed by Tukey''s multiple comparisons test.

- Submitted by
- Invitrogen Antibodies (provider)
- Main image

- Experimental details
- Figure 3. Tetramer staining of conventional and regulatory T cells from breast cancer patients. ( A-G ) Peripheral blood mononuclear cells (PBMCs) of a breast cancer patient were analyzed, upon gating on living CD3 + CD4 + T cells. The patient sample was stained with tetramers presenting either mam 34-48 ( B ) or the CLIP peptide ( C ). Numbers indicate the percentage of cells in the respective gate, referring to lymphocytes ( A ) or CD3 + CD4 + T cells ( B ) and ( C ). Within CD3 + CD4 + T cells, regulatory T cells (Tregs) were identified as CD25 high CD127 low ( D ) and ( G ) and CD25 high CD127 low FOXP3 + ( E ), ( F ) and ( H ). ( G ) reports the percentage of Tregs within tetramer-positive cells in a representative patient. ( I ) Frequency of mam 34-48 - and CLIP-presenting tetramer-positive cells among CD3 + CD4 + T cells of breast cancer patients and healthy donors (HD) (p values as per Mann-Whitney U tests are indicated). ( J and K ) Frequency of mam 34-48 -specific Tcon ( J ) cells and Tregs ( K ) of breast cancer patients and HDs.

- Submitted by
- Invitrogen Antibodies (provider)
- Main image

- Experimental details
- Figure 4 Immune profiling in DENV-treated whole blood cells 24 h postincubation. Following DENV (MOI = 1) coculture in 100 mu l of WB ex vivo for 24 h, (a) representative flow cytometric analysis and gating of various cells obtained from five cases, performed by staining for specific cell surface markers (CD4, CD8, CD11c, CD14, CD16, CD19, CD25, CD56, CD62L, and HLA-DR), in the DENV-infected and mock groups showed (b) the changes in the expression of specific immune cell populations as noted. (c) The results are shown as a percentage of the mean +- SD obtained from five cases. * p < 0.05, ** p < 0.01, and *** p < 0.001, compared to the mock group. R: region; WBC: white blood cell; bri: bright.

- Submitted by
- Invitrogen Antibodies (provider)
- Main image

- Experimental details
- Figure 2 RLIPoC increases Tregs abundance in the blood, spleen, and brain. A , Representative flow cytometry plots of CD4 + CD25 + Foxp3 + Tregs in the blood and spleen on day 1, 3, and 7 after MCAO. B , Quantification of percentages of CD25 + Foxp3 + Tregs among CD4 + T cells in the blood and spleen. Student t test, * P

- Submitted by
- Invitrogen Antibodies (provider)
- Main image

- Experimental details
- Figure 3 RLIPoC facilitated Tregs increase via modifying metabolic spectrum. A , Images of blood flow (top) and curves of the dynamic concentration changes of metabolites (FAD, Cytaa3-R, and Cytc-R) in the region of the hind limb underwent RLIPoC in vivo, which was monitored using a multispectral optical imaging system. O indicates occlusion of the bilateral femoral arteries; and R, reperfusion of the bilateral femoral arteries. B , Concentrations of NAD + and NADH, and the ratio of NAD + to NADH, in muscle that underwent RLIPoC. Student t test, * P

- Submitted by
- Invitrogen Antibodies (provider)
- Main image

- Experimental details
- Figure 4 Depletion of Tregs in vivo abolished neuroprotection conferred by RLIPoC. A , Scheme for ablation of Tregs in DEREG mice (left) and purified Tregs transferring to recipient mice (right). Diphtheria toxin (DT; intraperitoneal, 50 ug/kg body weight) was administered 2 days before the MCAO model and was administered again with a dose of 10 ug/kg body weight every other day until the mouse was euthanized. Purified CD4 + CD25 + Tregs were transferred intravenously to recipient mice within 1 hour after the MCAO model, with a dose of 1 million per mouse through the tail vein. B , The efficacy of Tregs ablation in DEREG mice using DT. Representative flow cytometry plots and the quantitation of percentages of CD25 + Foxp3 + Tregs among CD4 + T cells in the blood and spleen are shown in the histogram. Student t test, * P

- Submitted by
- Invitrogen Antibodies (provider)
- Main image

- Experimental details
- Figure 3 CG-745 increases helper T cells, cytotoxic T cells and natural killer T cells, and decreases Treg: (A) hPBMCs were incubated with CG (CG-745) for 36 hours and a subset of hPBMCs was analyzed using the antibodies indicated in the text; (B) hPBMCs were co-cultured with Huh7, Hep3B, HepG2 or PLC/PRF/5 cells for 36 hours with or without CG, and a subset of hPBMCs was analyzed by Attune Nxt (Invitrogen, USA).
