 Explore
 Validate
 Learn
Learn Flow cytometry
Antibody data
- Antibody Data
- Antigen structure
- References [18]
- Comments [0]
- Validations
- Flow cytometry [2]
- Other assay [21]
Submit
Validation data
Reference
Comment
Report error
- Product number
- 47-0271-82 - Provider product page

- Provider
- Invitrogen Antibodies
- Product name
- CD27 Monoclonal Antibody (LG.7F9), APC-eFluor™ 780, eBioscience™
- Antibody type
- Monoclonal
- Antigen
- Other
- Description
- Description: The LG.7F9 monoclonal antibody reacts with mouse CD27, a lymphocyte-specific member of the TNFR superfamily. CD27 is expressed by virtually all mature T cells and by a subpopulation of B cells, mainly memory B cells. In mouse, CD27 has been found on nearly all thymocytes excluding a population of CD46-CD8- precursors. CD27 binds to CD70 and, through this interaction, plays an important role in T cell-B cell interaction. It has been reported that triggering CD27 plays an important role in the maturation of CD4+ and CD8+ effector cells. LG.7F9 cross-reacts with human and rat CD27. Applications Reported: This LG.7F9 antibody has been reported for use in flow cytometric analysis. Applications Tested: This LG.7F9 antibody has been tested by flow cytometric analysis of mouse splenocytes. This can be used at less than or equal to 0.25 µg per test. A test is defined as the amount (µg) of antibody that will stain a cell sample in a final volume of 100 µL. Cell number should be determined empirically but can range from 10^5 to 10^8 cells/test. It is recommended that the antibody be carefully titrated for optimal performance in the assay of interest. APC-eFluor 780 emits at 780 nm and is excited with the Red laser (633 nm). Please make sure that your instrument is capable of detecting this fluorochome. Light sensitivity: This tandem is sensitive to photo-induced oxidation. Please protect this vial and stained samples from light. Fixation: Samples can be stored in IC Fixation Buffer (Product # 00-8222) (100 µL cell sample + 100 µL IC Fixation Buffer) or 1-step Fix/Lyse Solution (Product # 00-5333) for up to 3 days in the dark at 4°C with minimal impact on brightness and FRET efficiency/compensation. Some generalizations regarding fluorophore performance after fixation can be made, but clone specific performance should be determined empirically. Excitation: 633-647 nm; Emission: 780 nm; Laser: Red Laser. Filtration: 0.2 µm post-manufacturing filtered.
- Reactivity
- Human, Mouse, Rat
- Isotype
- IgG
- Antibody clone number
- LG.7F9
- Vial size
- 100 μg
- Concentration
- 0.2 mg/mL
- Storage
- 4°C, store in dark, DO NOT FREEZE!
Submitted references PI3Kδ coordinates transcriptional, chromatin, and metabolic changes to promote effector CD8(+) T cells at the expense of central memory.
Effect of Subcutaneous Anti-CD20 Antibody-Mediated B Cell Depletion on Susceptibility to Pneumocystis Infection in Mice.
Development of a VRC01-class germline targeting immunogen derived from anti-idiotypic antibodies.
Immune cell phenotypes associated with disease severity and long-term neutralizing antibody titers after natural dengue virus infection.
Ontogenic timing, T cell receptor signal strength, and Notch signaling direct γδ T cell functional differentiation in vivo.
The transcriptional repressor ID2 supports natural killer cell maturation by controlling TCF1 amplitude.
Th2 Biased Immunity With Altered B Cell Profiles in Circulation of Patients With Sporotrichosis Caused by Sporothrix globosa.
Hhex Directly Represses BIM-Dependent Apoptosis to Promote NK Cell Development and Maintenance.
Stabilization of cytokine mRNAs in iNKT cells requires the serine-threonine kinase IRE1alpha.
Differentiation and Protective Capacity of Virus-Specific CD8(+) T Cells Suggest Murine Norovirus Persistence in an Immune-Privileged Enteric Niche.
Single-cell tracking of flavivirus RNA uncovers species-specific interactions with the immune system dictating disease outcome.
Type III Interferon-Mediated Signaling Is Critical for Controlling Live Attenuated Yellow Fever Virus Infection In Vivo.
The breast tumor microenvironment alters the phenotype and function of natural killer cells.
NK cell development requires Tsc1-dependent negative regulation of IL-15-triggered mTORC1 activation.
CD24(hi)CD27⁺ and plasmablast-like regulatory B cells in human chronic graft-versus-host disease.
PD-1+Tim-3+ CD8+ T Lymphocytes Display Varied Degrees of Functional Exhaustion in Patients with Regionally Metastatic Differentiated Thyroid Cancer.
Production of IL-10 by CD4(+) regulatory T cells during the resolution of infection promotes the maturation of memory CD8(+) T cells.
Characterization of murine CD70, the ligand of the TNF receptor family member CD27.
Cannons JL, Villarino AV, Kapnick SM, Preite S, Shih HY, Gomez-Rodriguez J, Kaul Z, Shibata H, Reilley JM, Huang B, Handon R, McBain IT, Gossa S, Wu T, Su HC, McGavern DB, O'Shea JJ, McGuire PJ, Uzel G, Schwartzberg PL
Cell reports 2021 Oct 12;37(2):109804
Cell reports 2021 Oct 12;37(2):109804
Effect of Subcutaneous Anti-CD20 Antibody-Mediated B Cell Depletion on Susceptibility to Pneumocystis Infection in Mice.
Dai G, Noell K, Weckbecker G, Kolls JK
mSphere 2021 May 5;6(3)
mSphere 2021 May 5;6(3)
Development of a VRC01-class germline targeting immunogen derived from anti-idiotypic antibodies.
Seydoux E, Wan YH, Feng J, Wall A, Aljedani S, Homad LJ, MacCamy AJ, Weidle C, Gray MD, Brumage L, Taylor JJ, Pancera M, Stamatatos L, McGuire AT
Cell reports 2021 May 4;35(5):109084
Cell reports 2021 May 4;35(5):109084
Immune cell phenotypes associated with disease severity and long-term neutralizing antibody titers after natural dengue virus infection.
Rouers A, Chng MHY, Lee B, Rajapakse MP, Kaur K, Toh YX, Sathiakumar D, Loy T, Thein TL, Lim VWX, Singhal A, Yeo TW, Leo YS, Vora KA, Casimiro D, Lim B, Tucker-Kellogg L, Rivino L, Newell EW, Fink K
Cell reports. Medicine 2021 May 18;2(5):100278
Cell reports. Medicine 2021 May 18;2(5):100278
Ontogenic timing, T cell receptor signal strength, and Notch signaling direct γδ T cell functional differentiation in vivo.
Chen ELY, Lee CR, Thompson PK, Wiest DL, Anderson MK, Zúñiga-Pflücker JC
Cell reports 2021 Jun 8;35(10):109227
Cell reports 2021 Jun 8;35(10):109227
The transcriptional repressor ID2 supports natural killer cell maturation by controlling TCF1 amplitude.
Li ZY, Morman RE, Hegermiller E, Sun M, Bartom ET, Maienschein-Cline M, Sigvardsson M, Kee BL
The Journal of experimental medicine 2021 Jun 7;218(6)
The Journal of experimental medicine 2021 Jun 7;218(6)
Th2 Biased Immunity With Altered B Cell Profiles in Circulation of Patients With Sporotrichosis Caused by Sporothrix globosa.
Zu J, Yao L, Song Y, Cui Y, Guan M, Chen R, Zhen Y, Li S
Frontiers in immunology 2020;11:570888
Frontiers in immunology 2020;11:570888
Hhex Directly Represses BIM-Dependent Apoptosis to Promote NK Cell Development and Maintenance.
Goh W, Scheer S, Jackson JT, Hediyeh-Zadeh S, Delconte RB, Schuster IS, Andoniou CE, Rautela J, Degli-Esposti MA, Davis MJ, McCormack MP, Nutt SL, Huntington ND
Cell reports 2020 Oct 20;33(3):108285
Cell reports 2020 Oct 20;33(3):108285
Stabilization of cytokine mRNAs in iNKT cells requires the serine-threonine kinase IRE1alpha.
Govindarajan S, Gaublomme D, Van der Cruyssen R, Verheugen E, Van Gassen S, Saeys Y, Tavernier S, Iwawaki T, Bloch Y, Savvides SN, Lambrecht BN, Janssens S, Elewaut D, Drennan MB
Nature communications 2018 Dec 17;9(1):5340
Nature communications 2018 Dec 17;9(1):5340
Differentiation and Protective Capacity of Virus-Specific CD8(+) T Cells Suggest Murine Norovirus Persistence in an Immune-Privileged Enteric Niche.
Tomov VT, Palko O, Lau CW, Pattekar A, Sun Y, Tacheva R, Bengsch B, Manne S, Cosma GL, Eisenlohr LC, Nice TJ, Virgin HW, Wherry EJ
Immunity 2017 Oct 17;47(4):723-738.e5
Immunity 2017 Oct 17;47(4):723-738.e5
Single-cell tracking of flavivirus RNA uncovers species-specific interactions with the immune system dictating disease outcome.
Douam F, Hrebikova G, Albrecht YE, Sellau J, Sharon Y, Ding Q, Ploss A
Nature communications 2017 Mar 14;8:14781
Nature communications 2017 Mar 14;8:14781
Type III Interferon-Mediated Signaling Is Critical for Controlling Live Attenuated Yellow Fever Virus Infection In Vivo.
Douam F, Soto Albrecht YE, Hrebikova G, Sadimin E, Davidson C, Kotenko SV, Ploss A
mBio 2017 Aug 15;8(4)
mBio 2017 Aug 15;8(4)
The breast tumor microenvironment alters the phenotype and function of natural killer cells.
Krneta T, Gillgrass A, Chew M, Ashkar AA
Cellular & molecular immunology 2016 Sep;13(5):628-39
Cellular & molecular immunology 2016 Sep;13(5):628-39
NK cell development requires Tsc1-dependent negative regulation of IL-15-triggered mTORC1 activation.
Yang M, Chen S, Du J, He J, Wang Y, Li Z, Liu G, Peng W, Zeng X, Li D, Xu P, Guo W, Chang Z, Wang S, Tian Z, Dong Z
Nature communications 2016 Sep 7;7:12730
Nature communications 2016 Sep 7;7:12730
CD24(hi)CD27⁺ and plasmablast-like regulatory B cells in human chronic graft-versus-host disease.
de Masson A, Bouaziz JD, Le Buanec H, Robin M, O'Meara A, Parquet N, Rybojad M, Hau E, Monfort JB, Branchtein M, Michonneau D, Dessirier V, Sicre de Fontbrune F, Bergeron A, Itzykson R, Dhédin N, Bengoufa D, Peffault de Latour R, Xhaard A, Bagot M, Bensussan A, Socié G
Blood 2015 Mar 12;125(11):1830-9
Blood 2015 Mar 12;125(11):1830-9
PD-1+Tim-3+ CD8+ T Lymphocytes Display Varied Degrees of Functional Exhaustion in Patients with Regionally Metastatic Differentiated Thyroid Cancer.
Severson JJ, Serracino HS, Mateescu V, Raeburn CD, McIntyre RC Jr, Sams SB, Haugen BR, French JD
Cancer immunology research 2015 Jun;3(6):620-30
Cancer immunology research 2015 Jun;3(6):620-30
Production of IL-10 by CD4(+) regulatory T cells during the resolution of infection promotes the maturation of memory CD8(+) T cells.
Laidlaw BJ, Cui W, Amezquita RA, Gray SM, Guan T, Lu Y, Kobayashi Y, Flavell RA, Kleinstein SH, Craft J, Kaech SM
Nature immunology 2015 Aug;16(8):871-9
Nature immunology 2015 Aug;16(8):871-9
Characterization of murine CD70, the ligand of the TNF receptor family member CD27.
Tesselaar K, Gravestein LA, van Schijndel GM, Borst J, van Lier RA
Journal of immunology (Baltimore, Md. : 1950) 1997 Nov 15;159(10):4959-65
Journal of immunology (Baltimore, Md. : 1950) 1997 Nov 15;159(10):4959-65
No comments: Submit comment
Supportive validation
- Submitted by
- Invitrogen Antibodies (provider)
- Main image

- Experimental details
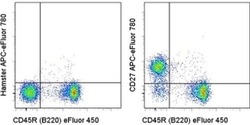
- Staining of C57Bl/6 splenocytes with Anti-Human/Mouse CD45R (B220) eFluor® 450 (Product # 48-0452-82) and 0.125 µg of Armenian Hamster IgG Isotype Control APC-eFluor® 780 (Product # 47-4888-80) (left) or 0.125 µg of Anti-CD27 APC-eFluor® 780 (right). Total viable cells were used for analysis.

- Submitted by
- Invitrogen Antibodies (provider)
- Main image
- Experimental details
- Staining of C57Bl/6 splenocytes with Anti-Human/Mouse CD45R (B220) eFluor® 450 (Product # 48-0452-82) and 0.125 µg of Armenian Hamster IgG Isotype Control APC-eFluor® 780 (Product # 47-4888-80) (left) or 0.125 µg of Anti-CD27 APC-eFluor® 780 (right). Total viable cells were used for analysis.

Supportive validation
- Submitted by
- Invitrogen Antibodies (provider)
- Main image

- Experimental details
- NULL

- Submitted by
- Invitrogen Antibodies (provider)
- Main image

- Experimental details
- NULL

- Submitted by
- Invitrogen Antibodies (provider)
- Main image

- Experimental details
- NULL

- Submitted by
- Invitrogen Antibodies (provider)
- Main image

- Experimental details
- NULL

- Submitted by
- Invitrogen Antibodies (provider)
- Main image

- Experimental details
- FIG 1 Lung CD19 + and CD27 + CD19 + cells at day 14 (A and B) and day 28 (C and D) postinfection. C57BL/6 mice were subcutaneously given 30 or 150 mug of anti-CD20 or isotype control antibody weekly. Three days after the first injection, all mice were inoculated with approximately 2 x 10 5 asci of P. murina inoculum. Fourteen or 28 days postinfection, the right upper and lower lung lobes were harvested, and single cells were prepared and stimulated with Pneumocystis (PC) antigen for 6 h followed by staining for cell surface markers and intracellular cytokine staining. For CD19 + and CD27 + CD19 + cells, 100,000 cells were acquired. One-way ANOVA and Tukey's multiple-comparison tests indicated that there were significant differences between anti-CD20 and isotype control antibody (ISO)-treated groups. Statistical significance is indicated as follows: ***, P

- Submitted by
- Invitrogen Antibodies (provider)
- Main image

- Experimental details
- FIG 6 Lung CD19 + and CD27 + CD19 + cells in secondary PC infection. All mice were inoculated with approximately 2 x 10 5 asci of P. murina inoculum. Six weeks later, the mice were subcutaneously given 30 or 150 mug of anti-CD20 or isotype control antibody weekly. Three days after the first injection, all mice were reinoculated with approximately 2 x 10 5 asci of P. murina inoculum. Fourteen days postinfection, the right upper and lower lung lobes were taken, and single cells were prepared and stimulated with PC antigen for 6 h for surface markers and intracellular cytokine staining. For both CD19 + and CD27 + CD19 + cells, 100,000 cells were acquired. One-way ANOVA and Tukey''s multiple-comparison tests indicated that there were significant differences between anti-CD20- and ISO-treated groups for CD19 + cells but not for CD27 + CD19 + cells. Statistical significance is indicated as follows: **, P

- Submitted by
- Invitrogen Antibodies (provider)
- Main image

- Experimental details
- Figure 3 Phenotypic characterization of circulating B cell subsets in patients and HC. (A) Gated by CD19 + B cells, IgD + CD27 - NB, IgD + CD27 + USM B cells, IgD - CD27 + SM B cells, and IgD - CD27 - DN B cells were identified. The graphs are representative for HC and patients with different duration. Mean value of each B cell subset's percentage is shown in the quadrants. (B) Statistical graphs for comparison of CD19 + B cells' percentages between patient groups and HC. (C-E) Statistical graphs for distinct CD19 + B cells subsets between patients (SP, n = 48; SD, n = 23; LD, n = 25; FF, n = 33; LF, n = 15.) and HC (n = 25). Error bars represent mean+-SD. * P < 0.05, ** P < 0.01, *** P < 0.001, and NS P >= 0.05.

- Submitted by
- Invitrogen Antibodies (provider)
- Main image

- Experimental details
- Figure 3. Ontogenic timing influences gammadeltaT17 generation (A) Flow cytometry analysis of CD27 expression by gammadelta T cells in lymph nodes and lung of fetal-, neonatal-, or adult-induced RBPJ ind mice (left); right panels show percentages. (B) Flow cytometry analysis of IL-17 production by gammadelta T cells in lymph nodes and lung of mice as in (A) stimulated with PMA and ionomycin in vitro (left); right panels show percentages. Data are representative of three independent experiments. Data are presented as means +- standard deviation of three independent experiments. n = 3 mice per group. **p < 0.01, ***p < 0.001, ****p < 0.0001 (one-way ANOVA). (C) Flow cytometry analysis of IL-17 production by gammadelta T cells in lung of control, fetal-, or adult-induced RBPJ ind mice after TDM challenge (top); bottom panels show percentages and numbers. Data are representative of three independent experiments. Data are presented as means +- standard deviation of three independent experiments. n = 6 mice for control; n = 3 mice per fetal- and adult-induced groups. Statistical analyses between groups are found in Figure S2D .

- Submitted by
- Invitrogen Antibodies (provider)
- Main image

- Experimental details
- Figure 2. ai-mAb-specific B cell sorting and sequencing (A) ai-mAbs fluorescently labeled with either phycoerythrin (PE) or allophycocyanin (APC) were used as bait to single-sort CD19 + CD20 + IgD + IgM + CD27 - B cells from PBMCs obtained from healthy, HIV-1-negative donors. VH and VL transcripts were recovered using RT-PCR, and amplicons were Sanger sequenced. (B and C) Frequencies of B cells expressing VH1-2 HC (B) and 5-aa CDRL3 (C) were compared between the different ai-mAbs. Frequencies in total unselected B cells were assessed as control. Data in (B) and (C) are presented as mean +- SD. All frequency data are given in Table S2 .

- Submitted by
- Invitrogen Antibodies (provider)
- Main image

- Experimental details
- Figure 6 Primary and secondary status of infection is linked to B cell/antibody readouts (A) NT 50 values of plasma collected at V1-V5 against DENV-1 (left column) or DENV-2 (right column) and for primary patients (top row, blue) or secondary patients (bottom row, red). Each set of connected dots represents 1 patient. (B) Binding of plasma antibodies from V1-V5. ELISA plates were coated with E protein (mostly monomeric, top row) or with UV-inactivated polyethylene glycol (PEG)-precipitated DENV (UV-DENV) (bottom row). E protein ELISA: line indicates the lowest dilution tested (1:500). Endpoint titers for the negative control plasma were 500. UV-DENV ELISA: line indicates the endpoint titer of the negative control plasma (2,500). Lowest dilution tested was 1:100. Primary: blue, secondary: red. Means +- SD are indicated. (C) Frequency of plasmablasts (CD27 + CD38 + ) among CD19 + B cells at V2 for primary and secondary patients. ***p = 0.0007, unpaired t test. Bars indicate the mean. (D) Frequencies of IgA + , IgM + , and IgG + (IgA - IgM - ) plasmablasts during acute disease, stratified according to hospitalization status. Bars indicate the median. (E) IgA expressed at the surface by the plasmablasts in (C); ****p < 0.0001, unpaired t test. Bars indicate the mean (F) Frequency of HLA-DR + cells among CD8 T cells at V2 in primary and secondary patients. **p = 0.002, unpaired t test. Bars indicate the mean. (G) Frequency of CXCR3 + Tfh (circle) or CXCR3 - Tfh (triangle) among CD

- Submitted by
- Invitrogen Antibodies (provider)
- Main image
- Experimental details
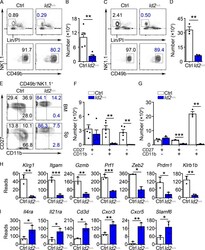
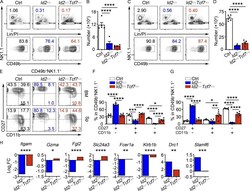
- Figure 1. Arrested NK cell maturation in Id2 Delta/Delta mice. (A) Flow cytometry showing gating strategy for BM NK cells in Ctrl and Id2 Delta/Delta mice. Top panels show lineage (Lin; CD3e)/PI versus NK1.1 on lymphoid cells in the BM. Lower panels show NK1.1 versus CD49b on Lin/PI-NK1.1 + cells. The percentage of cells in the gate is indicated. (B) Summary of the number of NK cells per 10 8 BM cells. Bar represents the average +- SEM. Ctrl (white) and Id2 Delta/Delta (blue). Each circle represents one mouse. (C) Same as A but for spleen. (D) Same as B but for spleen. (E) CD49b + NK1.1 + NK cells from the BM (top) or spleen (bottom) were examined for expression of CD27 and CD11b by flow cytometry. The percentage of cells in each quadrant is indicated. (F and G) Summary of the number of CD27 + CD11b - , CD27 + CD11b + , and CD27 - CD11b + NK cells per 10 8 BM cells or per spleen ( n = 5 for BM and n = 3 for spleen [Sp]; data are from independent experiments). (H and I) RNA expression for the indicated genes in Ctrl or Id2 Delta/Delta determined by RNA-seq and expressed as normalized reads. Data are from three biological replicates. Error bars represent SD. Statistical significance was determined by two-tailed unpaired t test. *, P < 0.05; **, P < 0.01; ***, P < 0.005.
- Submitted by
- Invitrogen Antibodies (provider)
- Main image

- Experimental details
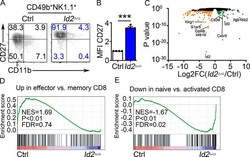
- Figure 2. Dysregulation of Tcf7 /TCF1 in Id2 Delta/Delta NK cells. (A) Tcf7 mRNA in Ctrl and Id2 Delta/Delta NK cells by RNA-seq expressed as normalized reads. Data are from three biological replicates. Error bars represent SD. (B) TCF1 in CD27 + CD11b - NK cells from BM and spleen from Ctrl and Id2 Delta/Delta mice determined by flow cytometry. The MFI of TCF1 is indicated for Ctrl (black) and Id2 Delta/Delta (blue; n = 4 for BM and n = 3 for spleen; data are from independent experiments). (C and D) Summary of relative TCF1 MFI from BM and spleen. MFI of Ctrl NK cells was set as 1 in each experiment. (E) CD49b + -enriched BM NK cells were cultured in IL-15 (20 ng/ml) for 6 d before flow cytometry analysis for TCF1 in NK1.1 + CD49b + cells. The MFI for TCF1 in Ctrl (black) and Id2 Delta/Delta (blue) is shown. (F) Summary of relative TCF1 MFI in IL-15-cultured NK cells. MFI of Ctrl NK cells was set as 1 in each experiment ( n = 4; data are from independent experiments). Error bars represent SEM (C, D, and F). (G) Chromatin accessibility surrounding the Tcf7 gene as determined by ATAC-seq on CD27 + CD11b - NK cells (). Ctrl (black) and ID2-deficient (blue) NK cells. (H) Enhanced view of the indicated region of the Tcf7 intron showing increased chromatin accessibility in ID2-deficient CD27 + CD11b - NK cells. (I) The same region as in H but showing nucleosome depletion. (J) E protein ChIP was performed on chromatin isolated from Ctrl or Id2 Delta/Delta BM NK cells and amplified

- Submitted by
- Invitrogen Antibodies (provider)
- Main image
- Experimental details
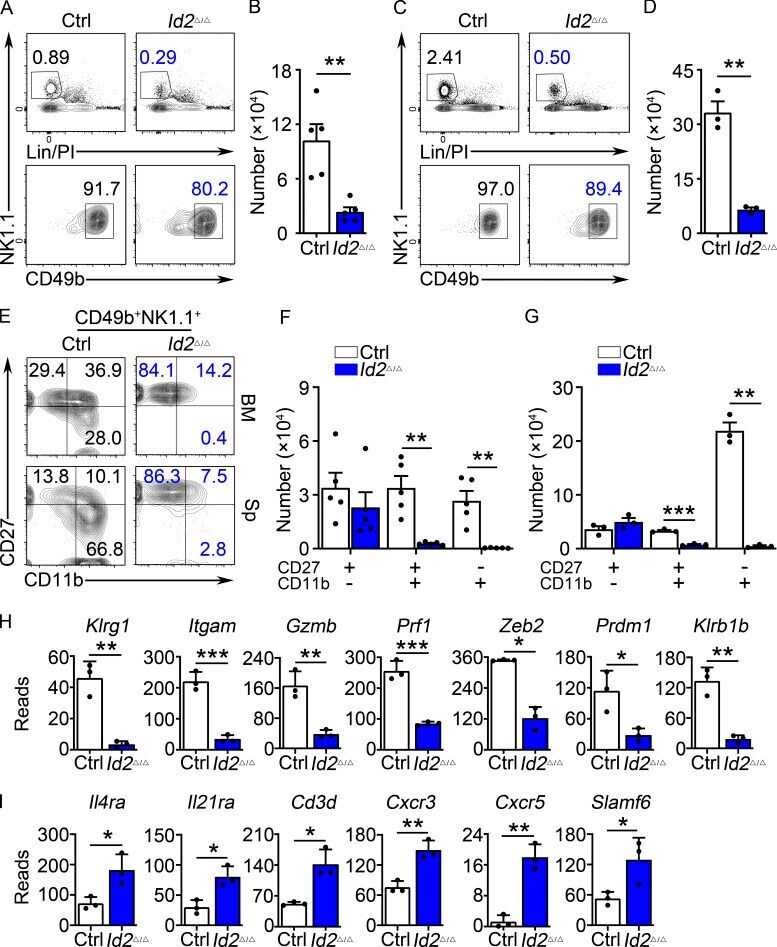
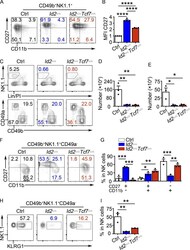
- Figure 3. Deletion of Tcf7 in mature NK cells impacts their numbers and maturation. (A) Flow cytometry for BM NK cells in Ctrl and Tcf7 Delta/Delta mice. Top panels show lineage (Lin)/PI versus NK1.1 on lymphoid cells. Bottom panels show NK1.1 versus CD49b on Lin/PI-NK1.1 + cells. The percentage of cells in the gated region is indicated. (B) Summary of the number of NK cells per 10 8 BM cells in Ctrl (white) and Tcf7 Delta/Delta (maroon). Bars represent the average +- SEM. Each circle represents one mouse ( n = 5). (C) Same as A but for spleen. (D) Same as B but for spleen ( n = 4). (E) NK1.1 + CD49b + NK cells from BM (top) or spleen (Sp; bottom) were examined for expression of CD27 and CD11b by flow cytometry. Numbers indicate the percentage of cells in the respective quadrant. (F and G) Summary of the percentage of CD27 + CD11b - , CD27 + CD11b + , and CD27 - CD11b + NK cells among CD49b + NK1.1 + NK cells in BM and in spleen ( n = 3; all flow cytometry data are from independent experiments). (H) RNA expression for the indicated genes in Ctrl or Tcf7 Delta/Delta NK cells determined by RNA-seq and expressed as normalized reads. Data represent three biological replicates. Error bars represent SD. Statistical significance was determined by two-tailed unpaired t test. *, P < 0.05; **, P < 0.01; ***, P < 0.005.

- Submitted by
- Invitrogen Antibodies (provider)
- Main image
- Experimental details
- Figure 5. TCF1 is required for the arrested maturation of Id2 Delta/Delta NK cells. (A and C) BM and spleen from Id2 Delta/Delta Tcf7 Delta/Delta , Id2 Delta/Delta , and Ctrl mice were analyzed by flow cytometry for NK cells. The top panels show lineage (Lin) + PI versus NK1.1 + on lymphoid cells, and the bottom panels show NK1.1 versus CD49b on Lin/PI - NK1.1 + NK cells. Numbers are the percentage of cells in the indicated gates ( n = 5). (B and D) Summary of data shown in A and C, respectively, for NK cell numbers per 10 8 cells. (E) CD49b + NK1.1 + NK cells from BM (top) and spleen (Sp; bottom) were analyzed by flow cytometry for CD27 and CD11b. Numbers indicate the percentage of cells in the respective quadrant ( n = 6). (F and G) Summary of data shown in E for BM (F) and spleen (G) for frequencies of different NK cell subsets. Error bars represent SEM (B, D, F, and G). Statistical significance was determined by one-way ANOVA with Tukey's multiple comparisons test (B, D, F, and G). (H) Log2FC for Id2 Delta/Delta /Ctrl or Id2 Delta/Delta Tcf7 Delta/Delta /Ctrl determined from RNA-seq. Data are from comparisons of three biological replicates. Statistical significance determined after adjustment for multiple comparisons. *, P < 0.05; **, P < 0.01; ***, P < 0.005; ****, P < 0.001.

- Submitted by
- Invitrogen Antibodies (provider)
- Main image

- Experimental details
- Figure 6. TCF1 deficiency restores NK cell surface receptor expression in Id2 Delta/Delta NK cells. (A) Flow cytometry plots of different receptors on NK cells of BM (top) and spleen (Sp; bottom) from Id2 Delta/Delta Tcf7 Delta/Delta (red), Id2 Delta/Delta (blue), and Ctrl (black) mice. Numbers are the percentage of cells in the indicated gates. Data represent three to six independent experiments ( n = 3-6 for each group). (B) Summary of data shown in A. MFI of Ctrl NK cells was set as 1 in each experiment for CD27 and IL-4Ralpha. Error bars represent SEM. Statistical significance was determined by one-way ANOVA with Tukey's multiple comparisons test. *, P < 0.05; **, P < 0.01; ***, P < 0.005; ****, P < 0.001. (C and E) BM and spleen tSNE analysis showing expression of CD27 or CD11b on Ctrl NK1.1 + CD49b + NK cells and the overlay of the two markers. Data are representative of two experiments. (D and F) BM and spleen tSNE analysis on NK1.1 + CD49b + NK cells for each of the indicated genotypes. Plots were generated using surface receptors (NK1.1, CD49b, CD27, CD11b, CD49a, KLRG1, CD146, SLAMF6, CD226, IL4Ra, and CXCR3). Data are representative of two experiments.

- Submitted by
- Invitrogen Antibodies (provider)
- Main image
- Experimental details
- Figure S1. Alterations in gene expression in Id2 Delta/Delta BM NK cells. (A) CD49b + -enriched NK cells from BM were culture in 20 ng/ml IL-15 for 6 d, and then NK1.1 + CD49b + NK cells were analyzed for CD27 and CD11b by flow cytometry. Numbers indicate the percentage of cells in the respective quadrant ( n = 4 from four independent experiments). (B) Summary of relative CD27 MFI. MFI of Ctrl NK cells was set as 1 in each experiment. Error bars represent SEM. Statistical significance was determined by two-tailed unpaired t test. ***, P < 0.005. (C) Volcano plot showing Log2FC versus adj. P value for RNA-seq data from Id2 Delta/Delta and Ctrl NK cells. Data are combined from three biological replicates. (D and E) Example of enrichment data from GSEA of Ctrl and Id2 Delta/Delta RNA-seq data. FDR, false discovery rate; NES, normalized enrichment score.

- Submitted by
- Invitrogen Antibodies (provider)
- Main image

- Experimental details
- Figure S2. Altered gene expression in Tcf7 Delta/Delta BM NK cells. (A) Sequence of the intronic region of Tcf7 that shows increased accessibility in ID2-deficient BM CD27 + CD11b - NK cells. (B) Schematic representation of the overlap between regions with altered chromatin accessibility in ID2-deficient CD27 + CD11b - NK cells by ATAC-seq and TCF1 binding sites in CD8 T cells determined by ChIP-seq (Gene Expression Omnibus accession no. GSE73239 ). Regions with increased accessibility by ATAC-seq are shown in yellow, decreased accessibility in peach, and no change in orange. TCF1 binding sites are significantly enriched in ATAC-seq regions that gain accessibility in ID2-deficient cells. P < 1.846 10-66 (Fisher's exact test). (C) Volcano plot showing Log2FC versus adj. P values for RNA-seq data from Tcf7 Delta/Delta and Ctrl NK cells. Data were generated from three biological replicates. (D) GSEA for Ctrl versus Tcf7 Delta/Delta NK cell RNA expression. (E) Table showing differentially expressed genes from RNA-seq data shown in C . (F) Flow cytometry plots of different proteins on NK cells of spleen from Tcf7 Delta/Delta and Ctrl mice ( n = 3-4 for each group from independent experiments). (G) Summary of the data in F. Error bars represent SEM. Statistical significance was determined by two-tailed unpaired t test. *, P < 0.05; **, P < 0.01. FDR, false discovery rate; NES, normalized enrichment score.

- Submitted by
- Invitrogen Antibodies (provider)
- Main image
- Experimental details
- Figure S3. TCF1 deficiency partially rescues ID2-deficient NK cell maturation in the BM and liver. (A) CD49b + -enriched NK cells from BM were culture in 20 ng/ml IL-15 for 6 d, after which NK1.1 + CD49b + cells were analyzed for CD27 and CD11b by flow cytometry. Numbers indicate the percentage of cells in the respective quadrant ( n > 4 from independent experiments). (B) Summary of CD27 MFI for n = 4 in A. MFI of Ctrl NK cells was set as 1 in each experiment. (C) Liver from Id2 Delta/Delta Tcf7 Delta/Delta , Id2 Delta/Delta , and Ctrl mice were analyzed by flow cytometry for NK and ILC1 cells. The top panels were from lymphocyte gate, and the bottom panels were from lineage (Lin)/PI - NK1.1 + gate. NK cells are defined as NK1.1 + CD49b + CD49a - , and ILC1 cells are defined as NK1.1 + CD49b - CD49a + . Numbers are the percentage of cells in the indicated gates ( n = 3 from three independent experiments). (D and E) Summary of data shown in C for NK cell and ILC1 cell numbers per 10 8 cells. (F) NK1.1 + CD49b + CD49a - NK cells from the liver were analyzed by flow cytometry for CD27 and CD11b. Numbers indicate the percentage of cells in the respective quadrant ( n = 3 from three independent experiments). (G) Summary of data shown in F for frequencies of different NK cell subsets. (H) Flow cytometry plots of KLRG1 expression in Id2 Delta/Delta Tcf7 Delta/Delta , Id2 Delta/Delta , and Ctrl mice. Numbers indicate the percentage of cells in the respective quadrant ( n = 3; data ar

- Submitted by
- Invitrogen Antibodies (provider)
- Main image
- Experimental details
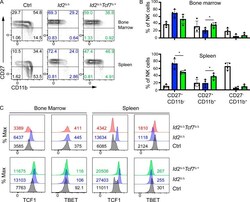
- Figure S4. Heterozygous deletion of Tcf7 restores maturation of Id2 Delta/Delta NK cells to the CD27 + CD11b + stage. (A) Flow cytometry showing CD27 and CD11b on CD3epsilon - NK1.1 + DX5 + NK cells from the BM (top row) or spleen (bottom row) of Ctrl, Id2 Delta/Delta (blue), and Id2 Delta/Delta Tcf7 Delta/+ (green) mice ( n = 4 from four independent experiments). (B) Summary of the frequency of each NK cell subset in CD3epsilon - NK1.1 + DX5 + NK cells from the BM (top) or spleen (bottom) of Ctrl, Id2 Delta/Delta (blue), and Id2 Delta/Delta Tcf7 Delta/+ (green) mice. Error bars are SEM. *, P < 0.05 determined by one-way ANOVA with Tukey's multiple comparisons test. (C) Intracellular expression of TCF1 or TBET in BM or spleen NK cells from each of the indicated mouse strains. Numbers are MFI. One representative experiment is shown ( n = 2 for Id2 Delta/Delta Tcf7 Delta/+ NK cells and n > 4 for Ctrl, Id2 Delta/Delta , and Id2 Delta/Delta Tcf7 Delta/Delta NK cells).

- Submitted by
- Invitrogen Antibodies (provider)
- Main image

- Experimental details
- Figure 3. Pik3cd E1020K/+ mice fail to develop a robust T CM population (A-F) Viable CD8 + splenocytes from mice infected with LCMV Armstrong (n = 2, 4-5/group/time point). (A-C) NP396-specific CD8 + cells day 15 p.i. (A) CD127 and KLRG1 expression (left: representative staining; right: %KLRG1 + CD127 - ). (B) Representative histogram of CD27 (top) and CD127 (bottom). (C) GzmB and TCF1 staining. Middle: TCF1 MFI; right: GzmB MFI. (D-F) NP396-specific CD8 + cells day 58 p.i. (D) CD44 and CD62L staining. Representative flow (left), % CD44 hi CD62L lo cells (right). (E) CD127 histograms: CD44 hi CD62L lo (top) and CD44 hi CD62L + (bottom). (F) TCF1 MFI. (G) TCF1 staining of allo-reactive CD8 + cells from healthy controls and patients with APDS (n = 2, representative histogram). (H-L) Mice were infected with X31 and challenged with PR8 (n = 2, 3-5 mice/genotype/time point). (H) Infection outline. (I) PA224-specific CD8 + cell numbers. (J) IFN-gamma and TNF-alpha from day 8 cells stimulated with either PA 224-233 (left) or anti-CD3 plus anti-CD28 (right). (K) NP366-specific CD8 + T cell numbers. (L) IFN-gamma and TNF-alpha from day 35 cells stimulated with either NP 366-374 (left) or anti-CD3 plus anti-CD28 (right). (M-O) OT-1 cells were transferred into congenic hosts, infected with influenza X31-OVA and challenged with PR8-OVA (n = 2, 3 mice/genotype/time point). (M) Outline. (N) Viable OT-1 cell numbers. (O) TCF1 and GzmB expression in OT-1 cells on day 35. Representative exper

- Submitted by
- Invitrogen Antibodies (provider)
- Main image

- Experimental details
- Figure 1 Dynamic Tsc1 expression following IL-15 stimulation. ( a - c ) Quantitative reverse transcription-PCR (RT-PCR) analysis of the indicated genes in sorted CD3 - NK1.1 + cells from the spleen of WT mice before and after stimulation with 25 ng ml -1 IL-15 for 18 h ( a ), various concentration of IL-15 ( b ), or at the indicated time points ( c ). ( d ) Intracellular phosphorylated S6 in sorted NK cells after stimulation with 25 ng ml -1 IL-15 was detected by flow cytometry at the indicated time points, and the mean fluorescence intensity was calculated. ( e ) Tsc1 messenger RNA (mRNA) expression was analysed by quantitative RT-PCR in sorted CD3 - NK1.1 + cells after stimulation with 25 ng ml -1 IL-15 for 18 h in the presence of DMSO or rapamycin (10 nM). ( f ) Analysis of Tsc1 mRNA expression in sorted T, B and NK cells by quantitative PCR. (g) Analysis of Tsc1 mRNA expression in CLP, NKp and immature NK cells (iNK), and NK cell subsets, including CD27 - CD11b - (DN), CD27 + CD11b - (CD27 SP), CD27 + CD11b + (DP) and CD27 - CD11b + (CD11b SP), by quantitative PCR. The results were normalized to beta- actin ( f , g ) or are presented relative to expression in untreated cells, which was set as 1 ( a - c , e ). Value represent mean+-s.d. * P
