Antibody data
- Antibody Data
- Antigen structure
- References [0]
- Comments [0]
- Validations
- Western blot [2]
- Immunocytochemistry [1]
- Other assay [1]
Submit
Validation data
Reference
Comment
Report error
- Product number
- MA1-19400 - Provider product page

- Provider
- Invitrogen Antibodies
- Product name
- alpha/beta Tubulin Monoclonal Antibody (TU-10)
- Antibody type
- Monoclonal
- Antigen
- Other
- Description
- This antibody recognizes alpha, beta-tubulin heterodimer, a basic intracellular structural unit of microtubules. Alpha- and beta-tubulins form approximately 100 kDa tubulin heterodimer, a globular protein that polymerizes to form microtubules. Western Blot: Reducing conditions.
- Reactivity
- Human, Mouse, Rat, Porcine
- Host
- Mouse
- Isotype
- IgM
- Antibody clone number
- TU-10
- Vial size
- 100 µg
- Concentration
- 1 mg/mL
- Storage
- 4° C, do not freeze
No comments: Submit comment
Supportive validation
- Submitted by
- Invitrogen Antibodies (provider)
- Main image

- Experimental details
- Western blot analysis was performed on whole cell extracts (30µg lysate) of A549 (Lane 1), COS-7 (Lane 2), MDCK (Lane 3), C2C12 (Lane 4), PC-3 (Lane 5), PC-12 (Lane 6) and RSC96 (Lane 7). The blot was probed with Anti-alpha/beta Tubulin Mouse Monoclonal Antibody (Product # MA1-19400, 2µg/mL) and detected by chemiluminescence using Goat anti-Mouse IgG (H+L) Superclonal™ Secondary Antibody, HRP conjugate (Product # A28177, 0.25µg/mL, 1:4000 dilution). A 52 kDa band corresponding to alpha/beta Tubulin was observed across the cell lines and tissues tested. Known quantity of protein samples were electrophoresed using Novex® NuPAGE® 4-12 % Bis-Tris gel (Product # NP0322BOX), XCell SureLock™ Electrophoresis System (Product # EI0002) and Novex® Sharp Pre-Stained Protein Standard (Product # LC5800). Resolved proteins were then transferred onto a nitrocellulose membrane with iBlot® 2 Dry Blotting System (Product # IB21001). The membrane was probed with the relevant primary and secondary Antibody following blocking with 5 % skimmed milk. Chemiluminescent detection was performed using Pierce™ ECL Western Blotting Substrate (Product # 32106).
- Submitted by
- Invitrogen Antibodies (provider)
- Main image

- Experimental details
- Western blotting analysis of human alpha/beta-tubulin using mouse monoclonal antibody TU-10 on lysates of various cell lines under non-reducing and reducing conditions. Nitrocellulose membrane was probed with 2µg/mL of mouse anti-alpha/beta-tubulin monoclonal antibody (Product # MA1-19400) followed by IRDye800-conjugated anti-mouse secondary antibody. Alpha/beta-tubulin band was detected at approximately 54 kDa.
Supportive validation
- Submitted by
- Invitrogen Antibodies (provider)
- Main image

- Experimental details
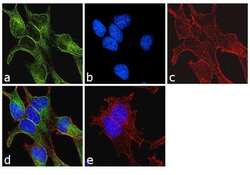
- Immunofluorescence analysis of alpha/beta Tubulin was performed using 70% confluent log phase LNCaP cells. The cells were fixed with 4% paraformaldehyde for 10 minutes, permeabilized with 0.1% Triton™ X-100 for 10 minutes, and blocked with 1% BSA for 1 hour at room temperature. The cells were labeled with alpha/beta Tubulin (TU-10) Mouse Monoclonal Antibody (Product # MA1-19400) at 2µg/mL in 0.1% BSA and incubated for 3 hours at room temperature and then labeled with Goat anti-Mouse IgG (H+L)/IgM (L) Superclonal™ Secondary Antibody, Alexa Fluor® 488 conjugate (Product # A28175) at a dilution of 1:2000 for 45 minutes at room temperature (Panel a: green). Nuclei (Panel b: blue) were stained with SlowFade® Gold Antifade Mountant with DAPI (Product # S36938). F-actin (Panel c: red) was stained with Rhodamine Phalloidin (Product # R415, 1:300). Panel d represents the merged image showing cytoplasmic localization. Panel e shows the no primary antibody control. The images were captured at 60X magnification.
Supportive validation
- Submitted by
- Invitrogen Antibodies (provider)
- Main image

- Experimental details
- Figure 5 Effect of chrysoeriol on CYP19 expression. ( A - C ) MCF-7 cells were pretreated with chrysoeriol (0-20 muM) for 30 min, followed by treatment with 10 ng/mL TNFalpha. After 24 h, CYP19 expression was determined by RT-PCR ( A ), qR-PCR ( B ), and immunoblot analysis ( C ). GAPDH was used as an internal control. Band intensities were measured using the ImageJ software. Bars represent the mean +- SD ( n = 3). ** p < 0.01, *** p < 0.001 by Dunnett's multiple comparisons test. qR-PCR, quantitative real-time PCR. ( D ) MCF-7 cells cultured on coverslips were treated with 10 ng/mL TNFalpha in the absence or presence of 10 muM chrysoeriol, followed by fixation, permeabilization, and incubation with primary antibodies specific to alpha/beta-tubulin and CYP19 aromatase for 2 h. After washing, Alexa Fluor 555 (for alpha/beta-tubulin; red signal) and Alexa Fluor 488 (for CYP19; green signal) secondary antibodies were used to probe the samples for 30 min. Nuclear DNAs were stained with Hoechst 33258 for 10 min (blue signal). Fluorescently labeled cells were viewed under an EVOS FL fluorescence microscope. Nuclear DNA and alpha/beta-tubulin were overlaid (left panels). Yellow boxed regions are zoomed-in on the far right. Scale bars represent 20 mum.
 Explore
 Validate
 Learn
Learn Western blot
 Flow cytometry