 Explore
 Validate
 Learn
LearnPA1-16592
antibody from Invitrogen Antibodies
Targeting: CA9
CAIX, MN
 Western blot
 ELISA Immunocytochemistry Immunohistochemistry Flow cytometry Gel shift Chromatin Immunoprecipitation Other assay
Antibody data
- Antibody Data
- Antigen structure
- References [7]
- Comments [0]
- Validations
- Western blot [7]
- Immunocytochemistry [1]
- Immunohistochemistry [3]
- Flow cytometry [2]
- Other assay [7]
Submit
Validation data
Reference
Comment
Report error
- Product number
- PA1-16592 - Provider product page

- Provider
- Invitrogen Antibodies
- Product name
- Carbonic Anhydrase IX Polyclonal Antibody
- Antibody type
- Polyclonal
- Antigen
- Synthetic peptide
- Reactivity
- Human, Mouse, Rat
- Host
- Rabbit
- Isotype
- IgG
- Vial size
- 100 µL
- Concentration
- 1.0 mg/mL
- Storage
- -20° C, Avoid Freeze/Thaw Cycles
Submitted references Hypoxia-mediated stabilization of HIF1A in prostatic intraepithelial neoplasia promotes cell plasticity and malignant progression.
Therapeutic Effects of Inhibition of Sphingosine-1-Phosphate Signaling in HIF-2α Inhibitor-Resistant Clear Cell Renal Cell Carcinoma.
Hypoxic Jumbo Spheroids On-A-Chip (HOnAChip): Insights into Treatment Efficacy.
HIF-1α and HIF-2α differently regulate tumour development and inflammation of clear cell renal cell carcinoma in mice.
Mixing and delivery of multiple controlled oxygen environments to a single multiwell culture plate.
Deletion of the von Hippel-Lindau Gene in Hemangioblasts Causes Hemangioblastoma-like Lesions in Murine Retina.
Modeling Renal Cell Carcinoma in Mice: Bap1 and Pbrm1 Inactivation Drive Tumor Grade.
Abu El Maaty MA, Terzic J, Keime C, Rovito D, Lutzing R, Yanushko D, Parisotto M, Grelet E, Namer IJ, Lindner V, Laverny G, Metzger D
Science advances 2022 Jul 22;8(29):eabo2295
Science advances 2022 Jul 22;8(29):eabo2295
Therapeutic Effects of Inhibition of Sphingosine-1-Phosphate Signaling in HIF-2α Inhibitor-Resistant Clear Cell Renal Cell Carcinoma.
Hoefflin R, Harlander S, Abhari BA, Peighambari A, Adlesic M, Seidel P, Zodel K, Haug S, Göcmen B, Li Y, Lahrmann B, Grabe N, Heide D, Boerries M, Köttgen A, Heikenwalder M, Frew IJ
Cancers 2021 Sep 25;13(19)
Cancers 2021 Sep 25;13(19)
Hypoxic Jumbo Spheroids On-A-Chip (HOnAChip): Insights into Treatment Efficacy.
Refet-Mollof E, Najyb O, Chermat R, Glory A, Lafontaine J, Wong P, Gervais T
Cancers 2021 Aug 11;13(16)
Cancers 2021 Aug 11;13(16)
HIF-1α and HIF-2α differently regulate tumour development and inflammation of clear cell renal cell carcinoma in mice.
Hoefflin R, Harlander S, Schäfer S, Metzger P, Kuo F, Schönenberger D, Adlesic M, Peighambari A, Seidel P, Chen CY, Consenza-Contreras M, Jud A, Lahrmann B, Grabe N, Heide D, Uhl FM, Chan TA, Duyster J, Zeiser R, Schell C, Heikenwalder M, Schilling O, Hakimi AA, Boerries M, Frew IJ
Nature communications 2020 Aug 17;11(1):4111
Nature communications 2020 Aug 17;11(1):4111
Mixing and delivery of multiple controlled oxygen environments to a single multiwell culture plate.
Yao M, Sattler T, Rabbani ZN, Pulliam T, Walker G, Gamcsik MP
American journal of physiology. Cell physiology 2018 Nov 1;315(5):C766-C775
American journal of physiology. Cell physiology 2018 Nov 1;315(5):C766-C775
Deletion of the von Hippel-Lindau Gene in Hemangioblasts Causes Hemangioblastoma-like Lesions in Murine Retina.
Wang H, Shepard MJ, Zhang C, Dong L, Walker D, Guedez L, Park S, Wang Y, Chen S, Pang Y, Zhang Q, Gao C, Wong WT, Wiley H, Pacak K, Chew EY, Zhuang Z, Chan CC
Cancer research 2018 Mar 1;78(5):1266-1274
Cancer research 2018 Mar 1;78(5):1266-1274
Modeling Renal Cell Carcinoma in Mice: Bap1 and Pbrm1 Inactivation Drive Tumor Grade.
Gu YF, Cohn S, Christie A, McKenzie T, Wolff N, Do QN, Madhuranthakam AJ, Pedrosa I, Wang T, Dey A, Busslinger M, Xie XJ, Hammer RE, McKay RM, Kapur P, Brugarolas J
Cancer discovery 2017 Aug;7(8):900-917
Cancer discovery 2017 Aug;7(8):900-917
No comments: Submit comment
Supportive validation
- Submitted by
- Invitrogen Antibodies (provider)
- Main image

- Experimental details
- Western blot analysis of CAIX on rat renal cortex using Product # PA1-16592.

- Submitted by
- Invitrogen Antibodies (provider)
- Main image

- Experimental details
- Western Blot detection of carbonic anhydrase IX in transfected HEK cell lysate using Product # PA1-16592. Rabbit IgG was used as a negative control.

- Submitted by
- Invitrogen Antibodies (provider)
- Main image
- Experimental details
- Western blot analysis of Carbonic Anhydrase IX in MDA-MB-231 cell lysate using a polyclonal antibody (Product # PA1-16592).

- Submitted by
- Invitrogen Antibodies (provider)
- Main image

- Experimental details
- Western blot analysis of Carbonic Anhydrase IX in 1) HeLa, 2) MDA-MB-231, and 3) A549 whole cell lysates. Samples were incubated in Carbonic Anhydrase IX polyclonal antibody (Product # PA1-16592). Specific bands were detected for Carbonic Anhydrase IX/CA9 at a molecular weight of 50 kDa.

- Submitted by
- Invitrogen Antibodies (provider)
- Main image

- Experimental details
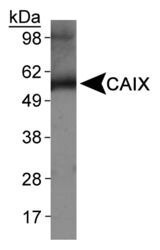
- Western blot analysis of Carbonic Anhydrase IX in rat renal cortex. Samples were incubated in Carbonic Anhydrase IX polyclonal antibody (Product # PA1-16592). A specific band was detected at a molecular weight of approximately 50 kDa.

- Submitted by
- Invitrogen Antibodies (provider)
- Main image

- Experimental details
- Western blot analysis of Carbonic Anhydrase IX in 0.1 mg/mL HeLa lysate. Samples were incubated in Carbonic Anhydrase IX polyclonal antibody (Product # PA1-16592). This experiment was performed under reducing conditions using the 12-230 kDa separation system.

- Submitted by
- Invitrogen Antibodies (provider)
- Main image

- Experimental details
- Western blot was performed using Anti-Carbonic Anhydrase IX Polyclonal Antibody (Product # PA1-16592) and ~ 50-55 kDa bands corresponding to CA9 was observed across cell lines tested and increased upon Deferoxamine and Cobalt Chloride treatment in HeLa along with an uncharacterized band (*) at ~35 kDa. Whole cell extracts (30 µg lysate) of U-87 MG (Lane 1), HeLa (Lane 2), HeLa treated with Deferoxamine (100uM for 24 Hours) (Lane 3) and HeLa treated with Cobalt Chloride (200uM for 24 Hours) (Lane 4) were electrophoresed using NuPAGE® 4-12 % Bis-Tris gel (Product # NP0322BOX). Resolved proteins were then transferred onto a nitrocellulose membrane (Product # IB23001) by iBlot® 2 Dry Blotting System (Product # IB21001). The blot was probed with the primary antibody (0.5ug/ml) and detected by chemiluminescence with Goat anti-Rabbit IgG (H+L), Superclonal™ Recombinant Secondary Antibody, HRP (Product # A27036, 1:4000 dilution) using the iBright FL 1000 (Product # A32752). Chemiluminescent detection was performed using Novex® ECL Chemiluminescent Substrate Reagent Kit (Product # WP20005).

Supportive validation
- Submitted by
- Invitrogen Antibodies (provider)
- Main image
- Experimental details
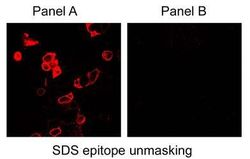
- Immunofluorescence of HEK 293 cells using Product # PA1-16592. Panel A shows CAIX-transfected cells (epitope-unmasked with SDS) and panel B shows mock transfected cells.

Supportive validation
- Submitted by
- Invitrogen Antibodies (provider)
- Main image

- Experimental details
- Immunohistochemical analysis of Carbonic Anhydrase IX in formalin-fixed paraffin-embedded tissue sections of human stomach were probed for Carbonic Anhydrase IX/CA9 mRNA (ACD RNAScope Probe; Fast Red chromogen, ACD). Samples were incubated in Carbonic Anhydrase IX polyclonal antibody (Product # PA1-16592) using a dilution of 1:1000 dilution with overnight incubation at 4 °C followed by anti-rabbit IgG VisUCyte HRP Polymer Antibody and DAB chromogen (yellow-brown). Tissue was counterstained with hematoxylin (blue). Specific staining was localized to glandular cells.

- Submitted by
- Invitrogen Antibodies (provider)
- Main image
- Experimental details
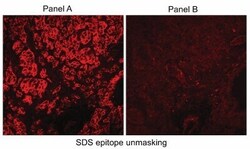
- Immunohistochemical analysis of Carbonic Anhydrase IX in human RCC tumor cryosections. Samples were incubated in Carbonic Anhydrase IX polyclonal antibody (Product # PA1-16592). Antibody (Panel A). Panel B shows staining with normal rabbit serum.

- Submitted by
- Invitrogen Antibodies (provider)
- Main image
- Experimental details
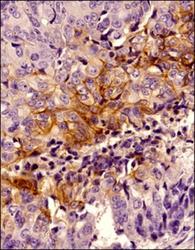
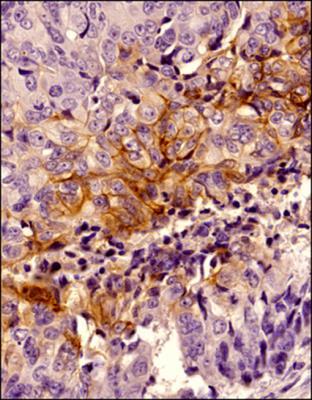
- Immunohistochemical analysis of Carbonic Anhydrase IX in formalin-fixed paraffin-embedded tissue section of human breast cancer. Samples were incubated in Carbonic Anhydrase IX polyclonal antibody (Product # PA1-16592) using a dilution of 1:1000 followed by HRP labeled secondary antibody and DAB reagent. Nuclei of the cells were counterstained with hematoxylin. This CAIX antibody generated an expected cytoplasmic staining of CAIX protein with an intense signal around the cellular membranes in tumor cores. The latter are more likely to be hypoxic in growing tumors which signifies that the observed CAIX staining is specific.
Supportive validation
- Submitted by
- Invitrogen Antibodies (provider)
- Main image

- Experimental details
- Flow cytometry of Carbonic Anhydrase IX in A431 cells (blue) and a matched isotype control (orange). Samples were incubated in Carbonic Anhydrase IX polyclonal antibody (Product # PA1-16592) using a dilution of 1.0 µg/mL for 30 minutes at room temperature followed by a Rabbit IgG (H+L) Cross-Adsorbed Secondary Antibody, Dylight™ 550 (Product # SA5-10033). Cells were fixed with 4% PFA and then permeabilized with 0.1% saponin.

- Submitted by
- Invitrogen Antibodies (provider)
- Main image

- Experimental details
- Flow cytometry of Carbonic Anhydrase IX in U-87 MG Cells. Samples were incubated in Carbonic Anhydrase IX polyclonal antibody (Product # PA1-16592) and a matched isotype control using a dilution of 2.5 µg/mL for 30 minutes at room temperature followed by rabbit IgG APC-conjugated secondary antibody. Cells were fixed with 4% PFA and then permeablized with 0.1% saponin.

Supportive validation
- Submitted by
- Invitrogen Antibodies (provider)
- Main image

- Experimental details
- NULL
- Submitted by
- Invitrogen Antibodies (provider)
- Main image

- Experimental details
- NULL

- Submitted by
- Invitrogen Antibodies (provider)
- Main image

- Experimental details
- Figure 4 Hypoxia is localized in the core of jumbo spheroids at expected depths. ( a , b ) CAIX (red) staining in SK-LMS-1 ( a ) and STS117 ( b ) small (normoxic and hypoxic controls) and jumbo spheroids using anti-CAIX antibody. N = 3 with more than 3 spheroids per repetition. Scale bar = 100um. ( c ) Hypoxic fraction area on jumbo sarcoma spheroids. 45% +- 8.9% of SK-LMS-1 and 49% +- 11.4% of STS117 cross section area express CAIX and is defined as hypoxic area. Results are presented as mean +- SD. N = 3. ( d ) Schematic of oxygen consumption modelling in jumbo spheroids. Michaelis-Menten parameters for oxygen consumption are derived from CAIX staining. ( e ) Mean oxygen concentration profile in jumbo and small spheroids cross-section. ( f ) Graph of mean oxygen concentration in small, jumbo and theoretically hypoxic spheroids cross-section.

- Submitted by
- Invitrogen Antibodies (provider)
- Main image

- Experimental details
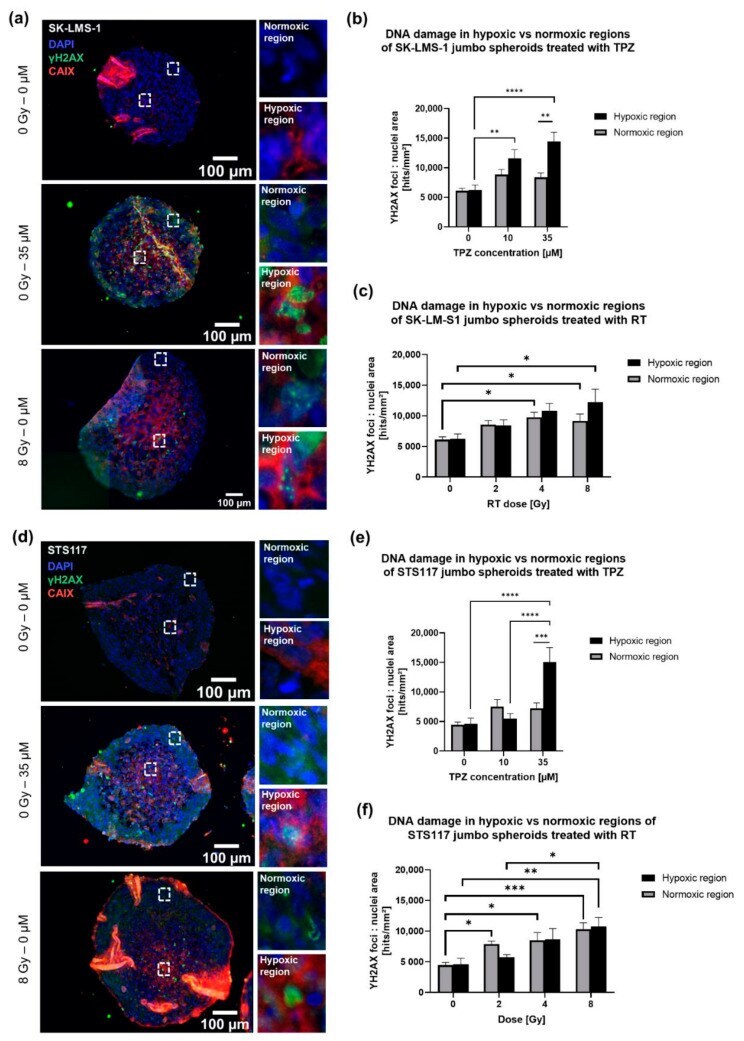
- Figure 5 Contrary to RT alone, treatment with TPZ alone resulted in oxygen-dependent responses. ( a , d ) DNA damages (gammaH2AX, green), hypoxia (CAIX, red) and nuclei (DAPI, blue) staining in SK-LMS-1 ( a ) and STS117 ( d ) jumbo spheroids treated with either 35 UM of TPZ or 8 Gy of RT. ( b , c , e , f ) DNA damages in hypoxic (H) versus normoxic ( N ) regions of SK-LMS-1 and STS117 jumbo spheroids treated with either TPZ alone ( b , e ) or with RT alone ( c , f ) (SK-LMS-1: H: 0-10 uM: p = 0.0038, 0-35 uM: p < 0.0001; 35 uM: H vs. N : p = 0.0096), (STS117: H: 0-35 uM: p < 0.0001, 10-35 uM: p < 0.0001; 35 uM: H vs. N : p = 0.0009), (SK-LMS-1: H: 0-8 Gy: p = 0.0157; N : 0-4 Gy: p = 0.0111, 0-8 Gy: p = 0.043), (STS117: H: 0-8 Gy: p = 0.0076, 2-8 Gy: p = 0.0429; N : 0-2 Gy p = 0.0387, 0-4 Gy: p = 0.0125, 0-8 Gy: p = 0.0002). From gammaH2AX IF staining foci were counted and normalized per nuclei area. Values are presented as mean +- standard error of the mean (SEM), N = 3-4, 2-4 spheroids per repetition, * p < 0.05, ** p < 0.005, *** p < 0.0005, **** p < 0.0001.
- Submitted by
- Invitrogen Antibodies (provider)
- Main image

- Experimental details
- Figure A1 CAIX expression is significantly higher in small-hypoxic spheroids than in small-normoxic ones. Normalized pixel count of CAIX IF staining, in STS117 and SK-LMS-1 small normoxic and small hypoxic spheroids (STS117: small-normoxic vs. small hypoxic: p = 0.0254. SK-LMS-1: small-normoxic vs. small hypoxic: p = 0.0015). Values are presented as mean +- SD, N = 3, 2 spheroids per repetition, * p < 0.05, ** p < 0.005.

- Submitted by
- Invitrogen Antibodies (provider)
- Main image

- Experimental details
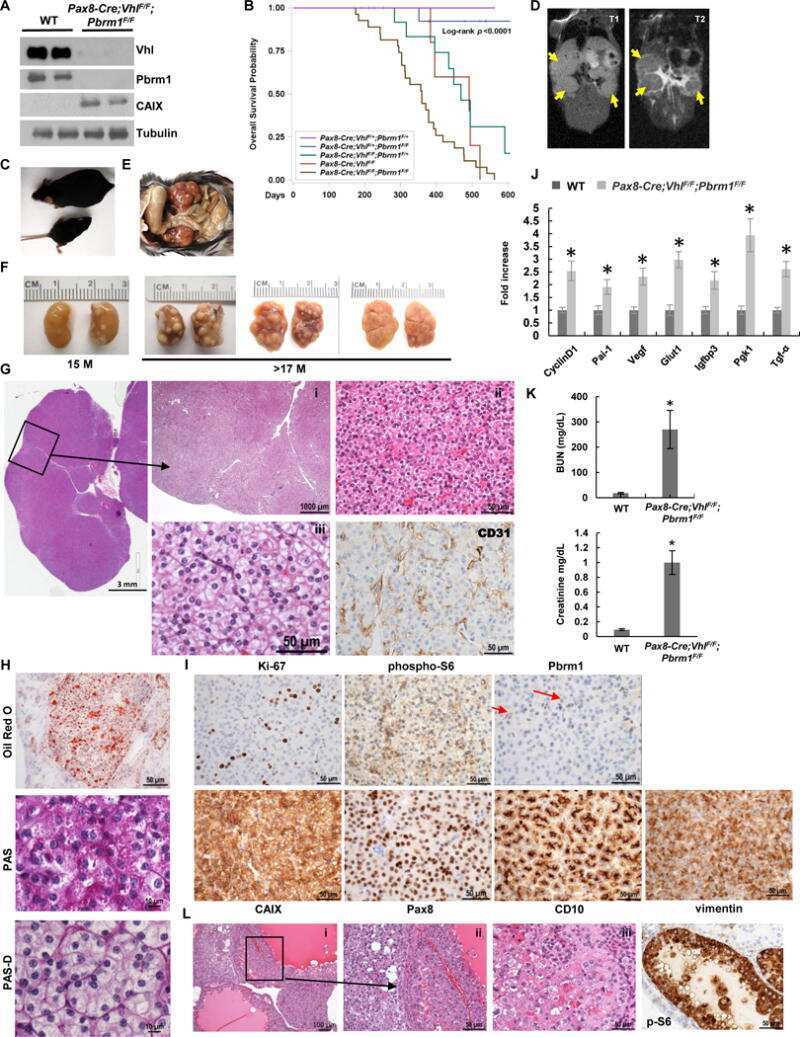
- Figure 2 Molecular analyses of therapy testing in the Vhl/Trp53/Rb1 mutant mouse ccRCC model. ( A ) Representative immunohistochemical stainings for CA9, GLUT-1, P-4E-BP1, and Ki-67 in regions of cortex and ccRCC from untreated mice and from regions of ccRCC from mice treated with PT2399, ACF, or FTY720. Scale bar = 100 mm. ( B - D ) Scoring of staining intensities of CA9 ( B ), GLUT-1 ( C ), and phospho-Thr37/Thr46-4E-BP1 (P-4E-BP1) ( D ) in ccRCC tumors. Analyses are based on 58, 25, 14, and 19 tumors for CA9, on 28, 17, 12, and 17 tumors for GLUT-1, and on 26, 24, 22, and 22 tumors for P-4E-BP1 in untreated, PT2399, ACF, and FTY720 treated cohorts. p -values were calculated using the two-sided Mann-Whitney U test without adjustments for multiple comparisons. Representative examples of scores 1, 2, and 3 for each staining are shown in Supplemental Figure S2 . ( E ) Quantification of percentage of Ki-67 positive nuclei in regions of normal cortex (N) and ccRCC (T). Analyses are based on 22, 24, 18, and 25 tumors in untreated, PT2399, ACF, and FTY720 treated cohorts. Mean +- SEM are shown, p -values for pairwise comparisons were calculated by Student's t -test followed by two-sided Mann-Whitney U test without adjustments for multiple comparisons.

- Submitted by
- Invitrogen Antibodies (provider)
- Main image
- Experimental details
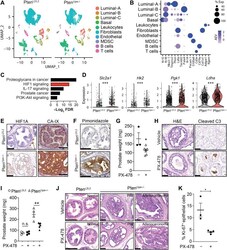
- Fig. 1. Activation of HIF1A signaling in early prostatic lesions and its pharmacological targeting. ( A ) UMAP of unsupervised clustering of prostatic cells from Pten L2/L2 and Pten (i)pe-/- mice, 3 months AGI, and ( B ) dot plot depicting cell lineage-specific markers. ( C ) KEGG pathway analysis of genes up-regulated in Pten- prostatic luminal cells. ( D ) Violin plots depicting the levels of HIF1A signaling-related transcripts in luminal-A and -C cells. *** P < 0.001, Wilcoxon rank sum test. ( E ) Representative immunohistochemical (IHC) staining of HIF1A and carbonic anhydrase 9 (CA-IX) in sections of dorsolateral prostate (DLP) of Pten L2/L2 and Pten (i)pe-/- mice 3 months AGI. n = 3 mice per condition. Scale bars, 100 mum. ( F ) Pimonidazole IHC staining in the DLP of Pten L2/L2 and Pten (i)pe-/- mice 3 months AGI. n = 3 mice per condition. Scale bars, 100 mum. Prostate weight ( G ) and representative H&E staining ( H , left) and cleaved caspase 3 (C3) IHC staining ( H , right) of Pten (i)pe-/- mice, 3 months AGI, treated for 5 days with vehicle ( n = 3) or PX-478 ( n = 6). * P < 0.05, two-tailed t test. Scale bars, 100 mum. Prostate weight ( I ) and H&E-stained DLP ( J ) of Pten L2/L2 ( n = 4 per condition) and Pten (i)pe-/- ( n = 6 per condition) mice (10 months AGI) treated for 28 days with vehicle or PX-478. n.s., not significant, P >= 0.05; ** P < 0.01, two-tailed t test. Scale bars, 100 mum. ( K ) Quantification of Ki-67-positive epithelial cells in the DLP of
