 Explore
 Validate
 Learn
Learn Western blot
Antibody data
- Antibody Data
- Antigen structure
- References [1]
- Comments [0]
- Validations
- Western blot [2]
- Immunocytochemistry [1]
- Immunohistochemistry [3]
- Other assay [1]
Submit
Validation data
Reference
Comment
Report error
- Product number
- PA5-82658 - Provider product page

- Provider
- Invitrogen Antibodies
- Product name
- TOP1 Polyclonal Antibody
- Antibody type
- Polyclonal
- Antigen
- Recombinant full-length protein
- Description
- Immunogen sequence: KVRASGDAKI KKEKENGFSS PPQIKDEPED DGYFVPPKED IKPLKRPRDE DDADYKPKK
- Reactivity
- Human, Mouse, Rat
- Host
- Rabbit
- Isotype
- IgG
- Vial size
- 100 µL
- Concentration
- 0.2 mg/mL
- Storage
- Store at 4°C short term. For long term storage, store at -20°C, avoiding freeze/thaw cycles.
Submitted references Myeloid cell-specific topoisomerase 1 inhibition using DNA origami mitigates neuroinflammation.
Zhu K, Wang Y, Sarlus H, Geng K, Nutma E, Sun J, Kung SY, Bay C, Han J, Min JH, Benito-Cuesta I, Lund H, Amor S, Wang J, Zhang XM, Kutter C, Guerreiro-Cacais AO, Högberg B, Harris RA
EMBO reports 2022 Jul 5;23(7):e54499
EMBO reports 2022 Jul 5;23(7):e54499
No comments: Submit comment
Supportive validation
- Submitted by
- Invitrogen Antibodies (provider)
- Main image
- Experimental details
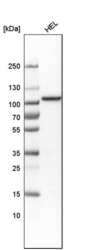
- Western blot analysis of TOP1 by a TOP1 polyclonal antibody (Product # PA5-82658). Analysis in human cell line HEL.

- Submitted by
- Invitrogen Antibodies (provider)
- Main image
- Experimental details
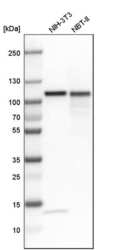
- Western blot analysis of TOP1 by a TOP1 polyclonal antibody (Product # PA5-82658). Analysis in mouse cell line NIH-3T3 and rat cell line NBT-II.

Supportive validation
- Submitted by
- Invitrogen Antibodies (provider)
- Main image
- Experimental details
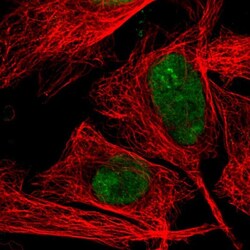
- Immunofluorescent analysis of TOP1 in U-2 OS cells using a TOP1 polyclonal antibody (Product # PA5-82658). The analysis shows localization to nucleus & nucleoli fibrillar center.

Supportive validation
- Submitted by
- Invitrogen Antibodies (provider)
- Main image
- Experimental details
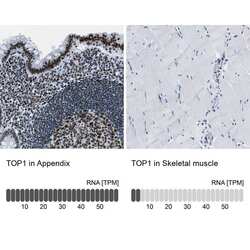
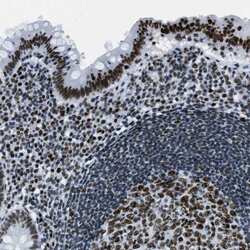
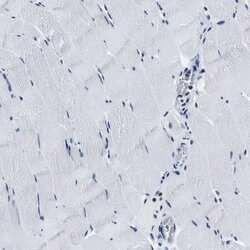
- Immunohistochemical analysis of TOP1 in human appendix and skeletal muscle tissues using a TOP1 polyclonal antibody (Product # PA5-82658). Corresponding RNA-seq data are presented for the same tissues.

- Submitted by
- Invitrogen Antibodies (provider)
- Main image
- Experimental details
- Immunohistochemical analysis of TOP1 in human appendix using a TOP1 polyclonal antibody (Product # PA5-82658). The analysis shows high expression.

- Submitted by
- Invitrogen Antibodies (provider)
- Main image
- Experimental details
- Immunohistochemical analysis of TOP1 in human skeletal muscle using a TOP1 polyclonal antibody (Product # PA5-82658). The analysis shows low expression as expected.

Supportive validation
- Submitted by
- Invitrogen Antibodies (provider)
- Main image

- Experimental details
- 2 Figure TOP1 expression is increased in neuroinflammatory conditions A A schematic overview of the in vitro experiments. B, C Kinetic change of mRNA expression of Top1 , Btbd1 , Tdp1 , and Srsf1 in microglia following LPS/IFNgamma stimulation ( n = 6, technical replicates). D, E The protein expression of TOP1 was detected by Western blotting ( n = 3, biological replicates). F-H Immunostaining of TOP1 (red) in stimulated microglia (4 h after LPS/IFNgamma stimulation) or resting microglia, co-stained with Hoechst (blue) (bar = 20 mum); for the lower-left panel in (H), n = 3 technical replicates per group (2-5 random fields per well were analyzed); for the lower right panel, 201 cells from unstimulated microglia and 256 cells from stimulated microglia were analyzed. G Immunofluorescent staining of spinal cord sections from mice at EAE peak and control mice with anti-F4/80 (green), TOP1 (magenta), and nuclei with Hoechst (blue). For the left panels, bar = 400 mum; for the magnified panels, bar = 100 mum. The yellow arrowhead indicates a representative F4/80 + cell with high TOP1 expression. I A magnified image of the selected region (white box) in (G); bar = 50 mum; the yellow arrowhead indicates the representative F4/80 + cell with increased TOP1 expression in the nucleus in (G). J The mean fluorescent intensity of TOP1 expression in the white matter in (G) was graphed; n = 3-4 mice per group with 3-5 sections from each mouse. K TOP1 expression in the spinal cord homogenates of
