Antibody data
- Antibody Data
- Antigen structure
- References [1]
- Comments [0]
- Validations
- Western blot [2]
- Immunocytochemistry [1]
- Immunohistochemistry [1]
- Flow cytometry [1]
- Other assay [4]
Submit
Validation data
Reference
Comment
Report error
- Product number
- PA5-13863 - Provider product page

- Provider
- Invitrogen Antibodies
- Product name
- PGK1 Polyclonal Antibody
- Antibody type
- Polyclonal
- Antigen
- Synthetic peptide
- Description
- This antibody is predicted to react with non-human primate and rat based on sequence homology.
- Reactivity
- Human
- Host
- Rabbit
- Isotype
- IgG
- Vial size
- 400 µL
- Concentration
- 2 mg/mL
- Storage
- Store at 4°C short term. For long term storage, store at -20°C, avoiding freeze/thaw cycles.
Submitted references Cell stress in cortical organoids impairs molecular subtype specification.
Bhaduri A, Andrews MG, Mancia Leon W, Jung D, Shin D, Allen D, Jung D, Schmunk G, Haeussler M, Salma J, Pollen AA, Nowakowski TJ, Kriegstein AR
Nature 2020 Feb;578(7793):142-148
Nature 2020 Feb;578(7793):142-148
No comments: Submit comment
Supportive validation
- Submitted by
- Invitrogen Antibodies (provider)
- Main image

- Experimental details
- Western blot analysis using a PGK1 polyclonal antibody (Product # PA5-13863) in HeLa (lane 1), HepG2 (lane 2) cell lysates (35 µg per lane).
- Submitted by
- Invitrogen Antibodies (provider)
- Main image

- Experimental details
- Western blot analysis of PGK1 (arrow) using a PGK1 polyclonal antibody (Product # PA5-13863) in 293 cell lysates (2 µg/lane) either nontransfected (Lane 1) or transiently transfected (Lane 2) with the PGK1 gene.
Supportive validation
- Submitted by
- Invitrogen Antibodies (provider)
- Main image

- Experimental details
- Immunofluorescent analysis of HeLa cells using a PGK1 polyclonal antibody (Product # PA5-13863) at a dilution of 1:10-50, followed by a fluor-conjugated goat anti-rabbit secondary antibody (green). Nuclei were stained with DAPI (blue).
Supportive validation
- Submitted by
- Invitrogen Antibodies (provider)
- Main image

- Experimental details
- Immunohistochemical analysis of formalin-fixed, paraffin-embedded human hepatocarcinoma tissue using a PGK1 polyclonal antibody (Product # PA5-13863), followed by HRP-conjugated secondary antibody and DAB staining.
Supportive validation
- Submitted by
- Invitrogen Antibodies (provider)
- Main image

- Experimental details
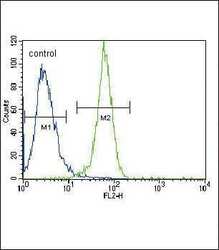
- Flow cytometry analysis of HeLa cells using a PGK1 polyclonal antibody (Product # PA5-13863) (right) compared to a negative control cell (left) at a dilution of 1:10-50, followed by a FITC-conjugated goat anti-rabbit antibody
Supportive validation
- Submitted by
- Invitrogen Antibodies (provider)
- Main image

- Experimental details
- Figure 5. Influence of Culture on Metabolic Stress and Cell Type a) Primary samples were progenitor-enriched, GFP-labeled and transplanted into organoids. After 2.5 weeks, GFP+ cells were isolated via FACS and processed for scRNA-seq. b) Primary GFP+ cells integrate into organoids differentiated using the 'least directed' protocol. Scale bar = 50 uM. Pre-transplantation cells have similar profiles and cellular subtypes as primary data. After transplantation, there is a decrease in subtype correlation (n=7 biologically independent samples across 2 independent experiments). Mean subtype correlation indicated on graph, error bars show standard deviation (p= 2.8e -9 , two-sided Welch's t-test). c) After transplant, primary cells increase expression of stress genes, PGK1 (****p= 1.76e -87 , two-sided student's t-test) and GORASP2 (arrow; ****p= 9.60e -63 two-sided student's t-test) as indicated by width of colored domain in each respective violin plot (n=7 samples across 2 experiments). Scale bar = 50 uM. d) Organoids were dissociated, GFP labeled, and injected into the cortex of P4 mice. After 2-5 weeks, mouse brains were harvested for scRNA-seq and immunostaining. e ) Human cells are visualized by GFP and human nuclear antigen expression (n=13 mice transplanted with 14 organoids derived from 2 iPSC lines across 2 independent experiments). Organoid cells express markers of progenitors (HOPX), neurons (CTIP2, SATB2) and astrocytes (GFAP). Mouse vascular cells (Laminin & CD31) inne
- Submitted by
- Invitrogen Antibodies (provider)
- Main image

- Experimental details
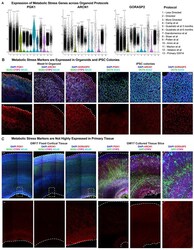
- Extended Data Figure 12. Glycolysis and ER stress Across Culture Systems a) Markers of metabolic stress are expressed across cortical organoid protocols. Violin plots show data both from our experiments (1-3) and published data sets from other protocols (4-12) which have significantly increased expression of the glycolysis gene PGK1, and the ER stress genes ARCN1 and GORASP2 compared to primary samples (n= 5 individual replicates, GW14 shown). Width of the colored area indicates mean gene expression level of each data set and overlaid dots show each individual data point. All protocols have significantly higher expression of these three markers compared to primary samples (****p= < 0.0001, two-sided Student's t-test). b) Single cell sequencing identified increased expression of genes in organoids which were validated across all stages of organoid differentiation evaluated (week 3-14). Validation staining experiments were repeated independently three times. Representative images from week 14 organoids differentiated using the 'least directed' differentiation protocol. Colonies of iPSCs also express the ER stress markers ARCN1 and GORASP2 (n=3 biologically independent samples across three experiments). Scale bar = 50 uM. c) Primary cortical tissue express glycolysis and ER stress genes at undetectable levels (n=3 biologically independent samples across three experiments). When tissue was cultured for one week, there was no significant increase in cellular stress (n=3 biological
- Submitted by
- Invitrogen Antibodies (provider)
- Main image

- Experimental details
- Extended Data Figure 13. Glycolysis and ER Stress Across Experimental Conditions a) Metabolic stress network module eigengene expression across all cells is shown in box and whisker plots (min to max, bar at average, error bars of standard deviation) across 11 datasets generated either in this manuscript or from publicly available datasets. Data is shown for expressed genes from KEGG pathway glycolysis and ER stress networks (This study: n=242,349 cells from 37 organoids across 4 independent experiments; published datasets as annotated). b) The same box and whisker plots (min to max, bar at average, error bars of standard deviation) are shown for organoid (n=week 3: 38,417 cells, week 5: 26,787 cells, week 8: 11,023 cells, week 10: 50,550 cells, week 15: 2,722 cells, week 24: 4,506 cells from 4 independent experiments) and all primary ages (n= GW6: 5,970 cells, GW10: 7,194 cells, GW14: 14,435 cells, GW18: 78,157 cells, GW22: 83,653 cells from 5 independent experiments). ER stress and glycolysis networks decrease over time in primary samples but decrease less in organoids and are significantly higher in most organoid stages than primary samples. Significance was calculated for each organoid sample with respect to each primary sample, and a one-sided Welch's t-test was performed (to evaluate if organoid was higher than primary). All comparisons were either not significant (ns) or significant with ****p < 0.0001. c) Cellular stress genes are expressed at low levels during human
- Submitted by
- Invitrogen Antibodies (provider)
- Main image

- Experimental details
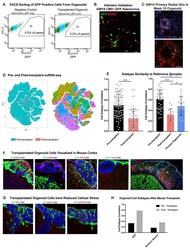
- Extended Data Figure 14. Organoid Transplantation at Multiple Timepoints a) Fluorescence associated cell sorting (FACS) plots showing dummy infection (left) and transplanted organoids (right) in terms of the their GFP signal [x-axis] vs sidesscatter [y-axis]. Cells in gated region were collected (% of parent written on plot) and sequenced for transplantations 2.5 weeks after incubating in the organoid, representative plot shown on right, n=5. b) Immunohistochemical validation of cells infected with GFP virus were all SOX2 labeled progenitor in cells dissociated from primary cortical tissue GW14-20. Scale bar = 50 mM, representative image shown (n = 5 replicates). c) An additional example of primary cell integration into organoids after transplant, where the primary cells integrate into organoid rosettes (n=7 primary samples into 21 organoids across 2 independent studies). d) tSNE of pre- and post-transplant primary cells, as well as the cluster designations. Many cell types represented in pre-transplanted cells are not present in the post-transplant population. e) Subtype similarity correlation between pre-transplant, post-transplant, and primary aggregate samples. Includes plot (bar is average subtype correlation, error bars are standard error) as a replicate to the experiment in Figure 5B , validating that at older organoid ages (week 12) the post-transplanted cells are still significantly impaired in their subtype specification (****p = 1.46e -11 n = 2 primary biologically
 Explore
 Validate
 Learn
Learn Western blot