 Explore
 Validate
 Learn
Learn Western blot
 Immunocytochemistry
Antibody data
- Antibody Data
- Antigen structure
- References [16]
- Comments [0]
- Validations
- Immunocytochemistry [1]
- Flow cytometry [1]
- Other assay [22]
Submit
Validation data
Reference
Comment
Report error
- Product number
- 34-7400 - Provider product page

- Provider
- Invitrogen Antibodies
- Product name
- EphA2 Polyclonal Antibody
- Antibody type
- Polyclonal
- Antigen
- Synthetic peptide
- Reactivity
- Human
- Host
- Rabbit
- Isotype
- IgG
- Vial size
- 100 µg
- Concentration
- 0.25 mg/mL
- Storage
- -20°C
Submitted references EphA2 as a new target for breast cancer and its potential clinical application.
EphA2 Is a Clinically Relevant Target for Breast Cancer Bone Metastatic Disease.
Phosphorylation of PLCγ1 by EphA2 Receptor Tyrosine Kinase Promotes Tumor Growth in Lung Cancer.
Targeting EphA2 impairs cell cycle progression and growth of basal-like/triple-negative breast cancers.
Evaluation of EphA2 and EphB4 as Targets for Image-Guided Colorectal Cancer Surgery.
The receptor tyrosine kinase EphA2 promotes glutamine metabolism in tumors by activating the transcriptional coactivators YAP and TAZ.
Protein kinase A can block EphA2 receptor-mediated cell repulsion by increasing EphA2 S897 phosphorylation.
EPHA2 Blockade Overcomes Acquired Resistance to EGFR Kinase Inhibitors in Lung Cancer.
Improved efficacy of mitoxantrone in patients with castration-resistant prostate cancer after vaccination with GM-CSF-transduced allogeneic prostate cancer cells.
Genetic and pharmacologic inhibition of EPHA2 promotes apoptosis in NSCLC.
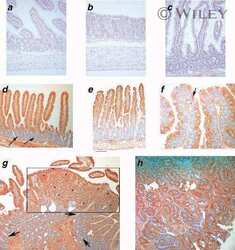
Evaluation of Eph receptor and ephrin expression within the human cornea and limbus.
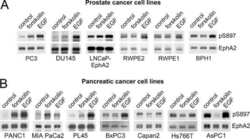
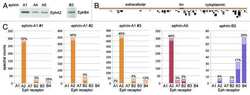
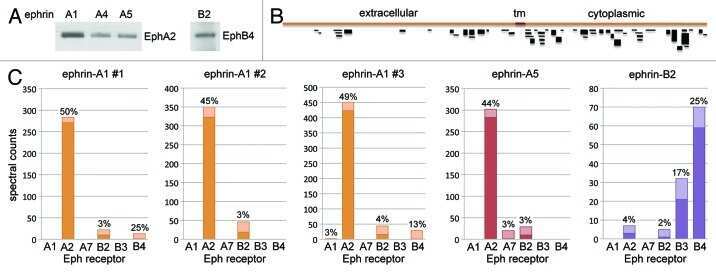
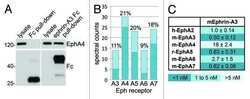
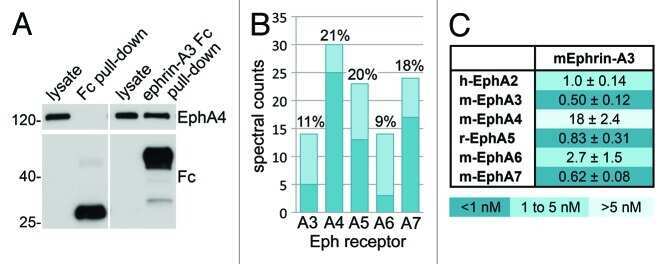
Profiling Eph receptor expression in cells and tissues: a targeted mass spectrometry approach.
Eph/ephrin profiling in human breast cancer reveals significant associations between expression level and clinical outcome.
Loss of EphA2 receptor tyrosine kinase reduces ApcMin/+ tumorigenesis.
The EphA4 receptor regulates neuronal morphology through SPAR-mediated inactivation of Rap GTPases.
Phosphotyrosine signaling networks in epidermal growth factor receptor overexpressing squamous carcinoma cells.
Zhou L, Lu X, Zhang B, Shi Y, Li Z
International journal of clinical and experimental pathology 2021;14(4):484-492
International journal of clinical and experimental pathology 2021;14(4):484-492
EphA2 Is a Clinically Relevant Target for Breast Cancer Bone Metastatic Disease.
Vaught DB, Merkel AR, Lynch CC, Edwards J, Tantawy MN, Hilliard T, Wang S, Peterson T, Johnson RW, Sterling JA, Brantley-Sieders D
JBMR plus 2021 Apr;5(4):e10465
JBMR plus 2021 Apr;5(4):e10465
Phosphorylation of PLCγ1 by EphA2 Receptor Tyrosine Kinase Promotes Tumor Growth in Lung Cancer.
Song W, Kim LC, Han W, Hou Y, Edwards DN, Wang S, Blackwell TS, Cheng F, Brantley-Sieders DM, Chen J
Molecular cancer research : MCR 2020 Nov;18(11):1735-1743
Molecular cancer research : MCR 2020 Nov;18(11):1735-1743
Targeting EphA2 impairs cell cycle progression and growth of basal-like/triple-negative breast cancers.
Song W, Hwang Y, Youngblood VM, Cook RS, Balko JM, Chen J, Brantley-Sieders DM
Oncogene 2017 Oct 5;36(40):5620-5630
Oncogene 2017 Oct 5;36(40):5620-5630
Evaluation of EphA2 and EphB4 as Targets for Image-Guided Colorectal Cancer Surgery.
Stammes MA, Prevoo HA, Ter Horst MC, Groot SA, Van de Velde CJ, Chan AB, de Geus-Oei LF, Kuppen PJ, Vahrmeijer AL, Pasquale EB, Sier CF
International journal of molecular sciences 2017 Feb 3;18(2)
International journal of molecular sciences 2017 Feb 3;18(2)
The receptor tyrosine kinase EphA2 promotes glutamine metabolism in tumors by activating the transcriptional coactivators YAP and TAZ.
Edwards DN, Ngwa VM, Wang S, Shiuan E, Brantley-Sieders DM, Kim LC, Reynolds AB, Chen J
Science signaling 2017 Dec 5;10(508)
Science signaling 2017 Dec 5;10(508)
Protein kinase A can block EphA2 receptor-mediated cell repulsion by increasing EphA2 S897 phosphorylation.
Barquilla A, Lamberto I, Noberini R, Heynen-Genel S, Brill LM, Pasquale EB
Molecular biology of the cell 2016 Sep 1;27(17):2757-70
Molecular biology of the cell 2016 Sep 1;27(17):2757-70
EPHA2 Blockade Overcomes Acquired Resistance to EGFR Kinase Inhibitors in Lung Cancer.
Amato KR, Wang S, Tan L, Hastings AK, Song W, Lovly CM, Meador CB, Ye F, Lu P, Balko JM, Colvin DC, Cates JM, Pao W, Gray NS, Chen J
Cancer research 2016 Jan 15;76(2):305-18
Cancer research 2016 Jan 15;76(2):305-18
Improved efficacy of mitoxantrone in patients with castration-resistant prostate cancer after vaccination with GM-CSF-transduced allogeneic prostate cancer cells.
van Dodewaard-de Jong JM, Santegoets SJ, van de Ven PM, Versluis J, Verheul HM, de Gruijl TD, Gerritsen WR, van den Eertwegh AJ
Oncoimmunology 2016 Apr;5(4):e1105431
Oncoimmunology 2016 Apr;5(4):e1105431
Genetic and pharmacologic inhibition of EPHA2 promotes apoptosis in NSCLC.
Amato KR, Wang S, Hastings AK, Youngblood VM, Santapuram PR, Chen H, Cates JM, Colvin DC, Ye F, Brantley-Sieders DM, Cook RS, Tan L, Gray NS, Chen J
The Journal of clinical investigation 2014 May;124(5):2037-49
The Journal of clinical investigation 2014 May;124(5):2037-49
Evaluation of Eph receptor and ephrin expression within the human cornea and limbus.
Hogerheyde TA, Stephenson SA, Harkin DG, Bray LJ, Madden PW, Woolf MI, Richardson NA
Experimental eye research 2013 Feb;107:110-20
Experimental eye research 2013 Feb;107:110-20
Profiling Eph receptor expression in cells and tissues: a targeted mass spectrometry approach.
Noberini R, Rubio de la Torre E, Pasquale EB
Cell adhesion & migration 2012 Mar-Apr;6(2):102-12
Cell adhesion & migration 2012 Mar-Apr;6(2):102-12
Eph/ephrin profiling in human breast cancer reveals significant associations between expression level and clinical outcome.
Brantley-Sieders DM, Jiang A, Sarma K, Badu-Nkansah A, Walter DL, Shyr Y, Chen J
PloS one 2011;6(9):e24426
PloS one 2011;6(9):e24426
Loss of EphA2 receptor tyrosine kinase reduces ApcMin/+ tumorigenesis.
Bogan C, Chen J, O'Sullivan MG, Cormier RT
International journal of cancer 2009 Mar 15;124(6):1366-71
International journal of cancer 2009 Mar 15;124(6):1366-71
The EphA4 receptor regulates neuronal morphology through SPAR-mediated inactivation of Rap GTPases.
Richter M, Murai KK, Bourgin C, Pak DT, Pasquale EB
The Journal of neuroscience : the official journal of the Society for Neuroscience 2007 Dec 19;27(51):14205-15
The Journal of neuroscience : the official journal of the Society for Neuroscience 2007 Dec 19;27(51):14205-15
Phosphotyrosine signaling networks in epidermal growth factor receptor overexpressing squamous carcinoma cells.
Thelemann A, Petti F, Griffin G, Iwata K, Hunt T, Settinari T, Fenyo D, Gibson N, Haley JD
Molecular & cellular proteomics : MCP 2005 Apr;4(4):356-76
Molecular & cellular proteomics : MCP 2005 Apr;4(4):356-76
No comments: Submit comment
Supportive validation
- Submitted by
- Invitrogen Antibodies (provider)
- Main image
- Experimental details
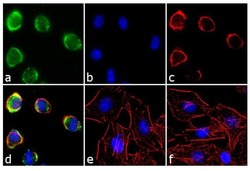
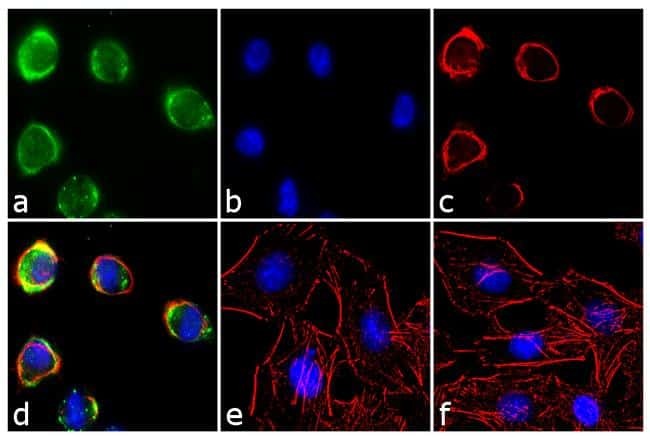
- Immunofluorescence analysis of EphA2 Receptor was performed using 90% confluent log phase A549 cells treated with UV (302 nm) for 60 minutes without recovery. The cells were fixed with 4% paraformaldehyde for 10 minutes, permeabilized with 0.1% Triton™ X-100 for 10 minutes, and blocked with 1% BSA for 1 hour at room temperature. The cells were labeled with EphA2 Receptor Rabbit Polyclonal Antibody (Product # 34-7400) at 2 µg/mL in 0.1% BSA and incubated for 3 hours at room temperature and then labeled with Goat anti-Rabbit IgG (H+L) Superclonal™ Secondary Antibody, Alexa Fluor® 488 conj µgate (Product # A27034)at a dilution of 1:2000 for 45 minutes at room temperature (Panel a: green). Nuclei (Panel b: blue) were stained with SlowFade® Gold Antifade Mountant with DAPI (Product # S36938). F-actin (Panel c: red) was stained with Alexa Fluor® 555 Rhodamine Phalloidin (Product # R415, 1:300). Panel d represents the merged image showing localization in the membrane. Panel e is untreated cell with no signal. Panel f represents control cells with no primary antibody to assess background. The images were captured at 60X magnification.
Supportive validation
- Submitted by
- Invitrogen Antibodies (provider)
- Main image
- Experimental details
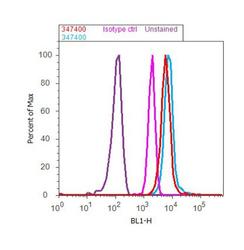
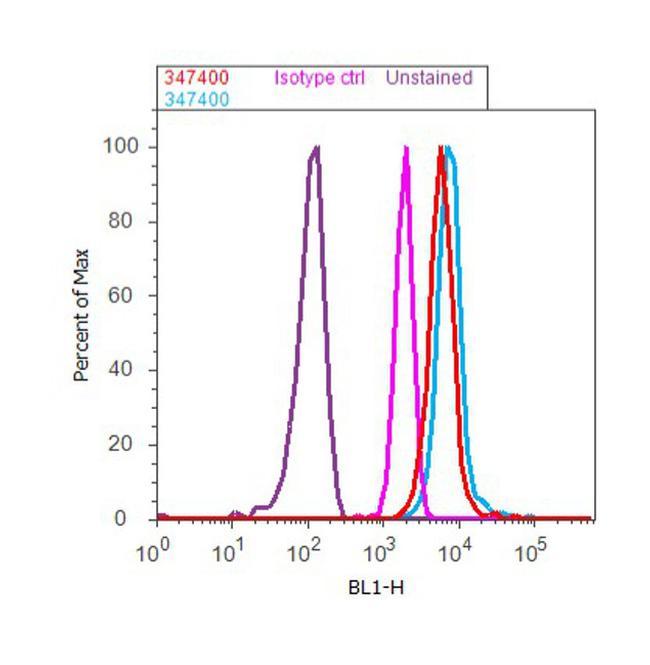
- Flow Cytometry analysis of EphA2 Receptor was done on Jurkat cells (untreated, red histogram) and Jurkat cells treated with UV for 5 hours (blue histogram). Cells were fixed with 70% ethanol for 10 minutes, permeabilized with 0.25% Triton™ X-100 for 20 minutes, and blocked with 5% BSA for 30 minutes at room temperature. Cells were labeled with EphA2 Receptor Rabbit Polyclonal Antibody (Product # 34-7400) or with rabbit isotype control (pink histogram) at 3-5 µg/million cells in 2.5% BSA. After incubation at room temperature for 2 hours, the cells were labeled with Alexa Fluor® 488 Goat Anti-Rabbit Secondary Antibody (Product # A11008) at a dilution of 1:400 for 30 minutes at room temperature. The representative 10, 000 cells were acquired and analyzed for each sample using an Attune® Acoustic Focusing Cytometer. The purple histogram represents unstained control cells.
Supportive validation
- Submitted by
- Invitrogen Antibodies (provider)
- Main image
- Experimental details
- NULL

- Submitted by
- Invitrogen Antibodies (provider)
- Main image
- Experimental details
- NULL
- Submitted by
- Invitrogen Antibodies (provider)
- Main image

- Experimental details
- NULL
- Submitted by
- Invitrogen Antibodies (provider)
- Main image

- Experimental details
- NULL
- Submitted by
- Invitrogen Antibodies (provider)
- Main image
- Experimental details
- NULL
- Submitted by
- Invitrogen Antibodies (provider)
- Main image
- Experimental details
- NULL
- Submitted by
- Invitrogen Antibodies (provider)
- Main image
- Experimental details
- NULL
- Submitted by
- Invitrogen Antibodies (provider)
- Main image
- Experimental details
- NULL

- Submitted by
- Invitrogen Antibodies (provider)
- Main image

- Experimental details
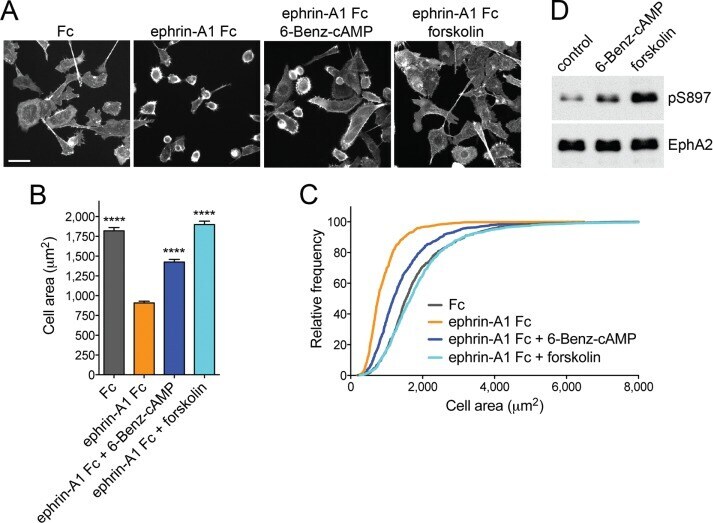
- FIGURE 4: PKA activation inhibits EphA2-dependent cell retraction. (A) Representative images of phalloidin-labeled PC3 cells stimulated for 12 min with 0.5 mug/ml control Fc or ephrin-A1 Fc or pretreated for 40 min with 20 muM forskolin or 200 muM of the PKA agonist 6-Benz-cAMP before ephrin-A1 Fc stimulation. Scale bar, 50 mum. (B) Histogram showing average cell areas +- SE under the different conditions (693 cells/condition from three experiments in each of which 77 cells/well from three wells were counted). **** p < 0.0001 for the comparison with the ephrin-A1 Fc condition by one-way analysis of variance (ANOVA) followed by Tukey's multiple comparisons test. (C) Cumulative distribution showing the relative frequencies of cells with areas smaller than indicated on the x -axis. (D) Immunoblot of PC3 cells treated with 6-Benz-cAMP or forskolin to assess the levels of EphA2 phosphorylation on S897.
- Submitted by
- Invitrogen Antibodies (provider)
- Main image
- Experimental details
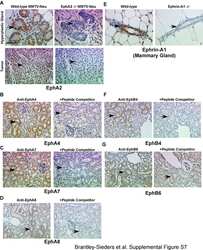
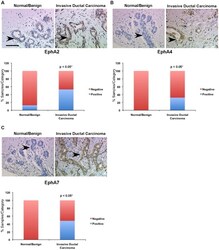
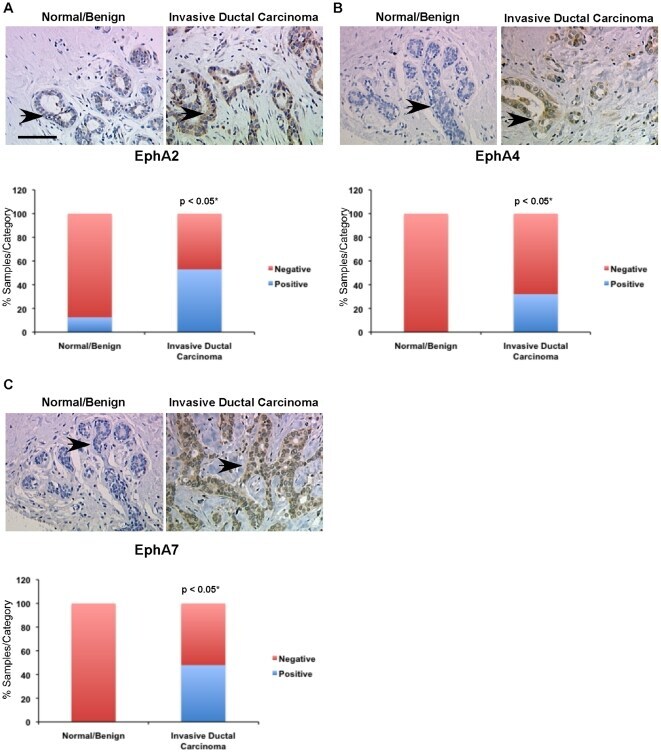
- Figure 3 Protein expression of EphA2, EphA4, and EphA7 is elevated in human ductal carcinoma relative to normal/benign tissue controls. Immunohistochemical analysis of human breast tissue microarrays (TMAs) was performed to compare relative expression in normal/benign epithelium (n = 8 samples) versus invasive ductal carcinoma (n = 126 samples) for EphA2 (A), EphA4 (B), and EphA7 (C). Arrows indicate tumor epithelium in photomicrographs. Scale bar = 50 um. *Differential expression between normal/benign and malignant epithelium was assessed using Chi Square analysis.
- Submitted by
- Invitrogen Antibodies (provider)
- Main image

- Experimental details
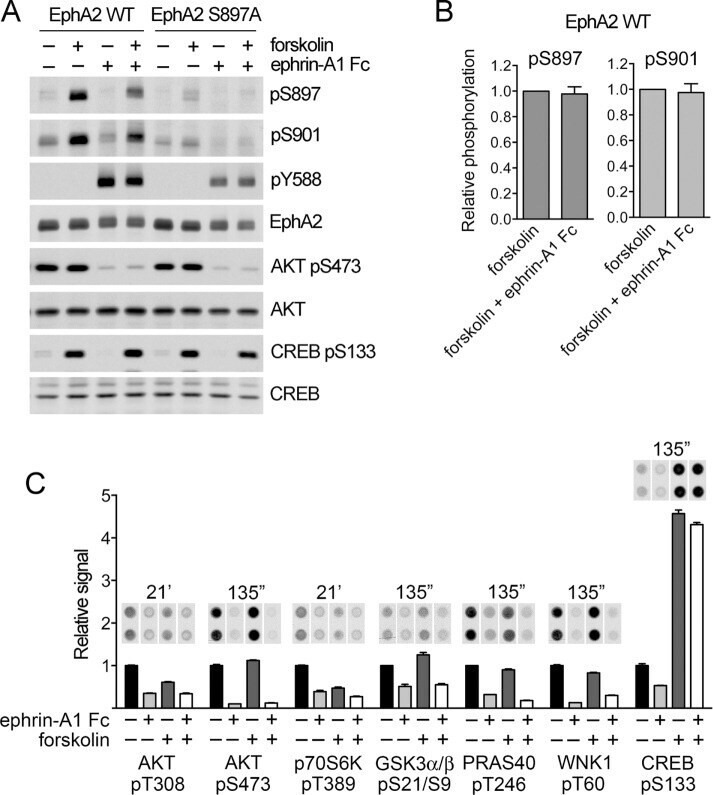
- FIGURE 6: EphA2 canonical signaling rapidly inhibits AKT but not PKA. (A) PC3 cells stably expressing EphA2 WT or the S897A mutant were treated with 20 muM forskolin for 40 min and/or 0.5 mug/ml ephrin-A1 Fc for 12 min. Lysates were probed by immunoblotting with the indicated antibodies. (B) Quantification of pS897 and pS901 phosphorylation relative to total EphA2 levels and normalized to the value in forskolin-treated cells. Averages +- SE from four independent experiments. The pS897 and pS901 levels in cells stimulated with forskolin and ephrin-A1 Fc are not significantly different from those in cells stimulated only with forskolin by one-sample t test. (C) Normalized phosphokinase array signals show the effects of ephrin-A1 Fc stimulation, with or without forskolin treatment, on the indicated phosphosites. Images of the duplicate spots on the arrays and exposure times for the autoradiographs are shown at the top. The histogram shows averages from quantification of the spots, normalized to the control condition for each phosphosite, with the error bars representing SDs.
- Submitted by
- Invitrogen Antibodies (provider)
- Main image

- Experimental details
- FIGURE 3: Forskolin and beta2-adrenoceptor agonists increase EphA2 phosphorylation on S897 by PKA as well as phosphorylation on S901. (A) PC3 cells were treated with the PKA inhibitor H89 or the PI3 kinase inhibitor wortmannin (WTM) for 1 h and with forskolin (FSK) for the last 40 min of inhibitor treatment. Cell lysates were probed by immunoblotting with the indicated antibodies. (B) Phosphokinase array signals show the effects of 40-min forskolin treatment on the indicated phosphosites. Images of the duplicate spots on the arrays and exposure times for the autoradiographs are shown at the top. The histogram shows averages from quantification of the spots, with the error bars representing SDs. (C) In vitro kinase reactions with immunoprecipitated EphA2 WT (with and without the H89 PKA inhibitor) or S897A mutant. A control immunoprecipitate is also included. The immunoblot was probed with a phospho-S897-specific antibody and reprobed for EphA2. (D) PC3 cells transfected with empty vector or with constructs encoding PKA WT, the kinase-inactive PKA K72H mutant (PKA KD), or the PKA inhibitor peptide PKI were treated for 30 min with PBS as a control or 10 muM norepinephrine, and lysates were probed with the indicated antibodies. (E) PC3 cells were treated with vehicle DMSO as a control, 20 muM forskolin, or 10 muM indicated beta-adrenoceptor agonists for 1 h. Where indicated, cells were treated with 1 muM beta-adrenoceptor antagonist propanolol (prop.) for 1 h before the 1-h trea

- Submitted by
- Invitrogen Antibodies (provider)
- Main image
- Experimental details
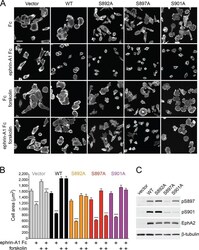
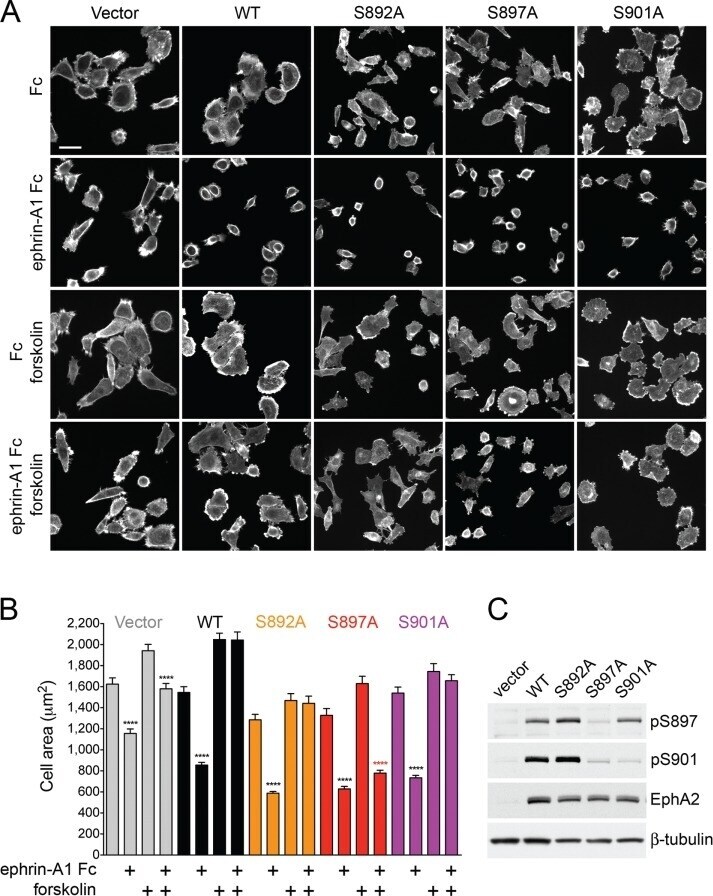
- FIGURE 5: Inhibition of EphA2-dependent cell retraction by cAMP requires S897 phosphorylation. (A) Representative images of phalloidin-labeled, EphA2-knockdown PC3 cell populations infected with pLVX-IRES-Neo lentiviral vector (Vector) or lentivirus encoding WT EphA2 (WT) or the indicated EphA2 mutants. The cells, pretreated or not for 40 min with 20 muM forskolin, were stimulated for 12 min with 0.5 mug/ml control Fc or ephrin-A1 Fc. (B) Histogram showing average cell areas +- SE for the different conditions (160 cells/condition from an experiment in which 80 cells/well from two wells were measured). **** p < 0.0001 for the comparison of ephrin-A1 Fc-stimulated cells with the corresponding Fc-stimulated cells by one-way ANOVA followed by Sidak's multiple comparisons test. (C) Immunoblot of PC3 cells transduced with empty lentiviral vector control and cells expressing the different EphA2 mutants to assess the levels of EphA2 expression and phosphorylation on S897 and S901.
- Submitted by
- Invitrogen Antibodies (provider)
- Main image
- Experimental details
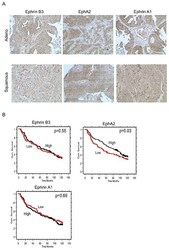
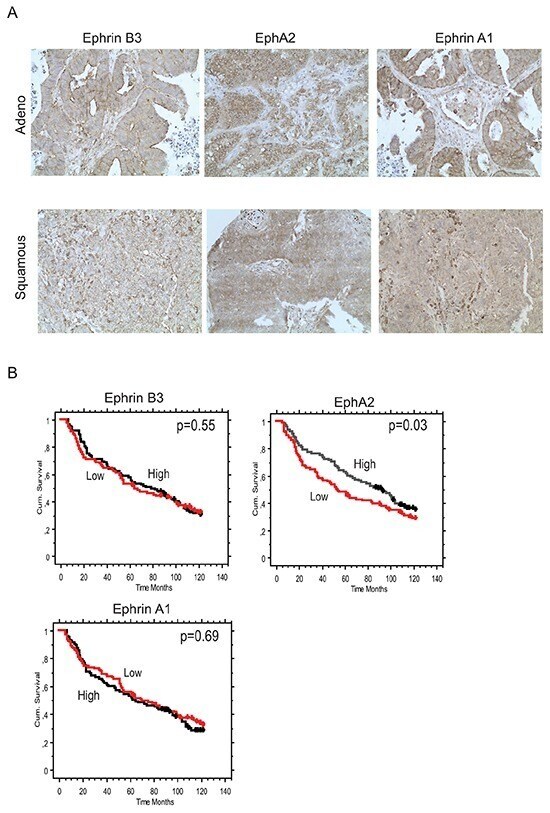
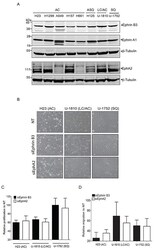
- Figure 5 Concomitant Ephrin B3, Ephrin A1 and EphA2 expression in NSCLC clinical specimens Ephrin B3, Ephrin A1 and EphA2 expression levels and their relation to patient overall survival (OS) was analyzed in a cohort of Stage IA-Stage IB NSCLC specimen using immunohistochemistry. A. Examples of Ephrin B3, EphA2 and Ephrin A1 staining in adenocarcinoma and squamous cell carcinoma NSCLC specimens. 20x magnification. B. Kaplan-Maier curves showing the association between Ephrin B3, EphA2 and Ephrin A1 expression intensity levels and OS in the NSCLC patient cohort. Red line: Low score, black line: High score. Wilcoxon test was used for statistical assessment and the p-values are indicated.
- Submitted by
- Invitrogen Antibodies (provider)
- Main image
- Experimental details
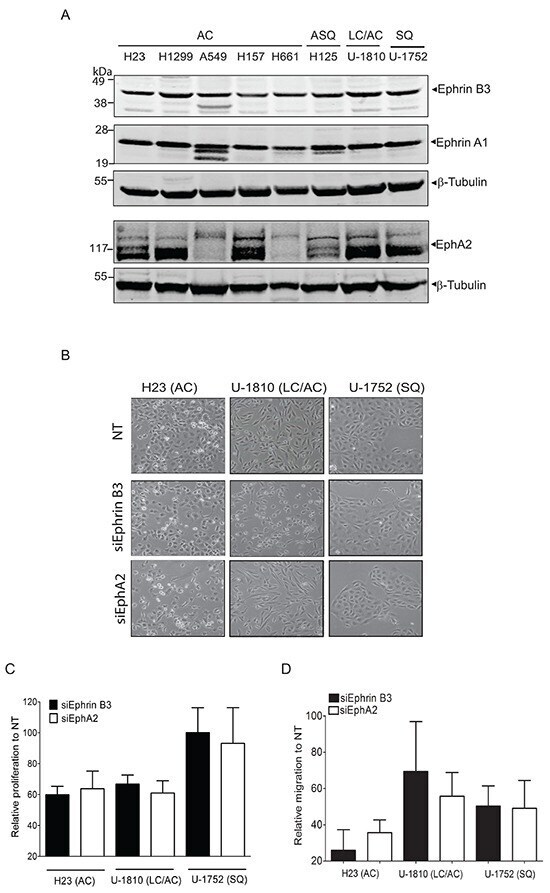
- Figure 1 Endogenous expression of Ephrin B3 or EphA2 drives proliferation and migration of NSCLC cells A. NSCLC cell lines with the histology and omit the histologies comming afterwards histology adenocarcinoma (AC), adenosquamous carcinoma (ASQ), mixed phenotype (large cell/adenocarcinoma, LC/AC) or squamous (SQ) were profiled Ephrin B3, Ephrin A1 and EphA2 expression, using western blotting. To control equal loading among the samples, beta-Tubulin was used. B-D. H23 (AC), U-1810 (LC/AC) or U-1752 (SQ) were treated with Ephrin B3-, EphA2- or non-targeting (NT) siRNAs for 24 h followed by either 24h-48h post incubation (24 h: H23, 48h: U-1810 and U-1752). The effects of Ephrin B3 or EphA2 siRNA knockdown on morphology (B) , proliferation (C) , migration (D) were analyzed. (B) Photos showing effects on cell morphology in H23 (AC), U-1810 (LC/AC) or U-1752 (SQ). ( C ) Cell proliferation was quantified by counting living H23 (AC), U-1810 (LC/AC) or U-1752 (SQ) cells, by Trypan blue. Presented results are the mean +- SD of three experiments. (D) Migration capacity was analyzed in H23, U-1810 and U-1752 at 48h post siRNA removal, after 24h of serum starvation and after 20h post seeding in a transwell assay. The number of cells on the membrane in the inserts were stained and counted. Data is given as % of migrating cells relative to NT obtained in three biological replicates and bars represent SD.
- Submitted by
- Invitrogen Antibodies (provider)
- Main image
- Experimental details
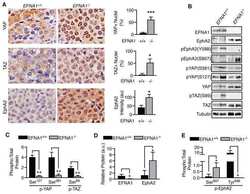
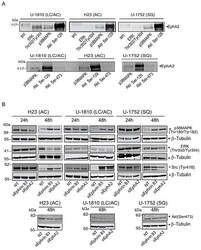
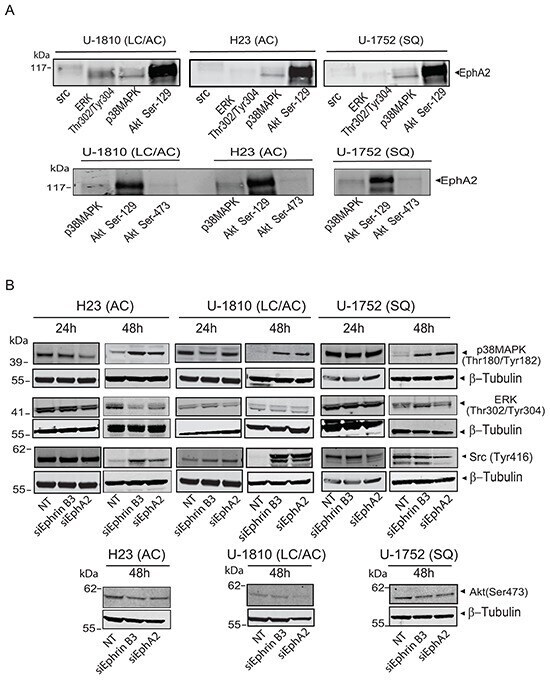
- Figure 4 Ephrin B3 and EphA2 interact and control multiple proliferative kinases A. The interactions of EphA2 with total Src, phospho-ERK (Thr302/Tyr304), total p38MAPK, phospho-Akt (Ser129) and phospho-Akt (Ser473), were studied by immunoprecipitation in untreated U-1810, H23 and U-1752 NSCLC cell line. The resulting immunocomplexes were analyzed by western blot, with antibody against EphA2. B. H23 (AC), U-1810 (LC/AC) and U-1752 (SQ) cells were treated with Ephrin B3-, EphA2- or non-targeting (NT) siRNA. Indicated proteins were examined by western blot at 24 h or 48 h post siRNA. To control equal loading among the samples beta-Tubulin was used.
- Submitted by
- Invitrogen Antibodies (provider)
- Main image
- Experimental details
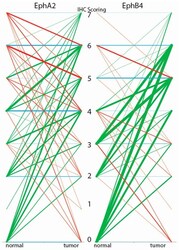
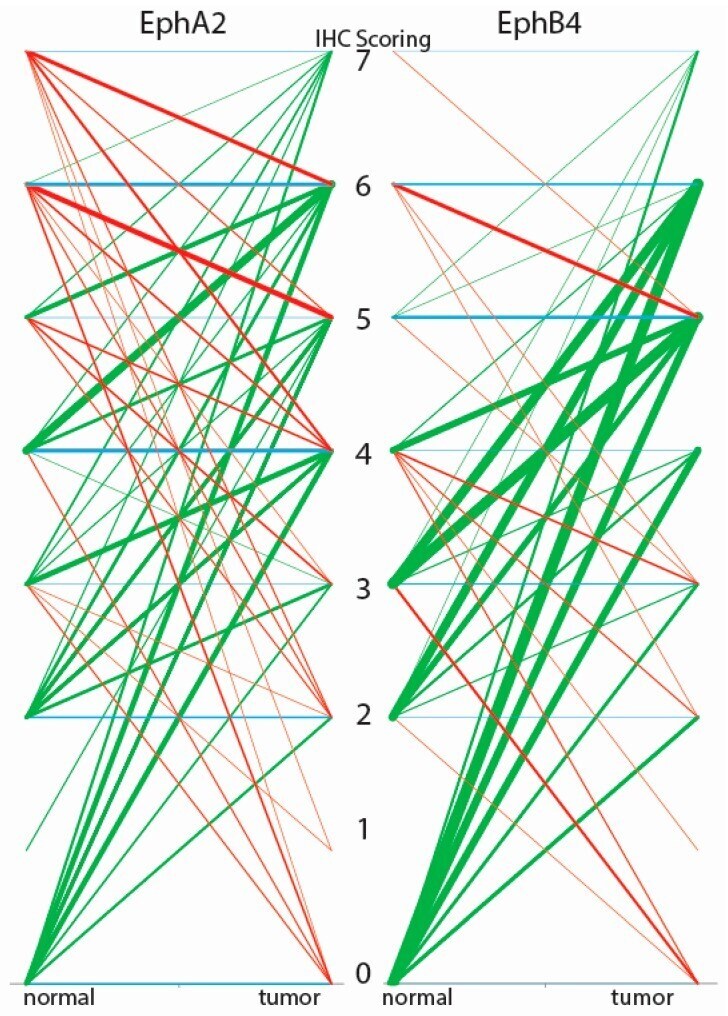
- Figure 2 N/T scorings diagram for the tissue microarray (TMA) stained for EphA2 and EphB4. Green = higher score in tumor than normal tissue; Red = higher score in normal tissue than tumor tissue; Blue = no difference in score between normal and tumor tissue. The thickness of the line represents the number of patients, the thicker the line the more patients. The numbers 0-7 represent the IHC scoring values.
- Submitted by
- Invitrogen Antibodies (provider)
- Main image

- Experimental details
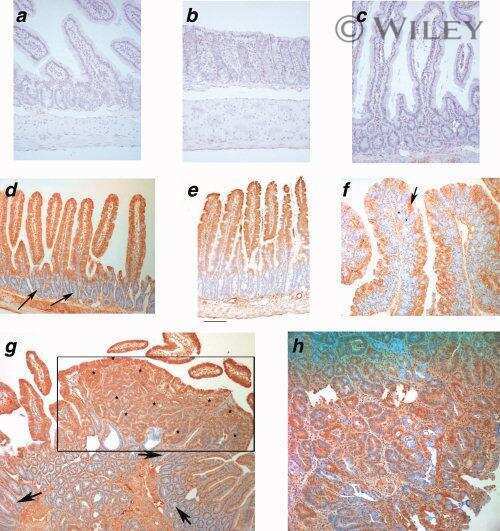
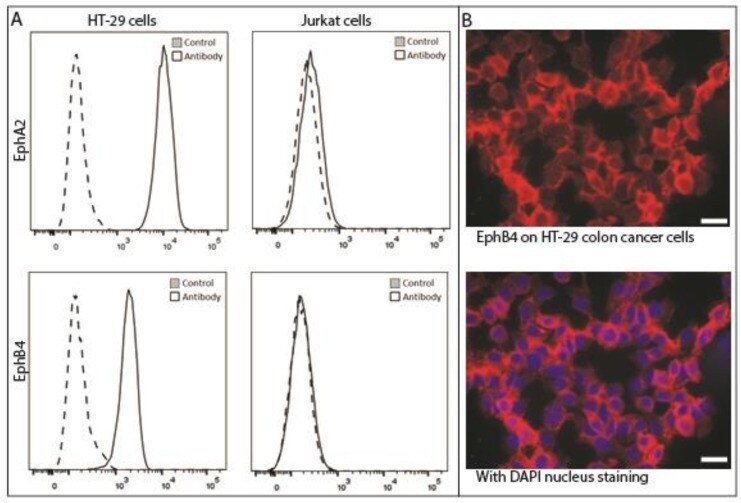
- Figure 3 Presence of EphA2 and EphB4 on colon cancer cells. ( A ) Flow cytometry of HT-29 shows abundant presence of both EphA2 and EphB4 compared with negative Jurkat cells; ( B ) Immunofluorescence of EphB4 indicates a membranous staining on HT-29 colon cancer cells grown in monolayer. X-axes indicate fluorescence intensity, the scale bar represents 20 micrometers.
- Submitted by
- Invitrogen Antibodies (provider)
- Main image

- Experimental details
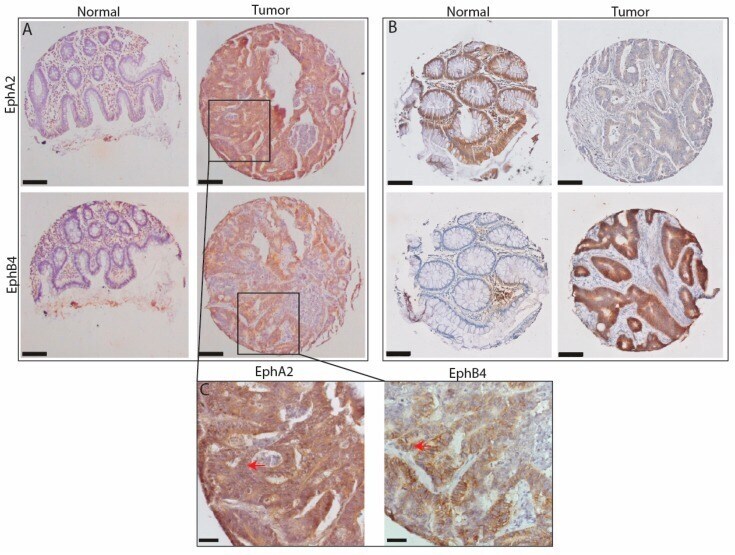
- Figure 1 Two examples of staining patterns for EphA2 and EphB4 in sets of tumor and normal tissue from patients with colon cancer. ( A ) shows the most generally found pattern, with low expression of both proteins in normal tissue and abundant expression in tumor tissue; ( B ) shows an aberrant expression pattern (as indicated in Figure 2 ), with extremely high EphA2 expression in normal tissue and absence of staining in the corresponding tumor tissue. The scale bars represent 150 micrometers; ( C ) shows 40x enlargements of the sections indicated in A. Red arrows indicate membranous staining. The scale bar represents 30 micrometer.
- Submitted by
- Invitrogen Antibodies (provider)
- Main image
- Experimental details
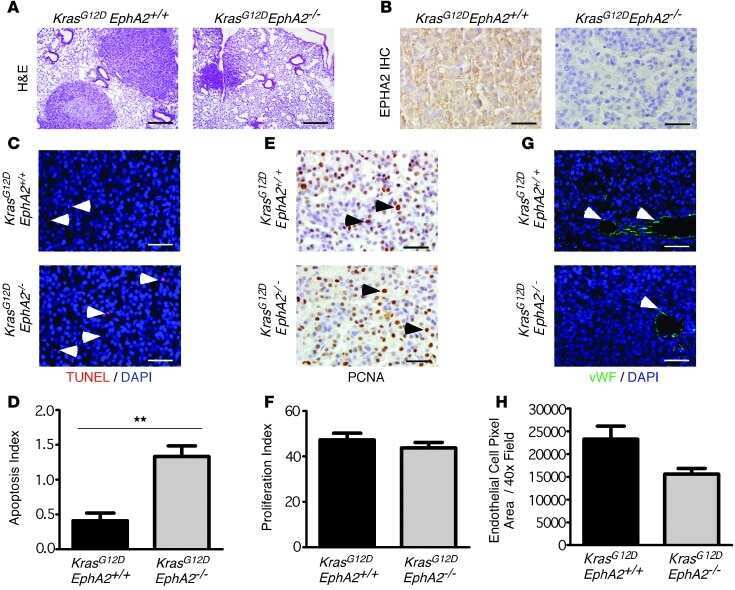
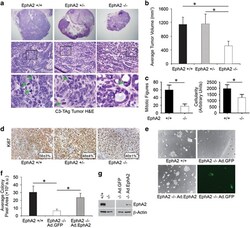
- Figure 4 EphA2-deficiency impairs growth and progression in the C3-TAg transgenic model of basal-like breast cancer in vivo . We crossed C3-TAg mice with EphA2-deficient mice, generating a cohort of C3-TAg wild-type (EphA2 +/+ ), heterozygous (EphA2 +/- ) and EphA2-deficient (EphA2-/-) mice. ( a ) EphA2-deficient mice formed significantly smaller tumors than wild-type or heterozygous littermates. ( b ) Tumor volume was significantly decreased in EphA2-deficient animals relative to littermate controls (N=9 +/+ , 11 +/- and 9 -/- animals; * P

- Submitted by
- Invitrogen Antibodies (provider)
- Main image

- Experimental details
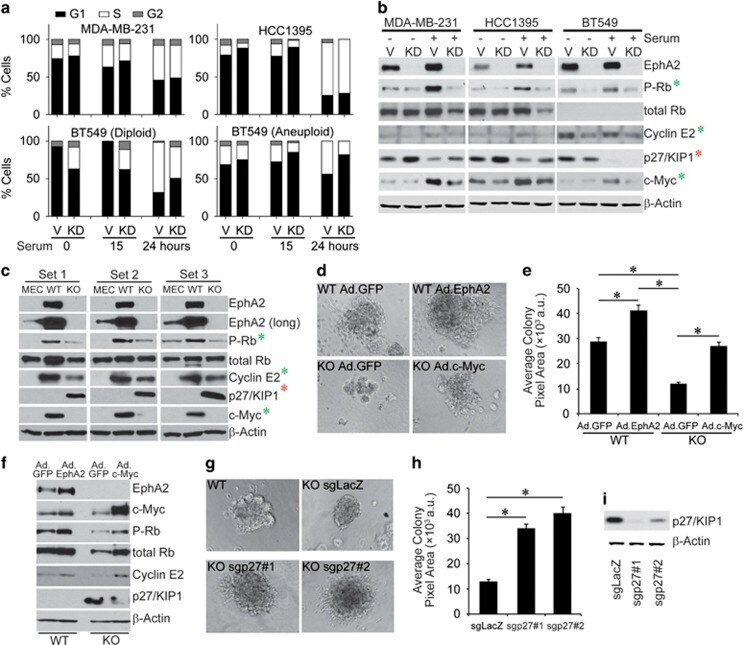
- Figure 5 EphA2 loss impairs cell cycle progression through S-phase in TNBC cells. ( a , b ) MDA-MB-231, HCC1395 and BT549 vector control (V) and EphA2 shRNA knockdown (KD) lines were starved then serum-stimulated for 0, 15 or 24 h prior to propidium iodide labeling and FACS analysis for DNA content. ( a ) All three human shEphA2 knockdown lines showed a general decrease in the percentage of cells in S-phase relative to vector controls: MDA-MB-231 at 15 h post serum stimulation, HCC1395 at 0 and 15 h post serum stimulation, and aneuploidy BT549 at 0, 15 and 24 h post serum stimulation. ( b ) Immunoblot analysis of S-phase cell cycle regulators in vector (V) control versus EphA2 shRNA knockdown (KD) human TNBC lines under basal (serum-starved, -) conditions versus stimulation with serum (+) for 15 h; ( c ) and three independent isolates of wild-type (WT) and EphA2-deficient (KO) C3-TAg cells versus primary mouse mammary epithelial cells (MEC). We observed decreased levels of P-Rb, c-Myc and cyclin E2 (green *) and increased expression of p27/KIP1 cell cycle inhibitor (red *) in KD and KO cells relative to controls. Data were from three independent experiments. ( d , e ) Adenovirus-mediated overexpression of EphA2 (Ad.EphA2) significantly increased colony size of wild-type (WT) C3-TAg cells in three-dimensional spheroid culture relative to adenovirus GFP (Ad.GFP) control (* P
- Submitted by
- Invitrogen Antibodies (provider)
- Main image
- Experimental details
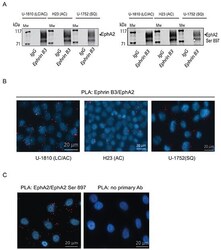
- Figure 3 Ephrin B3 is a ligand of multiple EphA receptors The interactions of Ephrin B3 with Ephs were studied by immunoprecipitation in untreated NSCLC cells as indicated. A. Ephrin B3was immunoprecipitated from lysates of U-1810, H23, and U-1752 cells and the resulting immunocomplexes studied in western blot by antibodies against total EphA2 or EphA2 Ser897. B. The interaction between Ephrin B3 and EphA2 were analyzed by PLA in situ in untreated U-1810, H23 or U1-752 cells. Slides were incubated with Ephrin B3 and EphA2 antibodies and probed with Texas red (red) PLA probes with DAPI (blue) used for counterstaining cell nuclei. C. The interaction between total EphA2 and Ser897 phosphorylated EphA2 was verified with PLA in U-1810 cells. Texas-red labelled PLA probes were added (red) with DAPI (blue) used for counterstaining of nuclei. As a control U-1810 cells were used in PLA reactions omitting the primary antibodies. D. NSCLC cell lines were profiled for the expression of EphA2 Ser897, using western blotting. To control equal loading among the samples, beta-Tubulin was used. E. The interactions of Ephrin B3 with Ephs were studied by immunoprecipitation in untreated NSCLC cells as indicated. Ephrin B3was immunoprecipitated from cell lysates of U-1810, H23, U-1810 and U-1752 and the resulting immunocomplexes analyzed by western blot with antibodies against EphA3, EphA4 and EphA5.
