Explore
 Validate
 Learn
Learn Western blot
Antibody data
- Antibody Data
- Antigen structure
- References [2]
- Comments [0]
- Validations
- Western blot [1]
- Immunocytochemistry [1]
- Immunohistochemistry [3]
- Other assay [2]
Submit
Validation data
Reference
Comment
Report error
- Product number
- PA5-83748 - Provider product page

- Provider
- Invitrogen Antibodies
- Product name
- PIK3CD Polyclonal Antibody
- Antibody type
- Polyclonal
- Antigen
- Recombinant full-length protein
- Description
- Immunogen sequence: AECSRLLQIL ELGRHSECVH VTEEEQLQLR EILERRGSGE LYEHEKDLVW KLRHEVQEHF PEALARLLLV TKWN
- Reactivity
- Human
- Host
- Rabbit
- Isotype
- IgG
- Vial size
- 100 µL
- Concentration
- 0.2 mg/mL
- Storage
- Store at 4°C short term. For long term storage, store at -20°C, avoiding freeze/thaw cycles.
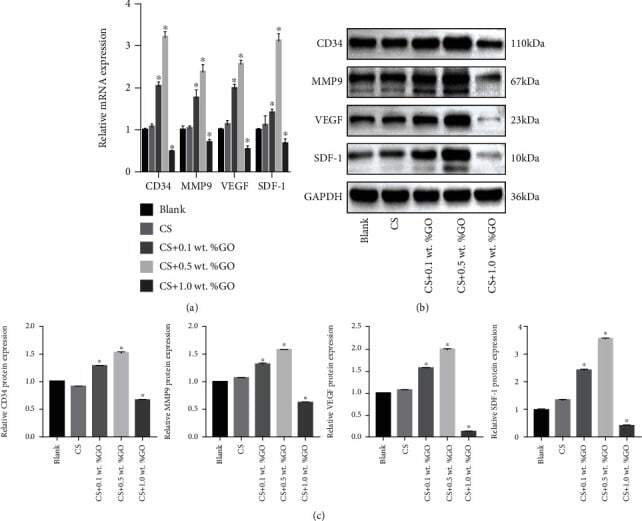
Submitted references Biocompatibility and Angiogenic Effect of Chitosan/Graphene Oxide Hydrogel Scaffolds on EPCs.
Hyoscyamus albus nortropane alkaloids reduce hyperglycemia and hyperinsulinemia induced in HepG2 cells through the regulation of SIRT1/NF-kB/JNK pathway.
Zhang L, Li X, Shi C, Ran G, Peng Y, Zeng S, He Y
Stem cells international 2021;2021:5594370
Stem cells international 2021;2021:5594370
Hyoscyamus albus nortropane alkaloids reduce hyperglycemia and hyperinsulinemia induced in HepG2 cells through the regulation of SIRT1/NF-kB/JNK pathway.
Kowalczuk A, Bourebaba N, Kornicka-Garbowska K, Turlej E, Marycz K, Bourebaba L
Cell communication and signaling : CCS 2021 May 25;19(1):61
Cell communication and signaling : CCS 2021 May 25;19(1):61
No comments: Submit comment
Supportive validation
- Submitted by
- Invitrogen Antibodies (provider)
- Main image
- Experimental details
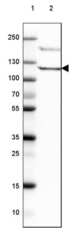
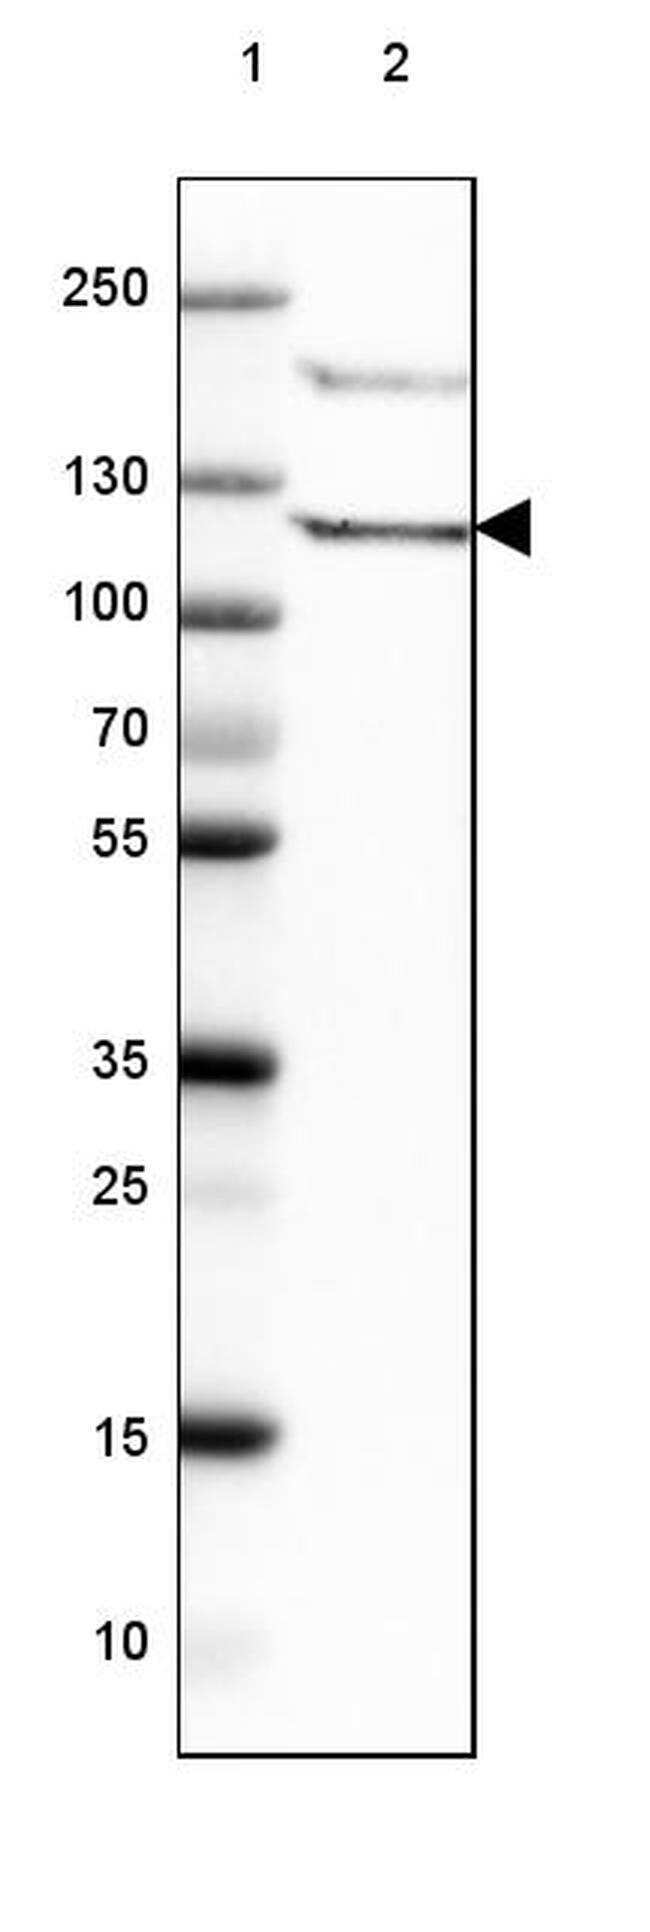
- Western blot analysis of PIK3CD by a PIK3CD polyclonal antibody (Product # PA5-83748). Lane 1: Marker [kDa] 250, 130, 100, 70, 55, 35, 25, 15, 10 Lane 2: Human Tonsil tissue.
Supportive validation
- Submitted by
- Invitrogen Antibodies (provider)
- Main image
- Experimental details
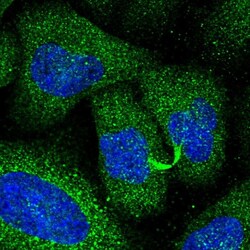
- Immunofluorescent analysis of PIK3CD in U-2 OS cells using a PIK3CD polyclonal antibody (Product # PA5-83748). The analysis shows localization to cytokinetic bridge & vesicles.

Supportive validation
- Submitted by
- Invitrogen Antibodies (provider)
- Main image
- Experimental details
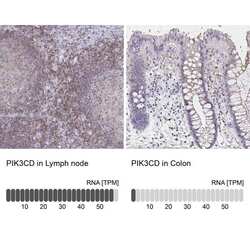
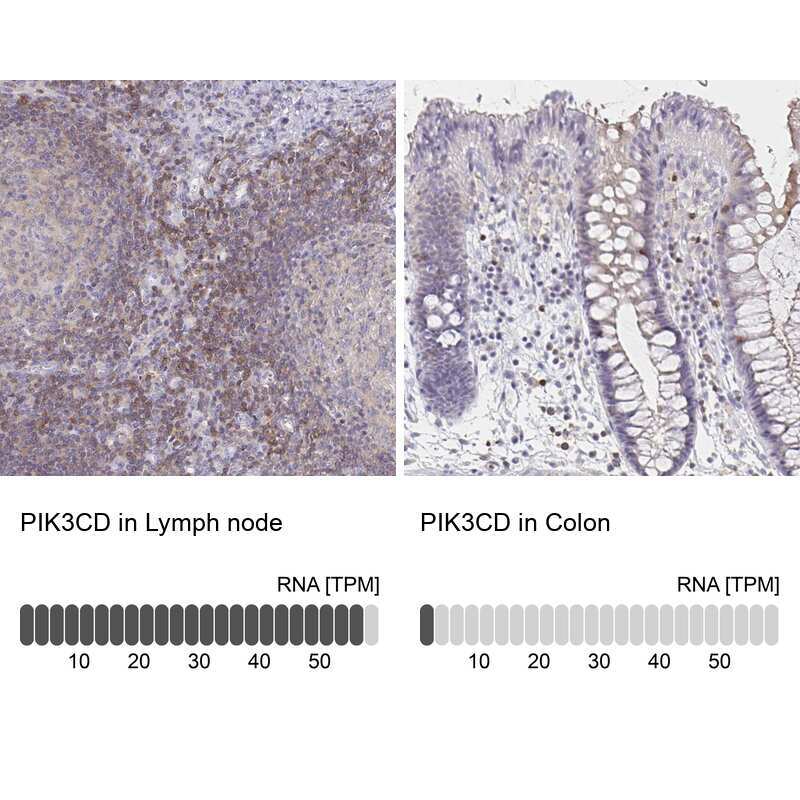
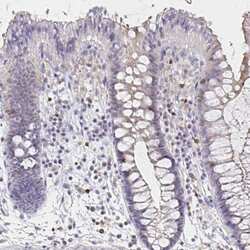
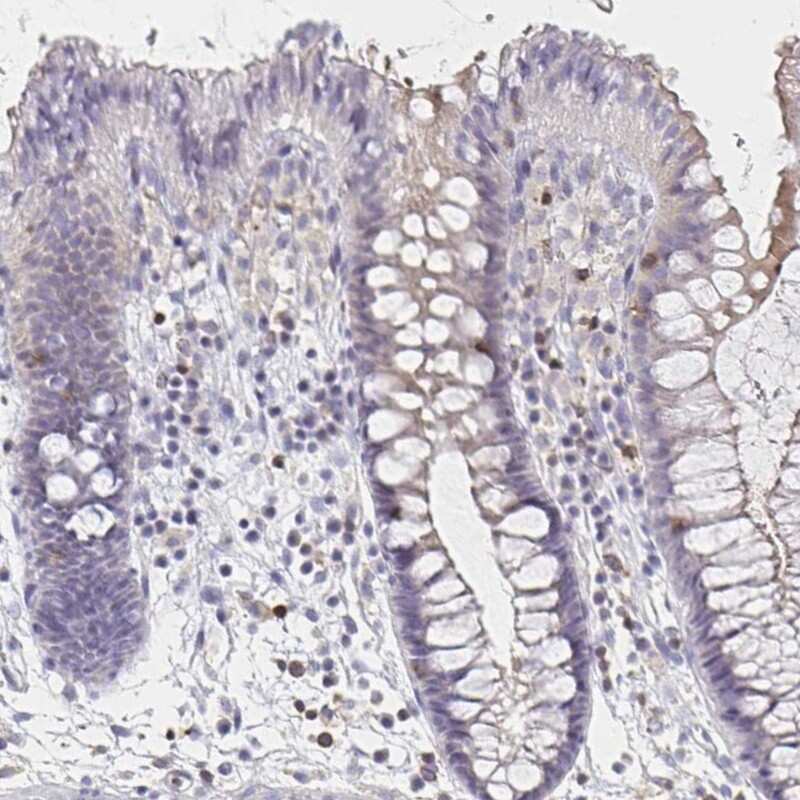
- Immunohistochemical analysis of PIK3CD in human lymph node and colon tissues using a PIK3CD polyclonal antibody (Product # PA5-83748). Corresponding RNA-seq data are presented for the same tissues.
- Submitted by
- Invitrogen Antibodies (provider)
- Main image
- Experimental details
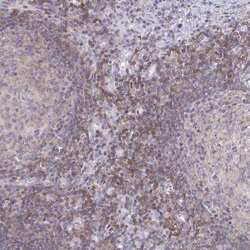
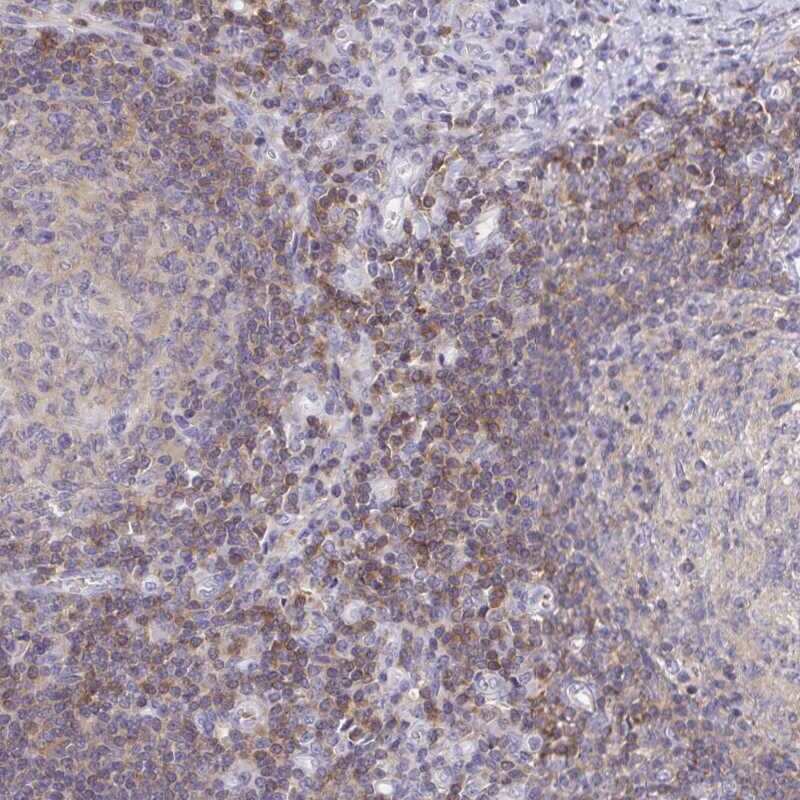
- Immunohistochemical analysis of PIK3CD in human lymph node using a PIK3CD polyclonal antibody (Product # PA5-83748). The analysis shows high expression.
- Submitted by
- Invitrogen Antibodies (provider)
- Main image
- Experimental details
- Immunohistochemical analysis of PIK3CD in human colon using a PIK3CD polyclonal antibody (Product # PA5-83748). The analysis shows low expression as expected.
Supportive validation
- Submitted by
- Invitrogen Antibodies (provider)
- Main image

- Experimental details
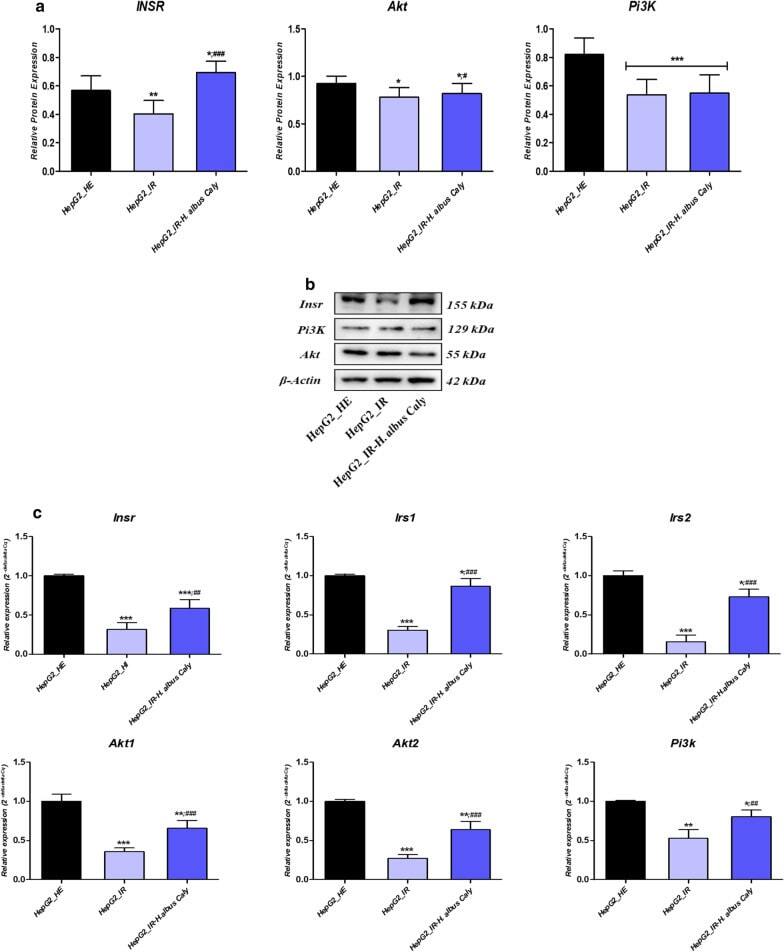
- Fig. 7 Effect of total calystegines on collapsed insulin signalling pathway in HI/HG HepG2 cells. a Quantitative analysis of insulin signalling-related proteins expression using western blot. b Representative blots images of insulin signalling-related proteins profiling. c Relative genes expression of key insulin signalling regulators. Representative data from three independent experiments are shown +- SD (n = 3). An asterisk (*) indicates a comparison of IR group to untreated healthy cells. A hashtag (#) indicates a comparison of IR group pre-treated with calystegines to IR untreated healthy cells. */# p < 0.05, **/## p < 0.01, ***/### p < 0.001. HepG2_HE: HepG2 healthy untreated cells; HepG2_IR: Insulin resistant HepG2 cells exposed to high concentrations of insulin and glucose. HepG2_IR- H. albus _Caly: Insulin resistant HepG2 cells exposed to high concentrations of insulin and glucose and pre-treated with 250 mug/ml calystegines extracted from Hyoscyamus albus seeds
- Submitted by
- Invitrogen Antibodies (provider)
- Main image
- Experimental details
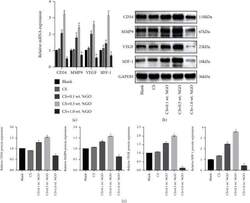
- Figure 7 (a) qRT-PCR analysis of the CD34, VEGF, MMP9, and SDF-1 expressions in each group. (b) Western blot analysis results of CD34, VEGF, MMP9, and SDF-1 protein expressions in each group. * P < 0.05 compared with the blank group.