Explore
 Validate
 Learn
Learn Immunohistochemistry
Antibody data
- Antibody Data
- Antigen structure
- References [1]
- Comments [0]
- Validations
- Immunohistochemistry [1]
- Other assay [1]
Submit
Validation data
Reference
Comment
Report error
- Product number
- PA5-58610 - Provider product page

- Provider
- Invitrogen Antibodies
- Product name
- ANO6 Polyclonal Antibody
- Antibody type
- Polyclonal
- Antigen
- Recombinant full-length protein
- Description
- Immunogen sequence: EEDDDDGDIV LENLGQTIVP DLGSLESQHD FRTPEFEEFN GKPDSLFFND GQRRIDFVLV YEDESRKETN KKGTNEKQRR KRQAYESNLI CHGLQLEATR SVLD
- Concentration
- 0.3 mg/mL
Submitted references Anoctamin 5/TMEM16E facilitates muscle precursor cell fusion.
Whitlock JM, Yu K, Cui YY, Hartzell HC
The Journal of general physiology 2018 Nov 5;150(11):1498-1509
The Journal of general physiology 2018 Nov 5;150(11):1498-1509
No comments: Submit comment
Supportive validation
- Submitted by
- Invitrogen Antibodies (provider)
- Main image
- Experimental details
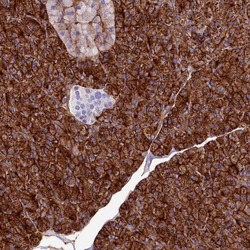
- Immunohistochemical staining of ANO6 in human pancreas shows strong cytoplasmic and membranous positivity in exocrine glandular cells. Samples were probed using an ANO6 Polyclonal Antibody (Product # PA5-58610).

Supportive validation
- Submitted by
- Invitrogen Antibodies (provider)
- Main image
- Experimental details
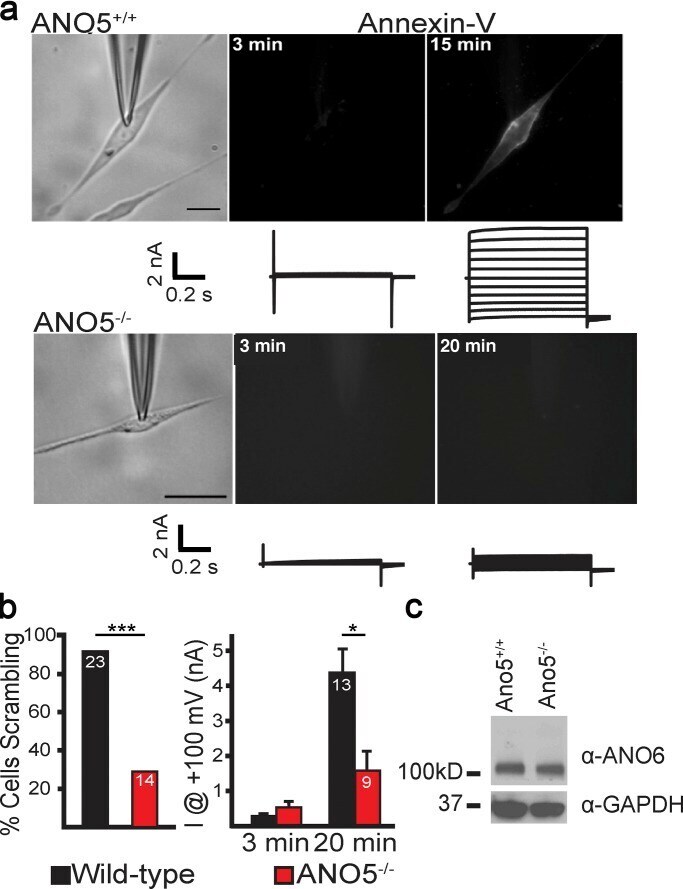
- Figure 5. Ano5 -/- muscle cells exhibit perturbed Ca 2+ -PLS and PLS-associated ionic current. (a) Simultaneous whole-cell patch clamp and annexin V-Alexa Fluor 568 binding of primary MPCs differentiated for ~24 hr. Images on the left show bright-field micrographs of patch-clamped MPCs. Center and right images show annexin V-Alexa Fluor 568 binding. Scale bars, 10 mum. Below the images are ionic currents recorded using voltage steps between +100 and -100 mV in 20-mV increments from a holding potential of 0 mV. (b) Quantification of Ca 2+ -PLS in MPCs (left), and average current of differentiated myoblasts at +100 mV (right). The statistical difference in Ca 2+ -PLS between genotypes was calculated using a Fisher exact test (***, P = 0.0001). The current at 20 min was statistically evaluated using a paired Student's t test (*, P = 0.026). The white numbers in the columns indicate the number of cells assayed. The same cells were measured at 3 and 20 min. Error bars indicate SEM. (c) Western blot of native ANO6 levels in wild-type and Ano5 knockout MPCs differentiated for ~24 h.