MA5-23759
antibody from Invitrogen Antibodies
Targeting: CXCL12
PBSF, SCYB12, SDF-1a, SDF-1b, SDF1, SDF1A, SDF1B, TLSF-a, TLSF-b, TPAR1
Antibody data
- Antibody Data
- Antigen structure
- References [4]
- Comments [0]
- Validations
- Flow cytometry [1]
- Other assay [4]
Submit
Validation data
Reference
Comment
Report error
- Product number
- MA5-23759 - Provider product page

- Provider
- Invitrogen Antibodies
- Product name
- CXCL12 Monoclonal Antibody (79018)
- Antibody type
- Monoclonal
- Antigen
- Recombinant full-length protein
- Description
- Reconstitute at 0.5 mg/mL in sterile PBS.
- Reactivity
- Human, Mouse
- Host
- Mouse
- Isotype
- IgG
- Antibody clone number
- 79018
- Vial size
- 500 µg
- Concentration
- 0.5 mg/mL
- Storage
- -20° C, Avoid Freeze/Thaw Cycles
Submitted references Elevated CXCL12 in the plasma membrane of locally advanced rectal cancer after neoadjuvant chemoradiotherapy: a potential prognostic marker.
S100A9-CXCL12 activation in BRCA1-mutant breast cancer promotes an immunosuppressive microenvironment associated with resistance to immunotherapy.
Single-Cell RNA-Sequencing Reveals Lineage-Specific Regulatory Changes of Fibroblasts and Vascular Endothelial Cells in Keloids.
CXCL12/CXCR4 axis supports mitochondrial trafficking in tumor myeloma microenvironment.
Kim S, Yeo MK, Kim JS, Kim JY, Kim KH
Journal of Cancer 2022;13(1):162-173
Journal of Cancer 2022;13(1):162-173
S100A9-CXCL12 activation in BRCA1-mutant breast cancer promotes an immunosuppressive microenvironment associated with resistance to immunotherapy.
Li J, Shu X, Xu J, Su SM, Chan UI, Mo L, Liu J, Zhang X, Adhav R, Chen Q, Wang Y, An T, Zhang X, Lyu X, Li X, Lei JH, Miao K, Sun H, Xing F, Zhang A, Deng C, Xu X
Nature communications 2022 Mar 18;13(1):1481
Nature communications 2022 Mar 18;13(1):1481
Single-Cell RNA-Sequencing Reveals Lineage-Specific Regulatory Changes of Fibroblasts and Vascular Endothelial Cells in Keloids.
Liu X, Chen W, Zeng Q, Ma B, Li Z, Meng T, Chen J, Yu N, Zhou Z, Long X
The Journal of investigative dermatology 2022 Jan;142(1):124-135.e11
The Journal of investigative dermatology 2022 Jan;142(1):124-135.e11
CXCL12/CXCR4 axis supports mitochondrial trafficking in tumor myeloma microenvironment.
Giallongo C, Dulcamare I, Tibullo D, Del Fabro V, Vicario N, Parrinello N, Romano A, Scandura G, Lazzarino G, Conticello C, Li Volti G, Amorini AM, Musumeci G, Di Rosa M, Polito F, Oteri R, Aguennouz M, Parenti R, Di Raimondo F, Palumbo GA
Oncogenesis 2022 Jan 21;11(1):6
Oncogenesis 2022 Jan 21;11(1):6
No comments: Submit comment
Supportive validation
- Submitted by
- Invitrogen Antibodies (provider)
- Main image

- Experimental details
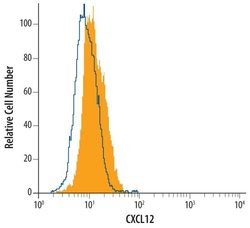
- Flow cytometric analysis of HT1080 human fibrosarcoma cell line was stained with human/mouse CXCL12/SDF1 Monoclonal (Product # MA5-23759, filled histogram) or isotype control antibody (open histogram), followed by Phycoerythrin-conjugated Anti-mouse IgG F (ab')2 Secondary Antibody.
Supportive validation
- Submitted by
- Invitrogen Antibodies (provider)
- Main image

- Experimental details
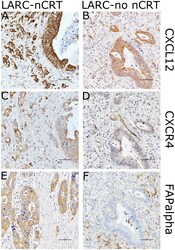
- Figure 3 Images showing immunohistochemical staining of CXCL12, CXCR4, and FAPalpha in the case of each pathways in locally advanced rectal cancer (LARC) after neoadjuvant chemoradiotherapy (LARC-nCRT) (A,C,E) and LARC with no nCRT (LARC-no nCRT) (B,D,E). In the case of LARC-nCRT, the expression of CXCL12, CXCR4, and FAPalpha is higher than in the case of LARC-no nCRT (original magnification 400x ; scale bar= 50 um).
- Submitted by
- Invitrogen Antibodies (provider)
- Main image

- Experimental details
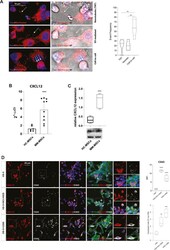
- Fig. 2 Myeloma PCs activate expression of CXCL12 and CX43 in HS-5 cell line. A Representative confocal microscopy images show that mitochondria were transferred to U266 cells via Tunneling Nanotubes (TNT), extracellular vesicles (EV), and cell-to-cell contact. Bar graphs show the % of events mediated by TNT, EVs, or cell-to-cell contact over the total number of transfer events observed. B mRNA expression of CXCL12 was evaluated in HC-MSCs ( n = 6) and MM-MSCs ( n = 10). C Western blot analysis of CXCL12 expression in MSC from HC- and MM-patients. beta-actin protein was used as total protein loading reference. For analysis, the optical density of the bands was measured using Scion Image software. D The left panel shows representative pictures of HS-5 cells cultured alone or with NCI-H929 or U266 cell lines; cells were stained for CXCL12 (red) and CX43 (white). Quantification of CX43 MFI and of the colocalization index was reported. Bars indicate the standard error means (** p < 0.01; *** p < 0.001; **** p < 0.0001).
- Submitted by
- Invitrogen Antibodies (provider)
- Main image

- Experimental details
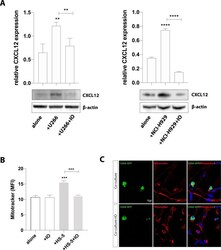
- Fig. 3 CX43 regulates PC-induced expression of CXCL12 in HS-5 cells and mediates mitochondrial transfer from MSCs to MM cells. A Western blot analysis of CXCL12 expression in HS-5 cells cultured alone or with MM cells in presence or not with IO. beta-actin protein was used as total protein loading reference. For analysis, the optical density of the bands was measured using Scion Image software. B MitoTracker labeled U266 and HS-5 cells were co-cultured in presence or not of IO for 24 h. MitoTracker red fluorescence was measured in U266 cells (CD45+ gated) by flow cytometry. U266 cells cultured alone were used as control. C Representative images show that inhibition of CX43 decreased the uptake of mitochondria (red) from MM-MSCs by U266-GFP cells (green) after 24 h of co-culture. The data are presented as means +- SD of three independent experiments (** p < 0.01; *** p < 0.001; **** p < 0.0001).
- Submitted by
- Invitrogen Antibodies (provider)
- Main image

- Experimental details
- Positive regulation loop between S100a9 and Cxcl12 amplifies oncogenic signals in Brca1-MT epithelial cells. a The Venn diagram analysis of upregulated genes in G600, Over-Expression- S100a9 in B477 cells (B477-OE-S100a9), and down-regulated genes in G600 cells expressing sg S100A9 (G600-sg S100a9 ) ( n = 3 biological replicates/group). b KEGG Pathway analysis with 453 common ( p value was calculated by hypergeometric test with KOBAS 3.0 website). c Top 20 differentially expressed genes by comparison of the gene expression profiles of four different group cells, including B477-Ctr (B1-3), B477-OE S100a9 (P1-3), G600-Ctr (G1-3), and G600-sg S100a9 (G10-1-3) (the heatmap was drawn by Morpheus website and clustered by One minus Pearson Correlation). d , e Expressions of S100a9 and Cxcl12 at mRNA level by qPCR ( d ) at protein levels by western blotting ( e ) from four group cells in c . f Protein levels of S100a9, Cxcl12 and pStat3 in OE- S100a9 -EMT6 cells, sg S100a9 /OE- S100a9 -EMT6, and sg Cxcl12 /OE- S100a9 -EMT6 cells. g Protein levels of S100a9, Cxcl12 and pStat3 in OE- S100a9 -EMT6 and G600 cells without or with S100A9 inhibitor, Tasquinimod (Tas-50 muM) by western blotting. h Protein levels of S100a9, Cxcl12, and pStat3 in WT (B477) cells with the expression of OE- S100a9 , OE- S100a9 /sg Cxcl12 , or OE- Cxcl12 by western blotting. i , k Protein levels of Cxcl12 in B477 ( i ) cells with OE- S100a9 and in G600 ( k ) cells expressing sg S100a9 at different time courses (0
 Explore
 Validate
 Learn
Learn ELISA
ELISA Flow cytometry