Antibody data
- Antibody Data
- Antigen structure
- References [19]
- Comments [0]
- Validations
- Western blot [3]
- Immunocytochemistry [5]
- Immunohistochemistry [3]
- Other assay [7]
Submit
Validation data
Reference
Comment
Report error
- Product number
- PA1-091 - Provider product page

- Provider
- Invitrogen Antibodies
- Product name
- RAC1 Polyclonal Antibody
- Antibody type
- Polyclonal
- Antigen
- Recombinant full-length protein
- Reactivity
- Human, Mouse
- Host
- Rabbit
- Isotype
- IgG
- Vial size
- 100 µg
- Concentration
- 1 mg/mL
- Storage
- -20°C
Submitted references Periostin/Filamin-A: A Candidate Central Regulatory Axis for Valve Fibrogenesis and Matrix Compaction.
RAC1 plays an essential role in estrogen receptor alpha function in breast cancer cells.
NecroX-5 Can Suppress Melanoma Metastasis by Reducing the Expression of Rho-Family GTPases.
Neutrophils interact with cholangiocytes to cause cholestatic changes in alcoholic hepatitis.
Endoplasmic Reticulum Stress Induces CAP2 Expression Promoting Epithelial-Mesenchymal Transition in Liver Cancer Cells.
EMT-Induced Cell-Mechanical Changes Enhance Mitotic Rounding Strength.
Adaptor Protein p66Shc: A Link Between Cytosolic and Mitochondrial Dysfunction in the Development of Diabetic Retinopathy.
Comparative analysis of viral entry for Asian and African lineages of Zika virus.
Functional Regulation of an Oxidative Stress Mediator, Rac1, in Diabetic Retinopathy.
Activation of endothelial ras-related C3 botulinum toxin substrate 1 (Rac1) improves post-stroke recovery and angiogenesis via activating Pak1 in mice.
Cannabinoid receptor 2 agonist attenuates blood‑brain barrier damage in a rat model of intracerebral hemorrhage by activating the Rac1 pathway.
RHOG-DOCK1-RAC1 Signaling Axis Is Perturbed in DHEA-Induced Polycystic Ovary in Rat Model.
Di-n-butyl phthalate exposure negatively influences structural and functional neuroplasticity via Rho-GTPase signaling pathways.
AKT-mediated stabilization of histone methyltransferase WHSC1 promotes prostate cancer metastasis.
The NarE protein of Neisseria gonorrhoeae catalyzes ADP-ribosylation of several ADP-ribose acceptors despite an N-terminal deletion.
The Ig V(H) complementarity-determining region 3-containing Rb9 peptide, inhibits melanoma cells migration and invasion by interactions with Hsp90 and an adhesion G-protein coupled receptor.
C9ORF72 interaction with cofilin modulates actin dynamics in motor neurons.
RAC1 GTPase promotes the survival of breast cancer cells in response to hyper-fractionated radiation treatment.
MicroRNA-27a Inhibits Cell Migration and Invasion of Fibroblast-Like Synoviocytes by Targeting Follistatin-Like Protein 1 in Rheumatoid Arthritis.
Misra S, Ghatak S, Moreno-Rodriguez RA, Norris RA, Hascall VC, Markwald RR
Frontiers in cell and developmental biology 2021;9:649862
Frontiers in cell and developmental biology 2021;9:649862
RAC1 plays an essential role in estrogen receptor alpha function in breast cancer cells.
Sun J, Gaidosh G, Xu Y, Mookhtiar A, Man N, Cingaram PR, Blumenthal E, Shiekhattar R, Goka ET, Nimer SD, Lippman ME
Oncogene 2021 Oct;40(40):5950-5962
Oncogene 2021 Oct;40(40):5950-5962
NecroX-5 Can Suppress Melanoma Metastasis by Reducing the Expression of Rho-Family GTPases.
Moon GT, Lee JH, Jeong SH, Jin SW, Park YM
Journal of clinical medicine 2021 Jun 25;10(13)
Journal of clinical medicine 2021 Jun 25;10(13)
Neutrophils interact with cholangiocytes to cause cholestatic changes in alcoholic hepatitis.
Takeuchi M, Vidigal PT, Guerra MT, Hundt MA, Robert ME, Olave-Martinez M, Aoki S, Khamphaya T, Kersten R, Kruglov E, de la Rosa Rodriguez R, Banales JM, Nathanson MH, Weerachayaphorn J
Gut 2021 Feb;70(2):342-356
Gut 2021 Feb;70(2):342-356
Endoplasmic Reticulum Stress Induces CAP2 Expression Promoting Epithelial-Mesenchymal Transition in Liver Cancer Cells.
Yoon S, Shin B, Woo HG
Molecules and cells 2021 Aug 31;44(8):569-579
Molecules and cells 2021 Aug 31;44(8):569-579
EMT-Induced Cell-Mechanical Changes Enhance Mitotic Rounding Strength.
Hosseini K, Taubenberger A, Werner C, Fischer-Friedrich E
Advanced science (Weinheim, Baden-Wurttemberg, Germany) 2020 Oct;7(19):2001276
Advanced science (Weinheim, Baden-Wurttemberg, Germany) 2020 Oct;7(19):2001276
Adaptor Protein p66Shc: A Link Between Cytosolic and Mitochondrial Dysfunction in the Development of Diabetic Retinopathy.
Mishra M, Duraisamy AJ, Bhattacharjee S, Kowluru RA
Antioxidants & redox signaling 2019 May 1;30(13):1621-1634
Antioxidants & redox signaling 2019 May 1;30(13):1621-1634
Comparative analysis of viral entry for Asian and African lineages of Zika virus.
Rinkenberger N, Schoggins JW
Virology 2019 Jul;533:59-67
Virology 2019 Jul;533:59-67
Functional Regulation of an Oxidative Stress Mediator, Rac1, in Diabetic Retinopathy.
Mohammad G, Duraisamy AJ, Kowluru A, Kowluru RA
Molecular neurobiology 2019 Dec;56(12):8643-8655
Molecular neurobiology 2019 Dec;56(12):8643-8655
Activation of endothelial ras-related C3 botulinum toxin substrate 1 (Rac1) improves post-stroke recovery and angiogenesis via activating Pak1 in mice.
Bu F, Min JW, Munshi Y, Lai YJ, Qi L, Urayama A, McCullough LD, Li J
Experimental neurology 2019 Dec;322:113059
Experimental neurology 2019 Dec;322:113059
Cannabinoid receptor 2 agonist attenuates blood‑brain barrier damage in a rat model of intracerebral hemorrhage by activating the Rac1 pathway.
Wang Z, Li Y, Cai S, Li R, Cao G
International journal of molecular medicine 2018 Nov;42(5):2914-2922
International journal of molecular medicine 2018 Nov;42(5):2914-2922
RHOG-DOCK1-RAC1 Signaling Axis Is Perturbed in DHEA-Induced Polycystic Ovary in Rat Model.
Ubba V, Soni UK, Chadchan S, Maurya VK, Kumar V, Maurya R, Chaturvedi H, Singh R, Dwivedi A, Jha RK
Reproductive sciences (Thousand Oaks, Calif.) 2017 May;24(5):738-752
Reproductive sciences (Thousand Oaks, Calif.) 2017 May;24(5):738-752
Di-n-butyl phthalate exposure negatively influences structural and functional neuroplasticity via Rho-GTPase signaling pathways.
Ding Y, Lu L, Xuan C, Han J, Ye S, Cao T, Chen W, Li A, Zhang X
Food and chemical toxicology : an international journal published for the British Industrial Biological Research Association 2017 Jul;105:34-43
Food and chemical toxicology : an international journal published for the British Industrial Biological Research Association 2017 Jul;105:34-43
AKT-mediated stabilization of histone methyltransferase WHSC1 promotes prostate cancer metastasis.
Li N, Xue W, Yuan H, Dong B, Ding Y, Liu Y, Jiang M, Kan S, Sun T, Ren J, Pan Q, Li X, Zhang P, Hu G, Wang Y, Wang X, Li Q, Qin J
The Journal of clinical investigation 2017 Apr 3;127(4):1284-1302
The Journal of clinical investigation 2017 Apr 3;127(4):1284-1302
The NarE protein of Neisseria gonorrhoeae catalyzes ADP-ribosylation of several ADP-ribose acceptors despite an N-terminal deletion.
Rodas PI, Álamos-Musre AS, Álvarez FP, Escobar A, Tapia CV, Osorio E, Otero C, Calderón IL, Fuentes JA, Gil F, Paredes-Sabja D, Christodoulides M
FEMS microbiology letters 2016 Sep;363(17)
FEMS microbiology letters 2016 Sep;363(17)
The Ig V(H) complementarity-determining region 3-containing Rb9 peptide, inhibits melanoma cells migration and invasion by interactions with Hsp90 and an adhesion G-protein coupled receptor.
Girola N, Matsuo AL, Figueiredo CR, Massaoka MH, Farias CF, Arruda DC, Azevedo RA, Monteiro HP, Resende-Lara PT, Cunha RL, Polonelli L, Travassos LR
Peptides 2016 Nov;85:1-15
Peptides 2016 Nov;85:1-15
C9ORF72 interaction with cofilin modulates actin dynamics in motor neurons.
Sivadasan R, Hornburg D, Drepper C, Frank N, Jablonka S, Hansel A, Lojewski X, Sterneckert J, Hermann A, Shaw PJ, Ince PG, Mann M, Meissner F, Sendtner M
Nature neuroscience 2016 Dec;19(12):1610-1618
Nature neuroscience 2016 Dec;19(12):1610-1618
RAC1 GTPase promotes the survival of breast cancer cells in response to hyper-fractionated radiation treatment.
Hein AL, Post CM, Sheinin YM, Lakshmanan I, Natarajan A, Enke CA, Batra SK, Ouellette MM, Yan Y
Oncogene 2016 Dec 8;35(49):6319-6329
Oncogene 2016 Dec 8;35(49):6319-6329
MicroRNA-27a Inhibits Cell Migration and Invasion of Fibroblast-Like Synoviocytes by Targeting Follistatin-Like Protein 1 in Rheumatoid Arthritis.
Shi DL, Shi GR, Xie J, Du XZ, Yang H
Molecules and cells 2016 Aug 31;39(8):611-8
Molecules and cells 2016 Aug 31;39(8):611-8
No comments: Submit comment
Supportive validation
- Submitted by
- Invitrogen Antibodies (provider)
- Main image
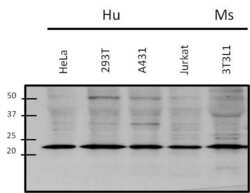
- Experimental details
- Western blot analysis of Rac1 was performed by loading 50 µg of various whole cell lysate onto a 4-20% Tris-HCl polyacrylamide gel. Proteins were transferred to a PVDF membrane and blocked with 5% BSA/TBST for at least 1 hour. Membranes were then probed with a rabbit polyclonal antibody recognizing Rac1 (Product # PA1-091) at a dilution of 1:1000 overnight at 4°C on a rocking platform. Membranes were then washed in TBS-0.1%Tween 20 and probed with a goat anti-rabbit-HRP secondary antibody (Product # 31460) at a dilution of 1:15000 for at least one hour. Membranes were washed and chemiluminescent detection was performed using Super Signal West Pico (Product # 34080).
- Submitted by
- Invitrogen Antibodies (provider)
- Main image
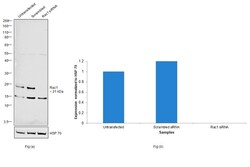
- Experimental details
- Knockdown of RAC1 was achieved by transfecting HT-29 with RAC1 specific siRNAs (Silencer® select Product # S11713). Western blot analysis (Fig. a) was performed using Membrane enriched extracts from the RAC1 knockdown cells (lane 3), non-targeting scrambled siRNA transfected cells (lane 2) and untransfected cells (lane 1). The blot was probed with RAC1 Polyclonal Antibody (Product # PA1-091, 1:1000 dilution) and Goat anti-Rabbit IgG (H+L) Superclonal™ Recombinant Secondary Antibody, HRP (Product # A27036, 1:4000 dilution). Densitometric analysis of this western blot is shown in histogram (Fig. b). Decrease in signal upon siRNA mediated knock down confirms that antibody is specific to RAC1.
- Submitted by
- Invitrogen Antibodies (provider)
- Main image

- Experimental details
- Western blot was performed using Anti-RAC1 Polyclonal Antibody (Product # PA1-091) and a 21kDa band corresponding to RAC1 was observed along with uncharacterized band (*) across cell lines tested. Membrane enriched extracts (30 µg lysate) of HeLa (Lane 1), HT-29 (Lane 2), SW480 (Lane 3), PC-3 (Lane 4), LNCaP (Lane 5), A-431 (Lane 6) and NIH/3T3 (Lane 7) were electrophoresed using NuPAGE™ 4-12% Bis-Tris Protein Gel (Product # NP0321BOX). Resolved proteins were then transferred onto a Nitrocellulose membrane (Product # IB23001) by iBlot® 2 Dry Blotting System (Product # IB21001). The blot was probed with the primary antibody (1:1000 dilution) and detected by chemiluminescence with Goat anti-Rabbit IgG (H+L) Superclonal™ Recombinant Secondary Antibody, HRP (Product # A27036, 1:4000 dilution) using the iBright FL 1000 (Product # A32752). Chemiluminescent detection was performed using Novex® ECL Chemiluminescent Substrate Reagent Kit (Product # WP20005).
Supportive validation
- Submitted by
- Invitrogen Antibodies (provider)
- Main image
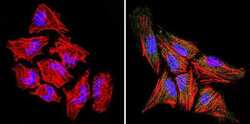
- Experimental details
- Immunofluorescent analysis of Rac1 (green) in Hela cells. Formalin-fixed cells were permeabilized with 0.1% Triton X-100 in TBS for 5-10 minutes at room temperature and blocked with 3% BSA-PBS for 30 minutes at room temperature. Cells were probed with a Rac1 polyclonal antibody (Product # PA1-091) at a dilution of 1:100 and incubated overnight in a humidified chamber. Cells were washed with PBST and incubated with a DyLight-conjugated secondary antibody for 45 minutes at room temperature in the dark. F-actin (red) was stained with a fluorescent phalloidin and nuclei (blue) were stained with DAPI. Images were taken at a 60X magnification.
- Submitted by
- Invitrogen Antibodies (provider)
- Main image
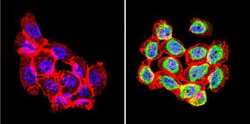
- Experimental details
- Immunofluorescent analysis of Rac1 (green) in human cells. Formalin-fixed cells were permeabilized with 0.1% Triton X-100 in TBS for 5-10 minutes at room temperature and blocked with 3% BSA-PBS for 30 minutes at room temperature. Cells were probed with a Rac1 polyclonal antibody (Product # PA1-091) at a dilution of 1:20 and incubated overnight in a humidified chamber. Cells were washed with PBST and incubated with a DyLight-conjugated secondary antibody for 45 minutes at room temperature in the dark. F-actin (red) was stained with a fluorescent phalloidin and nuclei (blue) were stained with DAPI. Images were taken at a 60X magnification.
- Submitted by
- Invitrogen Antibodies (provider)
- Main image

- Experimental details
- Immunofluorescent analysis of Rac1 (green) in untreated HeLa cells. Formalin fixed cells were permeabilized with 0.1% Triton X-100 in TBS for 10 minutes at room temperature. Cells were then blocked with 5% normal goat serum (Product # 31873) for 15 minutes at room temperature. Cells were probed with a rabbit polyclonal antibody recognizing Rac1 (Product # PA1-091), at a dilution of 1:100 for at least 1 hour at room temperature. Cells were then washed with PBS and incubated with DyLight 488 goat-anti-rabbit secondary antibody at a dilution of 1:400 for 30 minutes at room temperature. Nuclei (blue) were stained with Hoechst 33342 dye (Product # 62249). Images were taken on a Thermo Scientific ArrayScan at 20X magnification.
- Submitted by
- Invitrogen Antibodies (provider)
- Main image
- Experimental details
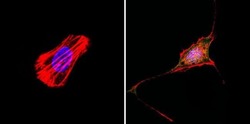
- Immunofluorescent analysis of Rac1 (green) in murine cells. Formalin-fixed cells were permeabilized with 0.1% Triton X-100 in TBS for 5-10 minutes at room temperature and blocked with 3% BSA-PBS for 30 minutes at room temperature. Cells were probed with a Rac1 polyclonal antibody (Product # PA1-091) at a dilution of 1:20 and incubated overnight in a humidified chamber. Cells were washed with PBST and incubated with a DyLight-conjugated secondary antibody for 45 minutes at room temperature in the dark. F-actin (red) was stained with a fluorescent phalloidin and nuclei (blue) were stained with DAPI. Images were taken at a 60X magnification.
- Submitted by
- Invitrogen Antibodies (provider)
- Main image
- Experimental details
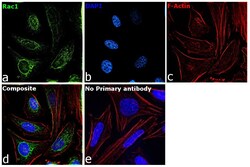
- Immunofluorescence analysis of RAC1 was performed using 70% confluent log phase HeLa cells. The cells were fixed with 4% paraformaldehyde for 10 minutes, permeabilized with 0.1% Triton™ X-100 for 15 minutes, and blocked with 2% BSA for 45 minutes at room temperature. The cells were labeled with RAC1 Polyclonal Antibody (Product # PA1-091) at 1:100 dilution in 0.1% BSA, incubated at 4 degree celsius overnight and then labeled with Donkey anti-Rabbit IgG (H+L) Highly Cross-Adsorbed Secondary Antibody, Alexa Fluor Plus 488 (Product # A32790), (1:2000 dilution), for 45 minutes at room temperature (Panel a: Green). Nuclei (Panel b:Blue) were stained with ProLong™ Diamond Antifade Mountant with DAPI (Product # P36962). F-actin (Panel c: Red) was stained with Rhodamine Phalloidin (Product # R415, 1:300 dilution). Panel d represents the merged image showing cytoplasmic localization. Panel e represents control cells with no primary antibody to assess background. The images were captured at 60X magnification.
Supportive validation
- Submitted by
- Invitrogen Antibodies (provider)
- Main image
- Experimental details
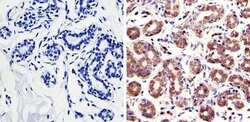
- Immunohistochemistry was performed on human breast tissue. To expose target protein, antigen was retreived using 10mM sodium citrate followed by microwave treatment for 8-15 minutes. Endogenous peroxidases were blocked in 3% H202-methanol for 15 minutes and tissues were blocked in 3% BSA-PBS for 30 minutes at room temperature. Cells were probed with a Rac-1 Rabbit polyclonal antibody (Product # PA1-091) at a dilution of 1:200 overnight in a humidified chamber. Tissues were washed in PBST and detection was performed using a secondary antibody conjugated to HRP. DAB staining buffer was applied and tissues were counterstained with hematoxylin and prepped for mounting. Images were taken at 40X magnification.
- Submitted by
- Invitrogen Antibodies (provider)
- Main image
- Experimental details
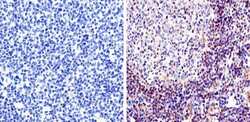
- Immunohistochemistry was performed on human tonsil tissue. To expose target protein, antigen was retreived using 10mM sodium citrate followed by microwave treatment for 8-15 minutes. Endogenous peroxidases were blocked in 3% H202-methanol for 15 minutes and tissues were blocked in 3% BSA-PBS for 30 minutes at room temperature. Cells were probed with a Rac-1 Rabbit polyclonal antibody (Product # PA1-091) at a dilution of 1:50 overnight in a humidified chamber. Tissues were washed in PBST and detection was performed using a secondary antibody conjugated to HRP. DAB staining buffer was applied and tissues were counterstained with hematoxylin and prepped for mounting. Images were taken at 40X magnification.
- Submitted by
- Invitrogen Antibodies (provider)
- Main image

- Experimental details
- Immunohistochemistry was performed on human prostate tissue. To expose target protein, antigen was retreived using 10mM sodium citrate followed by microwave treatment for 8-15 minutes. Endogenous peroxidases were blocked in 3% H202-methanol for 15 minutes and tissues were blocked in 3% BSA-PBS for 30 minutes at room temperature. Cells were probed with a Rac-1 Rabbit polyclonal antibody (Product # PA1-091) at a dilution of 1:50 overnight in a humidified chamber. Tissues were washed in PBST and detection was performed using a secondary antibody conjugated to HRP. DAB staining buffer was applied and tissues were counterstained with hematoxylin and prepped for mounting. Images were taken at 40X magnification.
Supportive validation
- Submitted by
- Invitrogen Antibodies (provider)
- Main image
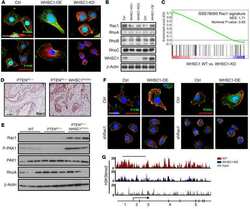
- Experimental details
- NULL
- Submitted by
- Invitrogen Antibodies (provider)
- Main image
- Experimental details
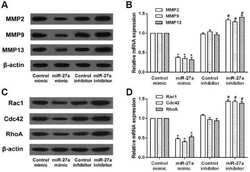
- Fig. 3. Effects of miR-27a on the expression of migration and invasion-related proteins in RA-FLS. RA-FLS were transfected with miR-27a mimic or miR-27a inhibitor. (A) The protein and mRNA expression of MMP2, MMP9, and MMP13 in RA-FLS was detected by western blot and qRT-PCR assay. (B) The protein and mRNA expression of Rac1, Cdc42, and RhoA in RA-FLS was detected by western blot and qRT-PCR assay. * p < 0.05, versus control mimic group. # p < 0.05, versus control inhibitor group.
- Submitted by
- Invitrogen Antibodies (provider)
- Main image
- Experimental details
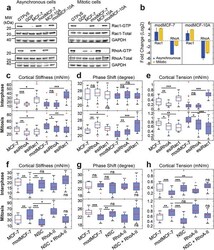
- Figure 4 Activity changes of Rac1 and RhoA upon EMT and related changes in cortical mechanics. Rac1 and RhoA activity before and after EMT: a) Western blots showing GTP-bound Rac1 (top row) and RhoA (third row) before and after EMT. b) Quantification of relative changes of Rac1-GTP and RhoA-GTP from Western blots in (a). Quantifications were normalized by GAPDH band. c-e) Effect of Rac1 and RhoA knock-down on cortex mechanics in MCF-7 and modMCF-7 (post-EMT) in suspended interphase MCF-7 cells (top row) and MCF-7 cells in mitotic arrest (bottom row). f-h) Effect of RhoA activation upon 2 h treatment with 0.5 µg mL -1 RhoA activator II (RhoA-II) and Rac1 inhibition upon 1 h treatment with 100 x 10 -6 m NSC23766 (NSC) on cortex mechanics in modMCF-7 (post-EMT) in suspended interphase MCF-7 cells (top row) and MCF-7 cells in mitotic arrest (bottom row). The last condition was compared to the first condition. (Post-EMT MCF-7 cells are referred to as modMCF-7. Blue-shaded boxes indicate post-EMT conditions. Number of cells measured in (c-e): Interphase: MCF-7 n = 36, esiRhoA n = 36, esiRac1 n = 35, modMCF-7 n = 31, esiRhoA n = 26, and esiRac1 n = 30, Mitosis: MCF-7 n = 22, esiRhoA n = 26, esiRac1 n = 24, modMCF-7 n = 28, esiRhoA n = 28, and esiRac1 n = 28; in (f-h): Interphase: MCF-7 n = 24, modMCF-7 n = 24, NSC n = 22, RhoA-II n = 22, and NSC + RhoA-II n = 24. Mitosis MCF-7 n = 24, modMCF-7 n = 28, NSC n = 22, RhoA-II n = 24 and NSC + RhoA-II n = 22. Measurements are repres
- Submitted by
- Invitrogen Antibodies (provider)
- Main image
- Experimental details
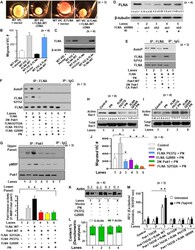
- FIGURE 6 FLNA is a substrate of Pak1, and the effects of FLNA mutations [FLNA (P637Q) and FLNA (G288R)] on PN induced FLNA phosphorylation, on activation of Rac1, and on cell migration are shown. (A) VICs were transfected with FLNA shRNA. The stable clones were isolated and designated as FLNA-deficient VICs (VICs Delta FLNA) WT VICs and FLNA Delta VICs were transfected with vector or with wild-type FLNA lentiviral constructs for 72 h before treatment. These transfected VICs were then embedded in three-dimensional collagen matrices to analyze collagen lattice compaction (see the ""Materials and Methods"" section for details). (B) Transwell migration assays are shown for WT VICs and VICs Delta FLNA pre-transfected with the indicated lentiviral constructs. Percentages of cells seeded in the upper chamber of Transwell filters that migrated overnight into the lower chamber are shown. Numbers of migrated cells were counted on six fields from three experiments. Detailed descriptions are in the ""Materials and Methods"" section. (C) Western blot analyses are shown for FLNA and beta-actin (internal control) proteins in the lysates from WT VICs and VICs Delta FLNA pretransfected with the indicated lentiviral constructs. (D) Validation was done for the FLNA shRNAs used in the experiments of (A-C) . Two shRNAs (shRNA1 and shRNA2) were used for the FLNA protein. For a detailed description, see the ""Materials and Methods"" section. Both shRNAs effectively silenced FLNA gene expression by
- Submitted by
- Invitrogen Antibodies (provider)
- Main image
- Experimental details
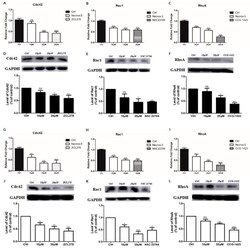
- Figure 3 The effect of NecroX-5 treatment on the expression of Rho family GTPases (Cdc42, Rac1, and RhoA). A375P ( A - F ) and A375SM ( G - L ) were treated with 10 muM or 20 muM NecroX-5 for 24 h. The mRNA expression levels of Cdc42, Rac1, and RhoA were measured by qRT-PCR ( A - C , G - I ). The protein levels of Cdc42, Rac1, and RhoA were measured using western blot analysis ( D - F , J - L ). GAPDH was used as an internal control for mRNA and protein normalization (ZCL278 (10 muM), Cdc42 GTPase inhibitor; NCS23766 (10 muM), Rac GTPase inhibitor; CCG-1423 (100 nM), RhoA GTPase inhibitor). Results are expressed as the mean +- SEM from three independent experiments. * p < 0.05, ** p < 0.01, *** p < 0.001.
- Submitted by
- Invitrogen Antibodies (provider)
- Main image
- Experimental details
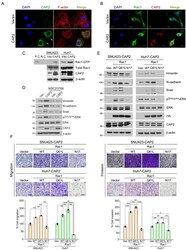
- Fig. 5 Rac1 is involved in CAP2-mediated ERK activation and EMT. (A and B) SNU423-Vector and SNU423- CAP2 cells are stained with the indicated fluorescent antibodies. Nuclei are counter-stained with DAPI. Images are captured under a laser scanning confocal microscope (x40). White arrows indicate membrane ruffles. Scale bars = 10 mum. (C) Total cell lysates prepared from the indicated cells are incubated with agarose beads coupled to PAK PBD. Bound Rac1 is detected with Western blotting using a Rac1 Ab (upper panel). The amount of total Rac1 is also measured (lower panel). P.C, positive control; N.C, negative control. Asterisks (*) indicate CAP2. (D) SNU423-Vector and SNU423- CAP2 cells were treated for 24 h with NSC23766 (50 muM) and subjected to western blotting with the indicated antibodies. Asterisk (*) indicates CAP2, double asterisk (**) indicates Snail. (E) SNU423- CAP2 and Huh7- CAP2 cells stably expressing Vector (Vec), Rac1 -WT, Rac1 -Q61L, or Rac1 -N17 are subjected to Western blotting with the indicated antibodies. Asterisks (*) indicate CAP2. (F) Migration and invasion of the indicated cells were measured in Transwell assays. Migrated/invaded cells are fixed with 10% formaldehyde and stained with 1% crystal violet. WT, wild type. Images are captured under a light microscope (magnification, x5). Scale bars = 500 mum. Data are presented as mean +- SEM for triplicate experiments. * P < 0.05, ** P < 0.01, and *** P < 0.001.
- Submitted by
- Invitrogen Antibodies (provider)
- Main image
- Experimental details
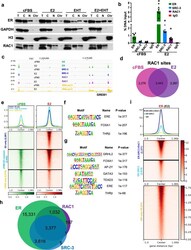
- Fig. 5 RAC1 co-localizes with ER on chromatin. A MCF-7 cells were treated as in Fig. 4A . The cell extract was fractionated into different portions and analyzed by Western blotting with the indicated antibodies. T total cellular lysate, C cytoplasmic fraction, N nuclear soluble fraction, Chr chromatin. B MCF-7 cells were cultured in estrogen-deprivation media for three days followed by the treatment with 10 nM E2 for 45 min. No E2-treated sample (cFBS) was served as a control. ChIP-qPCR analyses were performed for chromatin occupancies of ER, SRC-3, or RAC1, at a target region within the GREB1 enhancer. * P < 0.0001, compared to each control sample (Student's t test). C ChIP-seq analyses were performed for ER, SRC-3, RAC1, and RNA pol II, using MCF-7 samples prepared as in ( B ). Target occupancies at the GREB1 enhancer region were shown in IGV genome browser tracks. D Venn diagram of identified RAC1 chromatin occupancy sites (derived from two biological replicate samples, q < 10 -10 ) in the presence or absence of E2. E The average profiles and heatmaps of RAC1 signals at three groups of RAC1 occupancy sites as separated in ( D ). Homer motif analysis indicated enriched motifs at RAC1 sites only detected with E2 treatment ( F ) or motifs at RAC1 sites commonly detected with or without E2 ( G ). H Venn diagram of the overlapping of occupancy sites for ER, SRC-3 or RAC1 (derived from two biological replicate samples, q < 10 -10 ) in the presence of E2. I The average profiles a
 Explore
 Validate
 Learn
Learn Western blot