Explore
 Validate
 Learn
Learn Western blot
Antibody data
- Antibody Data
- Antigen structure
- References [1]
- Comments [0]
- Validations
- Western blot [3]
- Immunocytochemistry [1]
- Immunohistochemistry [1]
- Other assay [2]
Submit
Validation data
Reference
Comment
Report error
- Product number
- PA5-57673 - Provider product page

- Provider
- Invitrogen Antibodies
- Product name
- SH3PXD2B Polyclonal Antibody
- Antibody type
- Polyclonal
- Antigen
- Recombinant full-length protein
- Description
- Immunogen sequence: PPGVILPMMP AKHIPPARDS RRPEPKPDKS RLFQLKNDMG LECGHKVLAK EVKKPNLRPI SKSKTDLPEE KPDATPQNPF LKSRPQV
- Concentration
- 0.1 mg/mL
Submitted references Prognostic value of SH3PXD2B (Tks4) in human hepatocellular carcinoma: a combined multi-omics and experimental study.
Kui X, Wang Y, Zhang C, Li H, Li Q, Ke Y, Wang L
BMC medical genomics 2021 Apr 28;14(1):115
BMC medical genomics 2021 Apr 28;14(1):115
No comments: Submit comment
Supportive validation
- Submitted by
- Invitrogen Antibodies (provider)
- Main image

- Experimental details
- Western blot analysis of SH3PXD2B in Lane 1: Marker (kDa) 250, 130, 95, 72, 55, 36, 28, 17, 10; Lane 2: Human cell line RT-4. Samples were probed using a SH3PXD2B Polyclonal Antibody (Product # PA5-57673).

- Submitted by
- Invitrogen Antibodies (provider)
- Main image

- Experimental details
- Western blot analysis of SH3PXD2B in U2OS cells transfected with control siRNA, target specific siRNA probe #1 and #2, using a SH3PXD2B Polyclonal Antibody (Product # PA5-57673). Remaining relative intensity is presented. Loading control: Anti-GAPDH.

Supportive validation
- Submitted by
- Invitrogen Antibodies (provider)
- Main image

- Experimental details
- Immunofluorescent staining of SH3PXD2B in human cell line U-2 OS using a SH3PXD2B Polyclonal Antibody (Product # PA5-57673) shows localization to nucleus and plasma membrane.

Supportive validation
- Submitted by
- Invitrogen Antibodies (provider)
- Main image

- Experimental details
- Immunohistochemical staining of SH3PXD2B in human soft tissue using a SH3PXD2B Polyclonal Antibody (Product # PA5-57673) shows moderate cytoplasmic positivity in fibroblasts.

Supportive validation
- Submitted by
- Invitrogen Antibodies (provider)
- Main image

- Experimental details
- Fig. 1 SH3PXD2B expression is up-regulated in HCC tissues. The levels of SH3PXD2B mRNA transcripts and protein expression in HCC tissues of the TCGA database ( a ) and the Human Protein Atlas ( b ) were analyzed. c The relative levels of SH3PXD2B mRNA transcripts in 24 pairs of freshly surgical HCC and paired non-tumor liver tissues were analyzed by qRT-PCR. d Immunohistochemical analysis of 89 pairs of HCC and non-tumor liver samples. Data are representative images (magnification x 200) or expressed as the mean values in individual samples or mean +- SD of each group

- Submitted by
- Invitrogen Antibodies (provider)
- Main image

- Experimental details
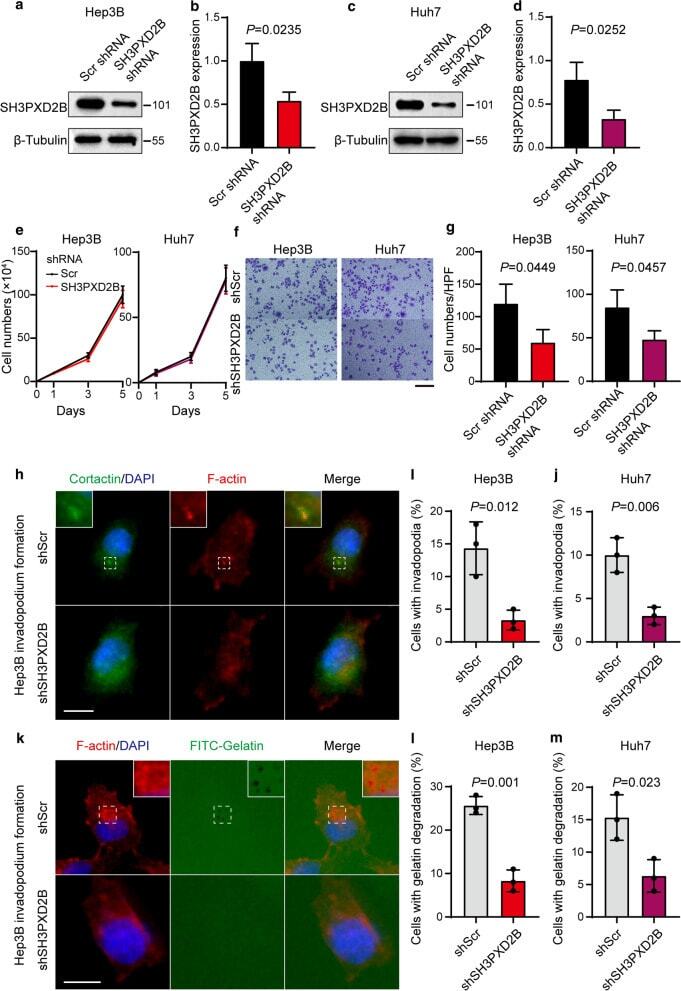
- Fig. 3 SH3PXD2B silencing inhibits the invasion, but not proliferation of Hep3B and Huh7 cells. Hep3B and Huh7 cells were transduced with lentivirus for expression of SH3PXD2B-specific shRNA or control shRNA (Scr). The relative levels of SH3PXD2B to the control beta-tubulin protein expression in different groups of Hep3B ( a , b ) and Huh7 ( c , d ) cells were determined by Western blot. e The dynamic proliferation of Hep3B and Huh7 cells was determined at the indicated time points. f , g The invasion of different groups of Hep3B and Huh7 cells was examined by transwell invasion assays. h - j The formation of invadopodia in different groups of Hep3B and Huh7 cells was examined by immunofluorescence assays. k - m The function of invadopodia in different groups of Hep3B and Huh7 cells was examined by in situ zymography. A total of 150 cells per group were analyzed by two researchers in a blinded manner. Data are representative images or expressed as the mean +- SD of each group from three separate experiments. Bar scale in F = 100 mum. Bar scales in H and K = 20 mum