 Explore
 Validate
 Learn
LearnMA1-065
antibody from Invitrogen Antibodies
Targeting: CLTCL1
CHC22, CLH22, CLTCL, CLTD
 Western blot Immunocytochemistry
 Immunoprecipitation Immunohistochemistry Flow cytometry Immunoelectron microscopy Other assay
Antibody data
- Antibody Data
- Antigen structure
- References [0]
- Comments [0]
- Validations
- Western blot [3]
- Immunocytochemistry [3]
- Immunohistochemistry [2]
- Other assay [17]
Submit
Validation data
Reference
Comment
Report error
- Product number
- MA1-065 - Provider product page

- Provider
- Invitrogen Antibodies
- Product name
- Clathrin Heavy Chain Monoclonal Antibody (X22)
- Antibody type
- Monoclonal
- Antigen
- Purifed from natural sources
- Description
- MA1-065 detects clathrin heavy chain in non-human primate, bovine, human, rat and mouse tissues as well as hamster (CHO) cells. MA1-065 has been successfully used in Western blot, immunofluorescence, immunocytochemistry, and immunoprecipitation procedures. By Western blot, this antibody recognizes a single ~180 kDa protein representing the clathrin heavy chain from bovine brain extract. Immunoprecipitation of triskelions with MA1-065 allows both the clathrin heavy chain and the associated light chain polypeptides to be examined. The MA1-065 immunogen is purified human brain clathrin heavy chain. Electron microscopy and proteolysis mapping demonstrate that MA1-065 binding occurs towards the central hub of the triskelion, N-terminal to the light chain binding regions.
- Reactivity
- Human, Mouse, Rat, Bovine, Hamster
- Host
- Mouse
- Isotype
- IgG
- Antibody clone number
- X22
- Vial size
- 100 µL
- Concentration
- 6 mg/mL
- Storage
- -20° C, Avoid Freeze/Thaw Cycles
No comments: Submit comment
Supportive validation
- Submitted by
- Invitrogen Antibodies (provider)
- Main image
- Experimental details
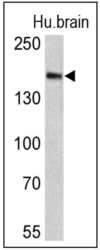
- Western blot analysis of Clathrin, Heavy chain was performed by loading 25 µg of human brain lysates onto an SDS polyacrylamide gel. Proteins were transferred to a PVDF membrane and blocked at 4ºC overnight. The membrane was probed with a Clathrin, Heavy chain monoclonal antibody (Product # MA1-065) at a dilution of 1:300 overnight at 4°C, washed in TBST, and probed with an HRP-conjugated goat anti-mouse IgG + IgM (H+L) cross-adsorbed secondary antibody for 1 hr at room temperature in the dark. Chemiluminescent detection was performed using Pierce ECL Plus Western Blotting Substrate (Product # 32132). Results show a band at ~180 kDa.

- Submitted by
- Invitrogen Antibodies (provider)
- Main image

- Experimental details
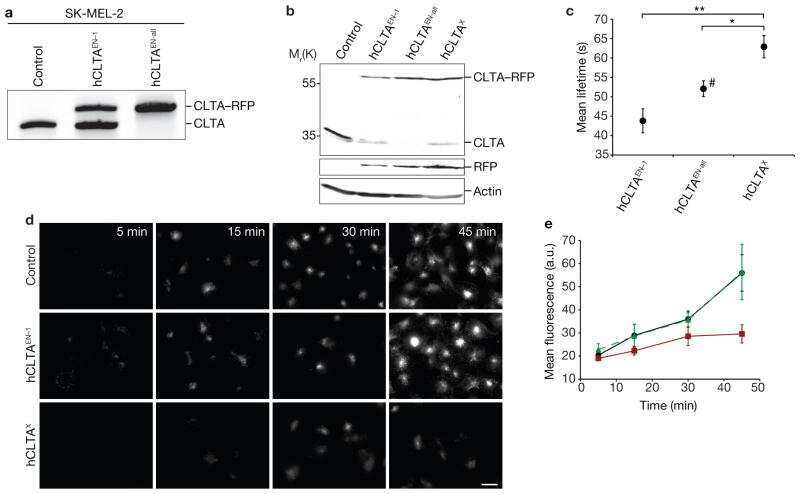
- Knockdown of Clathrin Heavy Chain was achieved by transfecting HeLa with Clathrin Heavy Chain specific siRNAs (Silencer® select Product # S475, S477). Western blot analysis (Fig. a) was performed using Whole cell extracts from the Clathrin Heavy Chain knockdown cells (lane 3), non-targeting scrambled siRNA transfected cells (lane 2) and untransfected cells (lane 1). The blot was probed with Clathrin Heavy Chain Monoclonal Antibody (X22) (Product # MA1-065, 1:500 ) and Goat anti-Mouse IgG (H+L) Superclonal™ Recombinant Secondary Antibody, HRP (Product # A28177, 1:4000). Densitometric analysis of this western blot is shown in histogram (Fig. b). Decrease in signal upon siRNA mediated knock down confirms that antibody is specific to Clathrin Heavy Chain.

- Submitted by
- Invitrogen Antibodies (provider)
- Main image

- Experimental details
- Western blot was performed using Anti-Clathrin Heavy Chain Monoclonal Antibody (X22) (Product # MA1-065) and a 191kDa band corresponding to Clathrin Heavy Chain was observed across cell lines. Whole cell extracts (30 µg lysate) of MCF7 (Lane 1), U-87 MG (Lane 2), HeLa (Lane 3) were electrophoresed using NuPAGE™ 4-12% Bis-Tris Protein Gel (Product # NP0321BOX). Resolved proteins were then transferred onto a nitrocellulose membrane (Product # IB23002) by iBlot® 2 Dry Blotting System (Product # IB21001). The blot was probed with the primary antibody (1:500) and detected by chemiluminescence with Goat anti-Mouse IgG (H+L) Superclonal™ Recombinant Secondary Antibody, HRP (Product # A28177, 1:4000) using the iBright FL 1000 (Product # A32752). Chemiluminescent detection was performed using Novex® ECL Chemiluminescent Substrate Reagent Kit (Product # WP20005).

Supportive validation
- Submitted by
- Invitrogen Antibodies (provider)
- Main image

- Experimental details
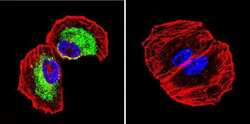
- Immunofluorescent analysis of Clathrin, Heavy chain using Anti-Clathrin, Heavy chain Monoclonal Antibody (X22) (Product # MA1-065) shows staining in Hela Cells. Clathrin, Heavy chain staining (green), F-Actin staining with Phalloidin (red) and nuclei with DAPI (blue) is shown. Cells were grown on chamber slides and fixed with formaldehyde prior to staining. Cells were probed without (control) or with or an antibody recognizing Clathrin, Heavy chain (Product # MA1-065) at a dilution of 1:200 over night at 4°C, washed with PBS and incubated with a DyLight-488 conjugated secondary antibody (Product # 35503, Goat Anti-Mouse). Images were taken at 60X magnification.

- Submitted by
- Invitrogen Antibodies (provider)
- Main image
- Experimental details
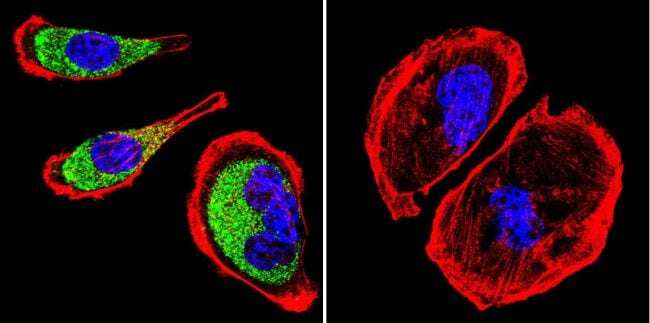
- Immunofluorescent analysis of Clathrin, Heavy chain using Anti-Clathrin, Heavy chain Monoclonal Antibody (X22) (Product # MA1-065) shows staining in NCI-H460 Cells. Clathrin, Heavy chain staining (green), F-Actin staining with Phalloidin (red) and nuclei with DAPI (blue) is shown. Cells were grown on chamber slides and fixed with formaldehyde prior to staining. Cells were probed without (control) or with or an antibody recognizing Clathrin, Heavy chain (Product # MA1-065) at a dilution of 1:200 over night at 4°C, washed with PBS and incubated with a DyLight-488 conjugated secondary antibody (Product # 35503, Goat Anti-Mouse). Images were taken at 60X magnification.

- Submitted by
- Invitrogen Antibodies (provider)
- Main image

- Experimental details
- Immunofluorescent analysis of Clathrin, Heavy chain using Anti-Clathrin, Heavy chain Monoclonal Antibody (X22) (Product # MA1-065) shows staining in U251 Cells. Clathrin, Heavy chain staining (green), F-Actin staining with Phalloidin (red) and nuclei with DAPI (blue) is shown. Cells were grown on chamber slides and fixed with formaldehyde prior to staining. Cells were probed without (control) or with or an antibody recognizing Clathrin, Heavy chain (Product # MA1-065) at a dilution of 1:200 over night at 4°C, washed with PBS and incubated with a DyLight-488 conjugated secondary antibody (Product # 35503, Goat Anti-Mouse). Images were taken at 60X magnification.
Supportive validation
- Submitted by
- Invitrogen Antibodies (provider)
- Main image

- Experimental details
- Immunohistochemistry was performed on cancer biopsies of deparaffinized Human breast carcinoma tissue. To expose target proteins, heat induced antigen retrieval was performed using 10mM sodium citrate (pH6.0) buffer, microwaved for 8-15 minutes. Following antigen retrieval tissues were blocked in 3% BSA-PBS for 30 minutes at room temperature. Tissues were then probed at a dilution of 1:100 with a mouse monoclonal antibody recognizing Clathrin, Heavy chain (Product # MA1-065) or without primary antibody (negative control) overnight at 4°C in a humidified chamber. Tissues were washed extensively with PBST and endogenous peroxidase activity was quenched with a peroxidase suppressor. Detection was performed using a biotin-conjugated secondary antibody and SA-HRP, followed by colorimetric detection using DAB. Tissues were counterstained with hematoxylin and prepped for mounting.

- Submitted by
- Invitrogen Antibodies (provider)
- Main image

- Experimental details
- Immunohistochemistry was performed on normal biopsies of deparaffinized Human colon tissue. To expose target proteins, heat induced antigen retrieval was performed using 10mM sodium citrate (pH6.0) buffer, microwaved for 8-15 minutes. Following antigen retrieval tissues were blocked in 3% BSA-PBS for 30 minutes at room temperature. Tissues were then probed at a dilution of 1:100 with a mouse monoclonal antibody recognizing Clathrin, Heavy chain (Product # MA1-065) or without primary antibody (negative control) overnight at 4°C in a humidified chamber. Tissues were washed extensively with PBST and endogenous peroxidase activity was quenched with a peroxidase suppressor. Detection was performed using a biotin-conjugated secondary antibody and SA-HRP, followed by colorimetric detection using DAB. Tissues were counterstained with hematoxylin and prepped for mounting.

Supportive validation
- Submitted by
- Invitrogen Antibodies (provider)
- Main image

- Experimental details
- NULL

- Submitted by
- Invitrogen Antibodies (provider)
- Main image

- Experimental details
- NULL

- Submitted by
- Invitrogen Antibodies (provider)
- Main image

- Experimental details
- NULL

- Submitted by
- Invitrogen Antibodies (provider)
- Main image

- Experimental details
- NULL
- Submitted by
- Invitrogen Antibodies (provider)
- Main image

- Experimental details
- NULL

- Submitted by
- Invitrogen Antibodies (provider)
- Main image

- Experimental details
- NULL
- Submitted by
- Invitrogen Antibodies (provider)
- Main image

- Experimental details
- NULL

- Submitted by
- Invitrogen Antibodies (provider)
- Main image

- Experimental details
- NULL

- Submitted by
- Invitrogen Antibodies (provider)
- Main image
- Experimental details
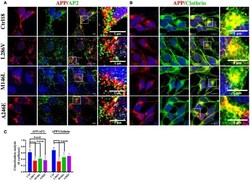
- Figure 2 The extent of Clathrin/APP and AP2/APP colocalization is reduced in NSCs from patients with AD . Confocal microscopy analysis of double staining using rabbit anti-APP and mouse anti-AP2 (A) and mouse anti-Clathrin (B) in control (C18) and AD neurons with PS1 mutations (L286V; M146L; A246E). Colocalization analysis is reported in (C) . The (R) coefficient (Pearson's coefficient) was used for the quantitative and comparative analyses. The extent of colocalization was calculated in at least five separate fields per slide in 10 different slides for each NSCs. The data are expressed as mean +- SEM. Scale bars are 5 mum for APP/AP2 and 6 mum for APP/Clathrin colocalization. Scale bars in high-resolution pictures are 5 mum. Statistically significant differences were calculated by one-way ANOVA and Tukey's post hoc test.

- Submitted by
- Invitrogen Antibodies (provider)
- Main image

- Experimental details
- Figure 3 Tyr kinase inhibitors restore APP colocalization with Clathrin and AP2 in NSCs from patients with AD . (A) IP analysis of control and PS1 neurons that were exposed, or not exposed, to Sunitinib and PP2. Control C18 and AD samples (LV, ML, AE) were immunoprecipitated with anti-pTyr agarose conjugated antibody (4G10) and analyzed with rabbit anti-APP (clone Y188). The image is representative of four independent experiments. Quantification is reported in (B) . Data were normalized with pTyr pulled down levels (input) and expressed as % of C18. Statistically significant differences were calculated by one-way ANOVA for repeated measures followed by Tukey's post hoc test for multiple comparisons. Confocal microscopy analysis of double staining using rabbit anti-APP and mouse anti-AP2 (C) and mouse anti-Clathrin (D) in controls and in neurons carrying L286V or M146L mutation on PS1 gene following exposure to the Tyr kinase inhibitor Sunitinib. The panels are representative of four different experiments performed in triplicate. (E) reports quantitative analysis of APP colocalization to AP2 and Clathrin after 12 h of exposure to Sunitinib. (E) also reports colocalization analysis after PP2 exposure. The (R) coefficient (Pearson's coefficient) was used for the quantitative and comparative analyses. The extent of colocalization was calculated in five separate fields per slide in five different slides for each experimental point. The data are expressed as mean +- SEM.

- Submitted by
- Invitrogen Antibodies (provider)
- Main image

- Experimental details
- Figure 4 Tyr phosphatase inhibitors reduce APP colocalization with Clathrin and AP2 and increase phosphorylation of APP Tyr in control neurons . Confocal microscopy analysis of double staining with rabbit anti-APP and mouse anti-AP2 (A) or mouse anti-Clathrin (B) in C18, L286V, and M146L neurons before and after Tyr phosphatase inhibitor (TC2153) exposure. The panels are representative of five different experiments performed in duplicate. (C) Colocalization analysis of APP to AP2 and Clathrin following incubation with TC2153 and BVT948 (BVT) inhibitors in C18 neurons and in AD neurons. The (R) coefficient (Pearson's coefficient) was used for the quantitative and comparative analyses. The extent of colocalization was calculated in five separate fields per slide in four different slides for each experimental point. The data are expressed as mean +- SEM. Scale bars 6 mum and 4 mum. Statistically significant differences were calculated by one-way ANOVA and Tukey's post hoc test. (D,E) . IP analysis of C18 (D) and AD neurons (E) before and after exposure to TC2153 and BVT948 (TC, BVT). Samples were immunoprecipitated with anti-pTyr agarose conjugated antibody (4G10) and analyzed with rabbit anti-APP (clone Y188). Densitometric analysis is reported in (F) . Data were normalized with IgG levels and expressed as % of C18. Statistically significant differences were calculated using Student's t -test.

- Submitted by
- Invitrogen Antibodies (provider)
- Main image

- Experimental details
- Figure 5 APP/AP2 and APP/Clathrin binding analysis in cortical tissues and fibroblasts of Gottingen minipigs with a PS1 M146I mutation in the PS1 gene . (A) CoIP analysis of cortical tissues and fibroblasts from control (Ctrl) and PS1 M146I minipigs. Samples were immunoprecipitated with rabbit anti-APP and analyzed with mouse anti-Clathrin (Clath) and mouse anti-AP2. (B) WB analysis of total lysate from controls (WT and Ctrl) and PS1 M146I minipigs. Densitometric analysis is reported in (C) . Data were normalized to the corresponding beta-actin values and expressed as % of Ctrl. Data from CoIP samples were normalized to the corresponding APP input amount and expressed as % of Ctrl. Statistically significant differences were calculated using Student's t -test. (D,E) Confocal microscopy analysis of double staining with rabbit anti-APP and mouse anti-AP2 (D) and mouse anti-Clathrin (E) in fibroblasts from Ctrl and PS1M146I minipigs in the presence of TC2153 or Sunitinib. The panels are representative of five different experiments performed in duplicate in Ctrl and PS1 fibroblasts from two independent control (Ctrl 1-2) and three PS1 (PS1a-c) minipigs. Colocalization analysis is reported in (F) . The (R) coefficient (Pearson's coefficient) was used for the quantitative and comparative analyses. The extent of colocalization was calculated in six separate fields per slide in four different slides for each cell line. Scale bars 1 muM and 5 muM in high magnification. Statistically si

- Submitted by
- Invitrogen Antibodies (provider)
- Main image

- Experimental details
- Figure 1 FCHSD2 Is a Bona Fide CME Protein Responsible for a Major Fraction of the ARP2/3 Contribution to CME (A) Top: Scheme showing the domain organization of FCHSD proteins. Bottom: Immunoblots for N-WASP and Intersectin1 (ITSN1) from pull down experiments from brain extracts using GST-tagged FCHSD1 and FCHSD2 SH3 domains. Lower portion shows Coomassie staining of baits. (B) Immunofluorescence showing colocalization between endogenous FCHSD2 and clathrin heavy chain. (C) TIRF image showing colocalization of FCHSD2 and clathrin. HeLa cells stably expressing FCHSD2-Venus and transfected with mCherry-clathrin light chain. (D) Left: Examples of the dynamics of FCHSD2 with different CME proteins. HeLa cells stably expressing FCHSD2-Venus were transfected with mCherry-clathrinLC, FusionRed-ITSN1L, FusionRed-Dynamin1, or mCherry-ARP3 and imaged live by TIRF microscopy. Time zero was set as the peak of FCHSD2 recruitment. Events are pseudocolored to match graphs on the right. Right: Summary graphs for the timing of recruitment of FCHSD2 versus CME proteins (n = 90, 48, 120, and 144 events for FCHSD2/clathrin, FCHSD2/ITSN1L, FCHSD2/Dynamin, and FCHSD2/ARP3, respectively). Full data including error bars are shown in Figure S1 A. (E) Transferrin uptake assay by flow cytometry. Uptake measurements were normalized as described in STAR Methods . Each value represents median fluorescence from at least 5,000 cells (n = 10, mean +- SD). (F) Left: Kymographs of BSC1 AP2sigma2-GFP cells sile

- Submitted by
- Invitrogen Antibodies (provider)
- Main image

- Experimental details
- Figure 5 FCHSD2 Localizes to the Plasma Membrane Side of CCPs (A) Sequential widefield (WF) and TIRF imaging of endocytic proteins allows the distinction between proteins that stay on the membrane and proteins that move away from the membrane. (B) Results for AP2, dynamin, and FCHSD2 using the experimental paradigm explained in (A). Image series of representative events generated from videos at 0.5 Hz. (n = 54, 51, and 53 events for AP2, dynamin, and FCHSD2 respectively, mean +- SEM). (C-E) Comparative localization of AP2 and FCHSD2 with CCPs by confocal (C), STED (D), and 3D STED (E) microscopy. Stable HeLa cells for AP2sigma2-GFP and FCHSD2-Venus cells were stained with anti-GFP and anti-Clathrin antibodies. Cartoon representations of the views are shown on the right hand side of super resolution images. Scale bars, 0.25 mum. (F) Curvature preference of FCHSD2 BAR by nanoparticle tracking analysis (NTA). Graph showing the size distribution of the total liposome population and the FCHSD2 BAR-sfGFP bound subpopulation. Total population distribution is measured by tracking particles diffracting light while FCHSD2 bound population is measured by tracking particles emitting light from GFP excitation. FCHSD2 BAR-sfGFP added at 1 nM (n = 3 experiments, mean +- SD). (G and H) Single particle cryoEM of F2B1 (FCHSD2 F-BAR+SH3-1). (G) 3D reconstruction from 30,207 particles. (H) The densities at the tip of the 3D map are compatible with an SH3 domain. In magenta is a surface represent
- Submitted by
- Invitrogen Antibodies (provider)
- Main image

- Experimental details
- Fig 2 Knockdown of selected genes required for ANDV infection. Western blots of indicated proteins after knockdown with gene-specific siRNA against (A) dynamin 2 (DNM2); (B) clathrin heavy chain (CLTC); (C) AP2M1; (D) caveolin 1 (CAV1); (E) CDC42; (F) ARF6; (G) NSF; (H) RAB5C; or (I) TSG101; or non-targeting siRNA transfection control (NT). siRNAs were transfected into HMVEC-L at the concentration of 100 nM for 48 h (see Table 1 for more information regarding these genes). The cells were then infected with ANDV (MOI = 0.5) for 24 h or 48 h. Western blots were performed post infection to ensure knockdown of the specific protein expression. Molecular weight of each specific protein is indicated on the right side of each panel. The blots were also probed with beta-actin specific antibody as the gel-loading control. (A) and (B) show only the results collected at 48 h.

- Submitted by
- Invitrogen Antibodies (provider)
- Main image
- Experimental details
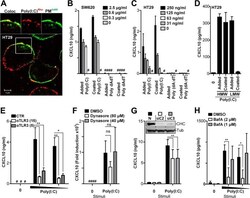
- Figure 5. CXCL10 production in metastatic IECs is elicited independent of poly(I:C) internalization but requires endosomal acidification. A , confocal microscopy image of HT29 cells treated with poly(I:C) Rhodamine ( red , 5 mug/ml) for 2 h before cells were washed and fixed, and the plasma membrane ( PM ) was stained with an antibody against Na,K-ATPase ( PM A488 , green ). Images ( top ) show co-localization ( Coloc , left ) and single tracks of poly(I:C) Rhodamine ( center ) and plasma membrane PM A488 staining ( right ) of the area denoted by the square in the main image. Scale bar = 5 mum. B and C , SW620 ( B ) or HT29 ( C ) cells were treated with poly(I:C) ( Added Poly(I:C) ) or double-stranded DNA dA:dT ( Added dA:dT ) added in solution or by plating cells in wells precoated with poly(I:C) ( Coated Poly(I:C) ) or dA:dT ( Coated dA:dT ) with the given concentrations for 24 h before CXCL10 release was determined by ELISA. D , CXCL10 production in HT29 cells exposed to HMW poly(I:C) or LMW poly(I:C) (2 mug/ml) either added in solution ( Added ) or by plating cells in wells precoated with poly(I:C) ( Coated ) for 21 h. E , CXCL10 release in HT29 cells pretreated with anti-TLR3 (15 or 5 mug/ml) or control goat IgG (15 mug/ml) for 1 h prior to stimulation with poly(I:C) (5 or 2 mug/ml) for 10 h. CXCL10 content in the supernatant was assessed by ELISA. **, p < 0.01; *, p < 0.05 versus cells pretreated with control IgG (two-way ANOVA, Bonferroni post-test). The results in A-D

- Submitted by
- Invitrogen Antibodies (provider)
- Main image

- Experimental details
- Figure 3. Characterization of expansion isotropy using Ten-fold Robust Expansion Microscopy (TREx). ( A ) U2OS knock-in cells with homozygous NUP96-GFP, amplified with anti-GFP antibodies. ( B ) One nucleus from boxed region of ( A ), imaged by confocal microscopy after TREx. ( C ) High-resolution view of several nuclear pores from boxed region (1) of panel ( B ), showing both anti-GFP (magenta) and anti-NUP153 (endogenous nuclear pore protein, cyan) staining. ( D ) High-resolution view of several nuclear pores from boxed region (2) of panel ( B ) (top). Distribution of diameters of individual nuclear pores (bottom), corrected for the macroscopic expansion factor of 9.5x. N = 60 nuclear pore complexes (NPCs) from three spatially separated cells. ( E ) U2OS cells stained for clathrin heavy chain and tubulin, representative line scan over clathrin-coated pit (CCP) showing central . ( F ) Quantification of CCP diameter. Plotted mean +- SD (1.16 +- 0.2 um) of 25 CCPs from five cells (two independent experiments). ( G ) High-resolution view of microtubules in extracted COS7 cell and corresponding line scans with mean peak-to-peak distance indicated. ( H ) Maximum projection of pre-expansion 3D gSTED acquisition (left) and maximum projection of tilescan acquisition (42 tiles, post-expansion size ~750 x 650 um) of the same cell post-expansion (right). ( I ) Post-expansion single field of view, as indicated with magenta box in ( D ), aligned with the pre-expansion image (gray) by
