Explore
 Validate
 Learn
Learn Western blot
Antibody data
- Antibody Data
- Antigen structure
- References [1]
- Comments [0]
- Validations
- Western blot [2]
- Other assay [1]
Submit
Validation data
Reference
Comment
Report error
- Product number
- PA5-80713 - Provider product page

- Provider
- Invitrogen Antibodies
- Product name
- IGSF5 Polyclonal Antibody
- Antibody type
- Polyclonal
- Antigen
- Synthetic peptide
- Description
- This product is preservative free. It is recommended to add sodium azide to avoid contamination (final concentration 0.05%-0.1%).
- Concentration
- 1 mg/mL
Submitted references Identification of Immune-Related Prognostic Biomarkers Associated with HPV-Positive Head and Neck Squamous Cell Carcinoma.
Chen Y, Nie J, Li X, Fan T, Deng X, Liang D, Song G
Journal of immunology research 2021;2021:6661625
Journal of immunology research 2021;2021:6661625
No comments: Submit comment
Supportive validation
- Submitted by
- Invitrogen Antibodies (provider)
- Main image
- Experimental details
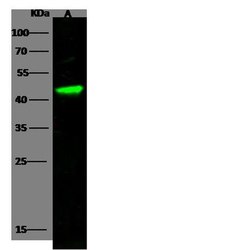
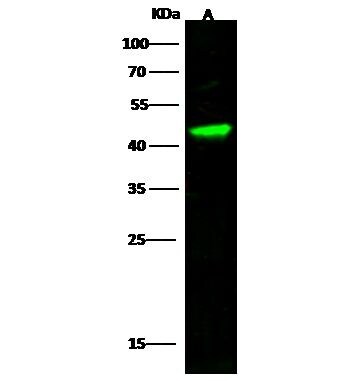
- Western blot analysis of IGSF5 in Lane A: 293 Whole Cell Lysate (30 µg). Samples were probed using a IGSF5 Polyclonal Antibody (Product # PA5-80713) at a 1:500 dilution, followed by a Goat Anti-Rabbit IgG (H+L), Dylight 800 Secondary Antibody at a 1:10000 dilution. Western blot was performed under reducing conditions. Predicted band size:45 kDa. Observed band size:45 kDa.

- Submitted by
- Invitrogen Antibodies (provider)
- Main image
- Experimental details
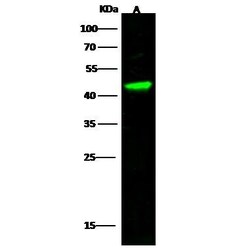
- Western Blot using IGSF5 Polyclonal Antibody (Product # PA5-80713) at 1:500 dilution. Lane A: 293 Whole Cell Lysate. Lysates/proteins at 30 μg per lane. Secondary Goat Anti- RabbitIgG H&L (DyLight™ 800) at 1:10,000 dilution. Developed using the Odyssey technique. Performed under reducing conditions. Predicted band size: 45 kDa. Observed band size: 45 kDa.
Supportive validation
- Submitted by
- Invitrogen Antibodies (provider)
- Main image
- Experimental details
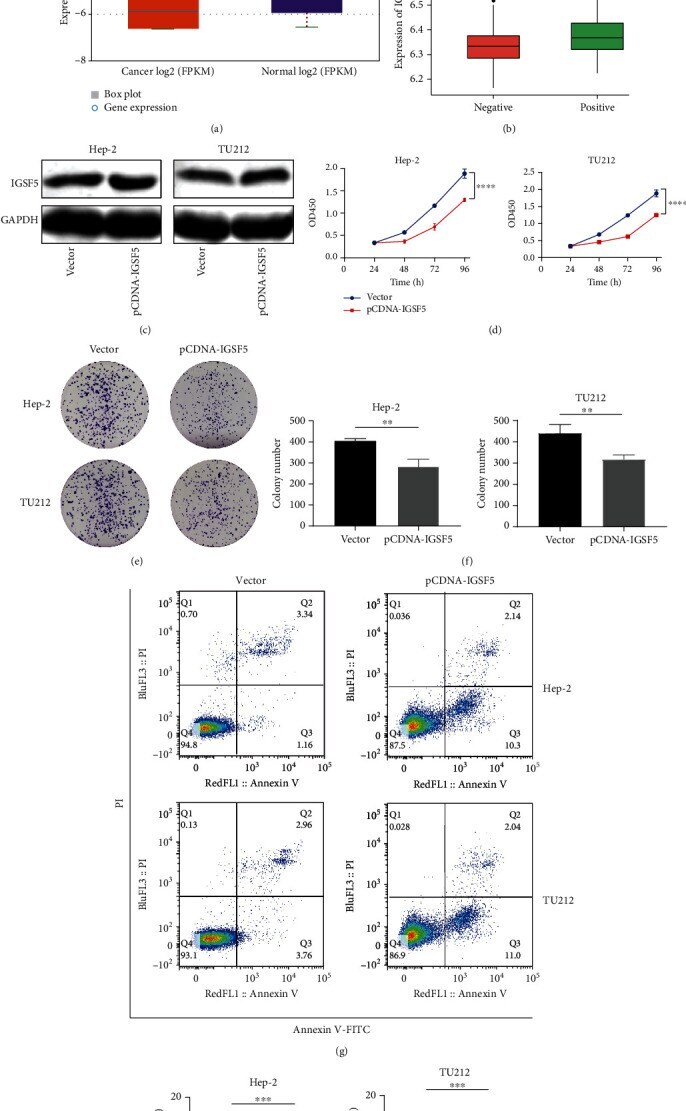
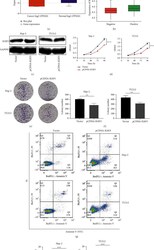
- Figure 10 Overexpression of IGSF5 inhibits the proliferation of HNSCC cells. (a) IGSF5 had lower expression in HNSCC samples than in matched normal tissues from the TCGA database (normal = 44, tumor = 519). (b) IGSF5 in HPV-positive HNSCC tissues from the GSE65858 cohort was upregulated compared with that in HPV-negative tissues. (c) The expression of IGSF5 was detected by Western blot, and cells transfected with the IGSF5 overexpression plasmid differed significantly between the IGSF5 overexpression (pCDNA-IGSF5) and control (vector) groups in Hep-2 and TU212 cells. GAPDH was used as an internal control. (d) Reduction in the proliferation ability of pCDNA-IGSF5 Hep-2 and TU212 cells compared with the control (vector) cells by the CCK8 assay. (e, f) Reduction in colony formation ability of pCDNA-IGSF5 Hep-2 and TU212 cells compared with the control (vector) cells by a colony formation assay. The bar graph indicates the number of colonies. (g, h) Cell apoptosis of pCDNA-IGSF5 Hep-2 and TU212 cells compared with the control (vector) was analyzed by flow cytometry. The rate of cell apoptosis is shown in the graphs. The results are presented as the mean +- s.d. and are representative of at least three independent experiments. * p < 0.05, ** p < 0.01, *** p < 0.001, and **** p < 0.0001. ns: p > 0.05.