 Explore
 Validate
 Learn
Learn Western blot
Antibody data
- Antibody Data
- Antigen structure
- References [0]
- Comments [0]
- Validations
- Western blot [5]
- Immunocytochemistry [2]
- Immunohistochemistry [1]
- Other assay [8]
Submit
Validation data
Reference
Comment
Report error
- Product number
- PA1-41331 - Provider product page

- Provider
- Invitrogen Antibodies
- Product name
- beta Tubulin Polyclonal Antibody
- Antibody type
- Polyclonal
- Antigen
- Synthetic peptide
- Description
- Suggested positive control: antigen standard for TUBB2A (transient overexpression lysate), human brain protein.
- Reactivity
- Human, Mouse, Rat, Bovine, Canine, Chicken/Avian, Feline, Xenopus
- Host
- Rabbit
- Isotype
- IgG
- Vial size
- 100 µg
- Concentration
- 1 mg/mL
- Storage
- Store at 4°C short term. For long term storage, store at -20°C, avoiding freeze/thaw cycles.
No comments: Submit comment
Supportive validation
- Submitted by
- Invitrogen Antibodies (provider)
- Main image

- Experimental details
- Western blot analysis of b-Tubulin in A: human brain, B: mouse brain and C: rat brain tissue lysates using the a beta Tubulin polyclonal antibody (Product # PA1-41331) antibody at 0.25 µg/mL.

- Submitted by
- Invitrogen Antibodies (provider)
- Main image

- Experimental details
- Western blot analysis was performed on whole cell extracts (30 µg lysate) of COS-7 (Lane 1), MDCK (Lane 2), NIH/3T3 (Lane 3), PC-12 (Lane 4), Neuro-2a (Lane 5), tissue extracts of Mouse Prostate (Lane 6) and Rat Brain (Lane 7). The blot was probed with Anti-beta Tubulin Rabbit Polyclonal Antibody (Product # PA1-41331, 1 µg/mL) and detected by chemiluminescence using Goat anti-Rabbit IgG (H+L) Superclonal™ Secondary Antibody, HRP conjugate (Product # A27036, 0.25 µg/mL, 1:4000 dilution). A 52 kDa band corresponding to beta Tubulin was observed across the cell lines and tissues tested. Known quantity of protein samples were electrophoresed using Novex® NuPAGE® 4-12 % Bis-Tris gel (Product # NP0322BOX), XCell SureLock™ Electrophoresis System (Product # EI0002) and Novex® Sharp Pre-Stained Protein Standard (Product # LC5800). Resolved proteins were then transferred onto a nitrocellulose membrane with iBlot® 2 Dry Blotting System (Product # IB21001). The membrane was probed with the relevant primary and secondary Antibody following blocking with 5 % skimmed milk. Chemiluminescent detection was performed using Pierce™ ECL Western Blotting Substrate (Product # 32106).

- Submitted by
- Invitrogen Antibodies (provider)
- Main image

- Experimental details
- Western blot analysis of beta Tubulin in A: human brain, B: mouse brain and C: rat brain tissue lysates. Samples were incubated in beta Tubulin polyclonal antibody (Product # PA1-41331) using a dilution of 25 µg/mL.

- Submitted by
- Invitrogen Antibodies (provider)
- Main image

- Experimental details
- Western blot analysis of beta Tubulin in 0.5 mg/mL Human Brain lysate. Samples were incubated in beta Tubulin polyclonal antibody (Product # PA1-41331). This experiment was performed under reducing conditions using the 12-230 kDa separation system.

Supportive validation
- Submitted by
- Invitrogen Antibodies (provider)
- Main image

- Experimental details
- Immunofluorescence analysis of beta tubulin was performed using 70% confluent log phase NIH/3T3 cells. The cells were fixed with 4% paraformaldehyde for 10 minutes, permeabilized with 0.1% Triton™ X-100 for 10 minutes, and blocked with 1% BSA for 1 hour at room temperature. The cells were labeled with Beta Tubulin Rabbit Polyclonal Antibody (Product # PA1-41331) at 2 µg/mL in 0.1% BSA and incubated for 3 hours at room temperature and then labeled with Goat anti-Rabbit IgG (H+L) Superclonal™ Secondary Antibody, Alexa Fluor® 488 conjugate (Product # A27034) at a dilution of 1:2000 for 45 minutes at room temperature (Panel a: green). Nuclei (Panel b: blue) were stained with SlowFade® Gold Antifade Mountant with DAPI (Product # S36938). F-actin (Panel c: red) was stained with Rhodamine Phalloidin (Product # R415, 1:300). Panel d represents the merged image showing cytoplasmic localization. Panel e shows the no primary antibody control. The images were captured at 60X magnification.

- Submitted by
- Invitrogen Antibodies (provider)
- Main image

- Experimental details
- Immunofluorescence analysis of beta Tubulin was performed using 70% confluent log phase SH-SY5Y cells. The cells were fixed with 4% paraformaldehyde for 10 minutes, permeabilized with 0.1% Triton™ X-100 for 10 minutes, and blocked with 1% BSA for 1 hour at room temperature. The cells were labeled with Beta Tubulin Rabbit Polyclonal Antibody (Product # PA1-41331) at 2 µg/mL in 0.1% BSA and incubated for 3 hours at room temperature and then labeled with Goat anti-Rabbit IgG (H+L) Superclonal™ Secondary Antibody, Alexa Fluor® 488 conjugate (Product # A27034) at a dilution of 1:2000 for 45 minutes at room temperature (Panel a: green). Nuclei (Panel b: blue) were stained with SlowFade® Gold Antifade Mountant with DAPI (Product # S36938). F-actin (Panel c: red) was stained with Rhodamine Phalloidin (Product # R415, 1:300). Panel d represents the merged image showing cytoplasmic localization. Panel e shows the no primary antibody control. The images were captured at 60X magnification.

Supportive validation
- Submitted by
- Invitrogen Antibodies (provider)
- Main image

- Experimental details
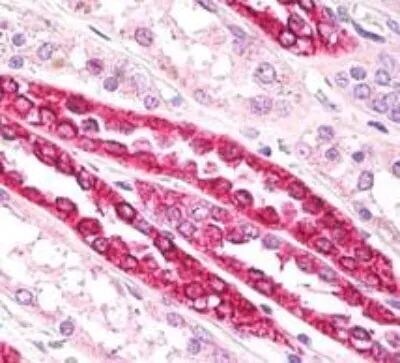
- Immunohistochemical analysis of beta Tubulin in Human kidney tubules. Samples were incubated in beta Tubulin polyclonal antibody (Product # PA1-41331) using a dilution of 10 µg/mL. Staining of formalin-fixed tissues is enhanced by boiling tissue sections in 10 mM sodium citrate buffer, pH 6.0 for 10-20 min followed by cooling at RT for 20 min.
Supportive validation
- Submitted by
- Invitrogen Antibodies (provider)
- Main image

- Experimental details
- NULL

- Submitted by
- Invitrogen Antibodies (provider)
- Main image

- Experimental details
- Figure 1 Immunoreactivity for neural stem/progenitor cell markers in cases of primary CNS lymphoma (NHL-CNS). A-C) are sections of 3 different cases of NHL-CNS immunostained for Musashi-1. There are rare immunopositive cells within the tumor or at the edges of the tumor in the adjacent gliotic brain. D-F) are sections of the same tumors immunostained for group II beta-tubulin. There is some background immunopositivity in the brain of neural processes, but cytoplasmic immunopositivity is seen in only in relatively rare cells along the edges of the tumors and, less frequently, within the tumors. G) Immunostain for nestin in a section from a case of NHL-CNS. There are some nestin-immunopositive cells along the border between the brain and the lymphoma, transgressing a short distance into the tumor between the lymphoma cells. H and I ) Immunostains for CD133 in two cases of NHL-CNS. In (H) there are immunopositive cells in the brain between two portions of tumor; in (I) there are rare immunopositive cells within the tumor cell aggregates. For comparison to all of these, (J) is an immunostain for GFAP in one of these cases, demonstrating maximal gliosis along the border between the tumor and the brain with a few entrapped GFAP-immunopositive astrocytes among the tumor cells deeper into the neoplastic aggregate. All photomicrographs at original magnification of 400x.

- Submitted by
- Invitrogen Antibodies (provider)
- Main image

- Experimental details
- Figure 3 Comparison of ATXN3 exon 10 skipping in patient cells, transfected with 2'-Me PS AOs and PMOs. Cells were harvested 48 hr following transfection for protein and RNA analysis. Agarose gel fractionation of ATXN3 amplicons, following 2'-Me PS AO ( A ) and PMO ( B ) cocktail transfections at concentrations of 400 nM and 20 muM, respectively shows full-length (FL 74Q; FL 24Q) and induced transcript products after skipping of exon 10 (Delta10). Ataxin-3 protein was analysed by Western blotting following 2'-Me PS AO ( C ) and PMO ( D ) cocktail transfection at a concentration of 400 nM and 20 muM, respectively. The disease-causing 74Q protein is approximately 60 kDa, the protein encoded by the healthy allele is approximately 48 kDa and the Delta10 encoded protein, 34 kDa. Beta-Tubulin was used as a loading control. The samples were also probed with an anti-polyglutamine antibody to identify the pathogenic stretch of glutamines in the ataxin-3 protein. Densitometric analysis performed on the Western blots are shown below the blots (means plus error bars. Error bars = standard deviation, n = 3). Samples are normalised to the GT control. (FL = full-length, Delta10 = exon skipped product, GT = Gene Tools control PMO, Q = glutamine, PolyQ = polyglutamine).

- Submitted by
- Invitrogen Antibodies (provider)
- Main image

- Experimental details
- Fig 3 Downregulation of ZCCHC10 in melanoma cells. Expression analysis of ZCCHC10 in melanoma cell lines and tissue sample. (A) Expression levels of ZCCHC10 were analyzed by western blotting. A2058, SKMEL28, G361, HMV1, CRL1579, and GAK are melanoma cell lines. Melanocytes were used as normal cells. Expression levels of ZCCHC10 were normalized against levels of beta-tubulin. (B) Bar chart shows the average densitometry analysis of western blot results from three independent experiments. Bars correspond to means +-S.D. of three independent experiments (**P

- Submitted by
- Invitrogen Antibodies (provider)
- Main image

- Experimental details
- Figure 2 Evaluation of the best performing exon skipping 2OMe PS AOs in healthy dermal fibroblasts. The ITGA4 transcript, ITGA4 protein expression and activity of healthy dermal fibroblasts after treatment with the top three exon skipping AOs targeting exon 3, 4 and 19 for 48 hr were analysed. ( a ) Gel fractionation of RT-PCR products of ITGA4 amplicons amplified from healthy dermal fibroblasts transfected with the 2OMe PS AOs at 100 nM for 48 hr. Ctrl: control AO, UT: untreated. CCND1 transcript encoding cyclin D protein was used as a loading control. Transcripts with exon(s) missing are labelled. ( b ) Western blot analysis of ITGA4 protein expression, ( c ) analysis of fibroblast migration using an established wound healing assay, and ( d ) relative fibroblast adhesion to extracellular matrix fibronectin, laminin and VCAM-1 using the treated and untreated healthy dermal fibroblasts from ( a ). Beta tubulin was used as a reference protein for western blot analysis. Densitometric analysis of western blots and relative migration and cell adhesion analysed as described in Materials and Methods for three biological replicates are shown as bar graphs. The gels and blots were cropped for presentation and full-size gels and blots are presented in Supplementary Fig. S5 . Error bar; SEM. Scale bar 100 um.

- Submitted by
- Invitrogen Antibodies (provider)
- Main image

- Experimental details
- Figure 3 Evaluation of the best performing exon skipping PMOs in Jurkat cells. The ITGA4 transcript, ITGA4 protein expression and activity in Jurkat cells treated with indicated PMOs for three days were analysed. ( a ) Gel fractionation of RT-PCR products of the ITGA4 amplicons and ( b ) western blot analysis of ITGA4 protein from Jurkat cells nucleofected with PMOs, as indicated above the gel, at 50 uM for three days. Beta tubulin was used as a reference protein. Densitometric analysis of three biological replicates for western blots is shown on the right. Error bar; SEM. ( c ) Flow cytometry analysis of surface receptor ITGA4 on Jurkat cells treated with 50 uM of PMO for three days. ( d ) Immunolabeling of ITGA4 protein in Jurkat cells treated with 50 uM of PMO for three days. Arrow head shows cell with intracellular accumulation of ITGA4 protein. Refer to Supplementary Fig. S3 for the display lookup tables. Green: ITGA4, blue: nucleus. Scale bar 25 um. ( e ) Migration of Jurkat cells, treated with 50 uM of indicated PMO for three days, via interaction with VCAM-1, was assessed as shown in the illustration on the left and the percentages of cells migrated after 5 hr are shown as a bar graph. The experiment was performed in duplicate. Error bar; SD. GTC: Gene Tools control AO, UT: untreated. The gels and blots were cropped for presentation and full-size gels and blots are presented in Supplementary Fig. S5 .

- Submitted by
- Invitrogen Antibodies (provider)
- Main image

- Experimental details
- Figure 4 In vivo validation of peptide-conjugated PMOs (PPMOs) in the mouse EAE model of MS. ( a ) Gel fractionation of RT-PCR products of murine Itga4 amplicons and ( b ) western blot analysis of ITGA4 protein expression from primary murine splenocytes nucleofected with PMOs, as indicated, at 50 uM for 48 hr. Beta tubulin was used as a reference protein. The transcripts with missing exons missing are shown. GTC: Gene Tools control AO, UT: untreated. ( c ) The disease course of EAE mice intraperitoneally injected with PPMOs targeting Itga4 exons 3, 4 and 27 at 10 mg/kg on alternate days, as indicated by arrows. The clinical scores were determined over 21 days as described in Supplementary Table S5 . ( d ) Flow cytometry analysis of infiltrating myeloid cells, and subsets of T cells in brain and secondary lymphoid organs (SLO: spleen/Inguinal lymph nodes pooled). *: m4A(+51 +75) treated mice, #: ant-ITGA4 antibody treatment, ^: m27A(+18 +42) treatment, V: m3D(+5 -20) treatment, *: PBS treatment and *: GTC treatment. Raw data is provided in Supplementary Tables S6 and S7 . ( e ) Representative haematoxylin and eosin staining of the spinal cords isolated from EAE mouse treated with m4A(+51 +75) or GTC PMO (top panel). A box plot for the percentage of area in spinal cords, marked by inflammation (arrow heads), observed in m4A(+51 +75) and GTC treated groups (n = 5 per group). Scale bar: 200 um. Error bars: SEM. GTC: Gene Tools control AO. The gels and blots were cropped for prese

- Submitted by
- Invitrogen Antibodies (provider)
- Main image

- Experimental details
- Figure 4 Modulation of the cytoskeleton network by PE-TB.The cells weretreated with various concentrations of TB. At lower concentration,TB (0.5 muM) showed high expression of tubulin with increasedneurite outgrowth, whereas high TB concentration (5 muM) wasfound to be toxic to cells. PE-TB also showed extended neurite outgrowthat lower concentration, whereas 5 muM PE-TB was cytotoxic. Thefluorescent image of a tubulin-stained single neuronal cell suggestedthat distribution of tubulin was prominently in neurite outgrowthsand Tau was distributed in the cell soma.
