Explore
 Validate
 Learn
Learn Western blot
Antibody data
- Antibody Data
- Antigen structure
- References [0]
- Comments [0]
- Validations
- Western blot [2]
- Immunocytochemistry [3]
- Immunohistochemistry [1]
- Other assay [5]
Submit
Validation data
Reference
Comment
Report error
- Product number
- MA5-11732 - Provider product page

- Provider
- Invitrogen Antibodies
- Product name
- beta Tubulin Monoclonal Antibody (TBN06 (Tub 2.5))
- Antibody type
- Monoclonal
- Antigen
- Purifed from natural sources
- Reactivity
- Human, Mouse, Rat, Bovine, Chicken/Avian, Rabbit
- Host
- Mouse
- Isotype
- IgG
- Antibody clone number
- TBN06 (Tub 2.5)
- Vial size
- 500 µL
- Concentration
- 0.2 mg/mL
- Storage
- 4° C
No comments: Submit comment
Supportive validation
- Submitted by
- Invitrogen Antibodies (provider)
- Main image
- Experimental details
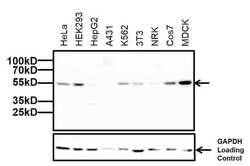
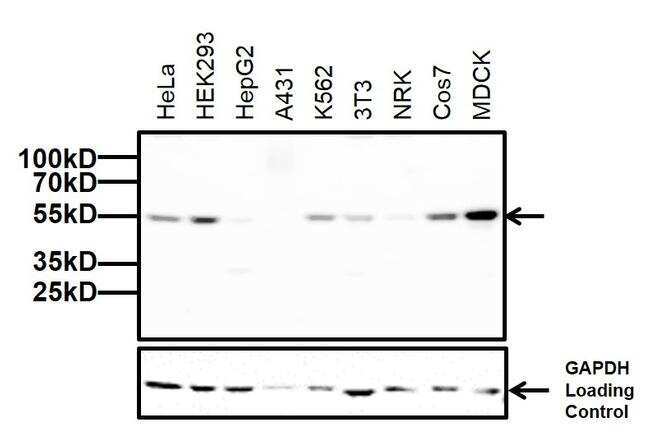
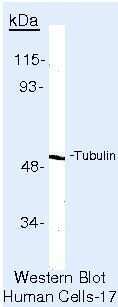
- Western blot analysis of Beta Tubulin was performed by loading 20 µg of the indicated whole cell lysates and 5 µL of PageRuler Plus Prestained Protein Ladder (Product # 26619) onto a 4-20% Tris-Glycine polyacrylamide gel (Product # WT4202BX10). Proteins were transferred to a nitrocellulose membrane using the G2 Blotter (Product # 62288), and blocked with 5% Milk in TBST for 1 hour at room temperature. Beta-Tubulin was detected at ~55 kDa using a Beta Tubulin mouse monoclonal antibody (Product # MA5-11732) at a concentration of 1 µg/mL in blocking buffer overnight at 4C on a rocking platform, followed by a Goat anti-Mouse IgG (H+L) Superclonal™ Secondary Antibody, HRP conjugate (Product # A28177) at a dilution of 1:1000 for at least one hour at room temperature. Chemiluminescent detection was performed using SuperSignal West Pico (Product # 34078).
- Submitted by
- Invitrogen Antibodies (provider)
- Main image
- Experimental details
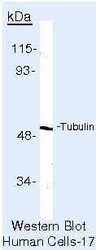
- Western blot of Tubulin Beta using Tubulin Beta Monoclonal Antibody (Product # MA5-11732) on LS174T Cells.
Supportive validation
- Submitted by
- Invitrogen Antibodies (provider)
- Main image
- Experimental details
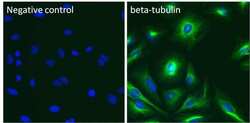
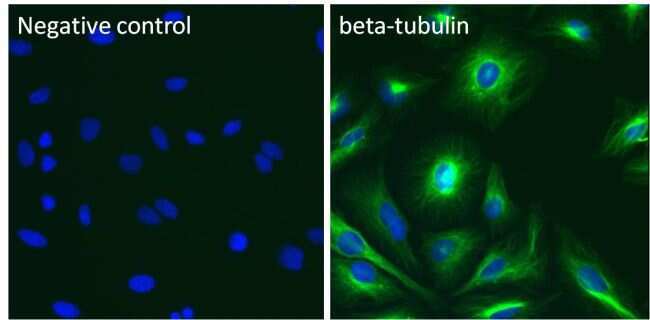
- Immunofluorescent analysis of beta-tubulin (green) in HeLa cells. Cells were fixed and permeabilized with ice-cold methanol for 10 minutes at room temperature, and blocked with 0.3% BSA in PBS for at least 15 minutes at room temperature. Cells were probed with a beta-tubulin monoclonal antibody (Product # MA5-11732) at a dilution of 1:100 (right panel), or incubated in blocking buffer as a negative control (left panel) overnight at 4°C. Cells were washed with PBS, and incubated with a DyLight 488 goat anti-mouse IgG secondary antibody (Product # 35502) at a dilution of 1:250 for at least 1 hour at room temperature. Nuclei (blue) were stained with DAPI (Product # 46190). Images were taken on a Thermo Scientific ToxInsight Instrument at 20X magnification.
- Submitted by
- Invitrogen Antibodies (provider)
- Main image
- Experimental details
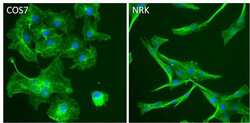
- Immunofluorescent analysis of beta-tubulin (green) in COS7 and NRK cells. Cells were fixed and permeabilized with ice-cold methanol for 10 minutes at room temperature, and blocked with 0.3% BSA in PBS for at least 15 minutes at room temperature. Cells were probed with a beta-tubulin monoclonal antibody (Product # MA5-11732) at a dilution of 1:50 overnight at 4°C. Cells were washed with PBS, and incubated with a DyLight 488 goat anti-mouse IgG secondary antibody (Product # 35502) at a dilution of 1:250 for at least 1 hour at room temperature. Nuclei (blue) were stained with DAPI (Product # 46190). Images were taken on a Thermo Scientific ToxInsight Instrument at 20X magnification.

- Submitted by
- Invitrogen Antibodies (provider)
- Main image

- Experimental details
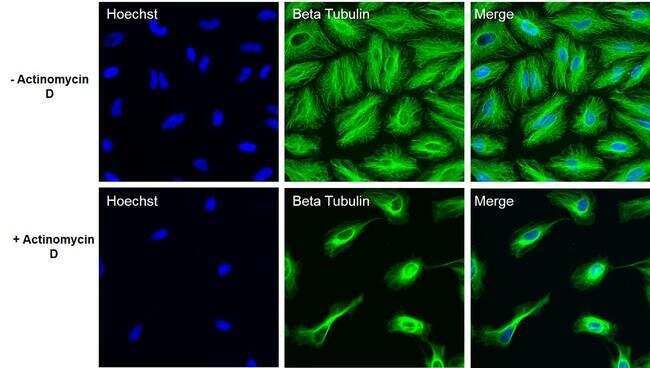
- Immunofluorescent analysis of Beta- Tubulin (green) in HeLa cells untreated or treated with 1uM Actinomycin D for 19 hours. The cells were fixed with 4% Paraformaldehyde for 15 minutes, permeabilized with 0.1% Triton X-100 for 15 minutes, and blocked with 3% BSA for 30 minutes at room temperature. Cells were stained with a Beta-Tubulin mouse monoclonal antibody (Product # MA5-11732) at a concentration of 5 µg/mL in blocking buffer for 1 hour at room temperature, and then incubated with a Goat anti-Mouse IgG (H+L) Secondary Antibody, Alexa Fluor Plus 488 conjugate (Product # A32723) at a dilution of 1:500 for at least 30 minutes at a room temperature in the dark (green). Nuclei (blue) were stained with Hoechst 33342 (Product # 62249). Images were taken on a Thermo Scientific ToxInsight Instrument at 20X magnification.
Supportive validation
- Submitted by
- Invitrogen Antibodies (provider)
- Main image
- Experimental details
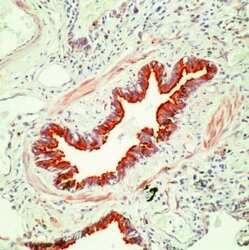
- Formalin-fixed, paraffin-embedded human lung stained with Tubulin beta antibody using peroxidase-conjugate and AEC chromogen. Note cytoplasmic and surface staining of ciliated epithelial cells in bronchiole.

Supportive validation
- Submitted by
- Invitrogen Antibodies (provider)
- Main image
- Experimental details
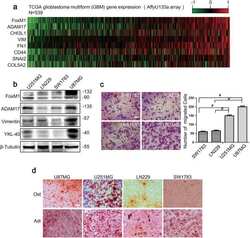
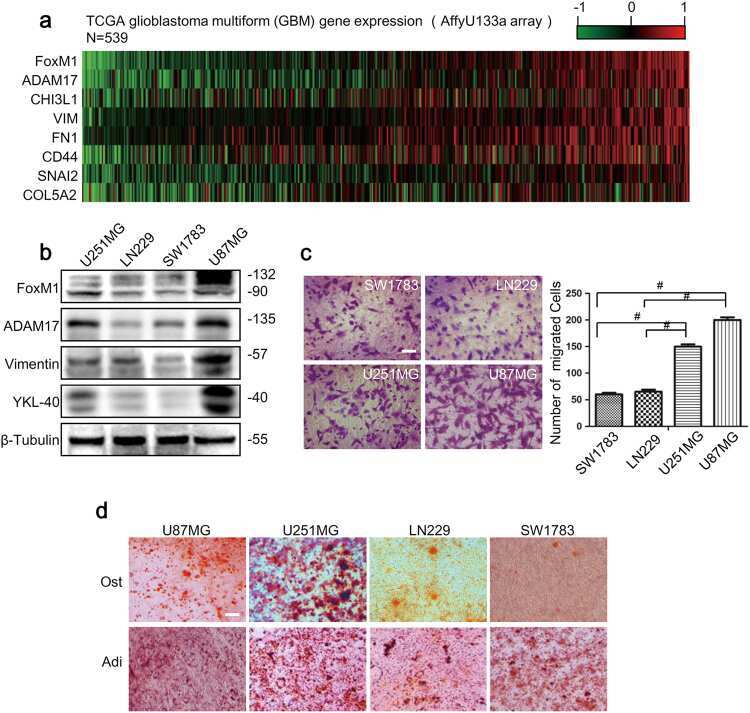
- Fig. 1 The expression profiles of FoxM1 and ADAM17 are positively correlated with mesenchymal features in GBM. a Heatmap of the gene expression profile revealed that FoxM1 and ADAM17 expression profiles were associated with mesenchymal markers expression in glioma specimens from TCGA database. b FoxM1, ADAM17 and mesenchymal markers expression in glioma cells were detected by western blot. beta-Tubulin was used as a loading control. c The transwell migration assay was conducted to count the migrated cells of four glioma cell lines. Scale bar = 100 mum. The data are shown as the mean +- s.d. of three independent experiments. Student's t test was used to determine the significance of the differences between the groups ( # P < 0.0001, Student's t test) . d The conditional medium was used to investigate the osteogenesis and adipogenesis potential of four glioma cell lines. Scale bar = 100 mum. Ost osteogenesis, Adi adipogenesis
- Submitted by
- Invitrogen Antibodies (provider)
- Main image
- Experimental details
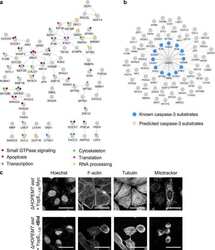
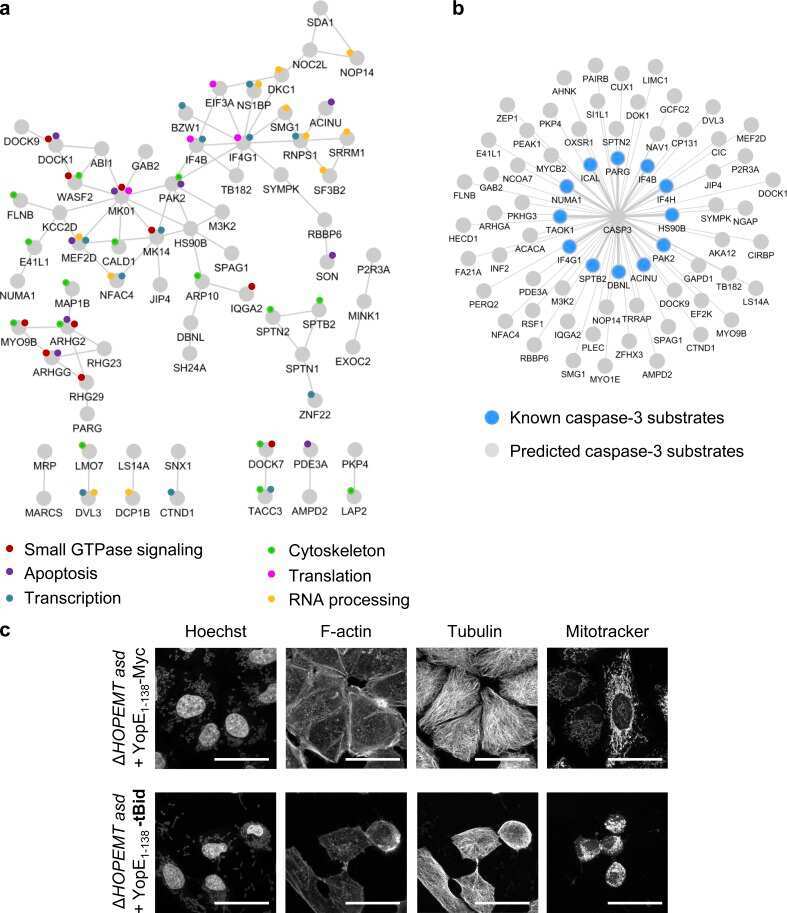
- Figure 10. Analysis of t-BID-dependent phosphoproteome. (a) Representation of the functional protein interaction network of the tBID phosphoproteome. Proteins, containing at least one phosphopeptide undergoing a change in phosphorylation after tBID delivery (light gray; q-value < 0.04) are represented in a STRING network (high-confidence, score 0.7). Only proteins with at least one connection in STRING are shown. Colored circles depict the biological annotation of proteins as obtained from DAVID ( Table S5 ). (b) Graphical representation of CASP3 known (color) and predicted substrates (gray) as shown in Table S1 . (c) Confocal images of HeLa cells infected with either Delta HOPEMT asd + YopE 1-138 or Delta HOPEMT asd + YopE 1-138 -tBID reveal the induction of an apoptotic phenotype after tBID delivery. Cells were stained for the nuclei with Hoechst, for F-actin with phalloidin, for tubulin with an anti-tubulin antibody, and for mitochondria with Mitotracker. Bars, 40 um.
- Submitted by
- Invitrogen Antibodies (provider)
- Main image
- Experimental details
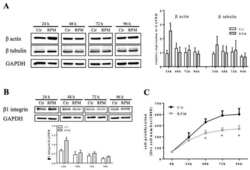
- Figure 2 Modulation of cell mechanosensors and proliferation. ( A , B ) Representative immunoblots of beta actin, beta tubulin, and beta1 integrin expression levels in extracts from control cells at 1g (Ctr) or cells exposed to s-microgravity (RPM) at different exposure times (24-96 h). The densitometric analyses are plotted as the relative expression calculated as a ratio between the optical density (OD) x mm 2 of each band and OD x mm 2 of the corresponding GAPDH band, used as loading control. ( C ) Cell proliferation tested on Ctr and RPM-exposed cells at different exposure times (24-96 h). The data are presented as the means +- SEM from three independent experiments. * p < 0.05 vs. Ctr .

- Submitted by
- Invitrogen Antibodies (provider)
- Main image
- Experimental details
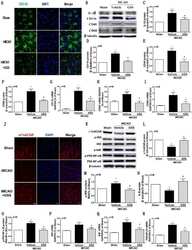
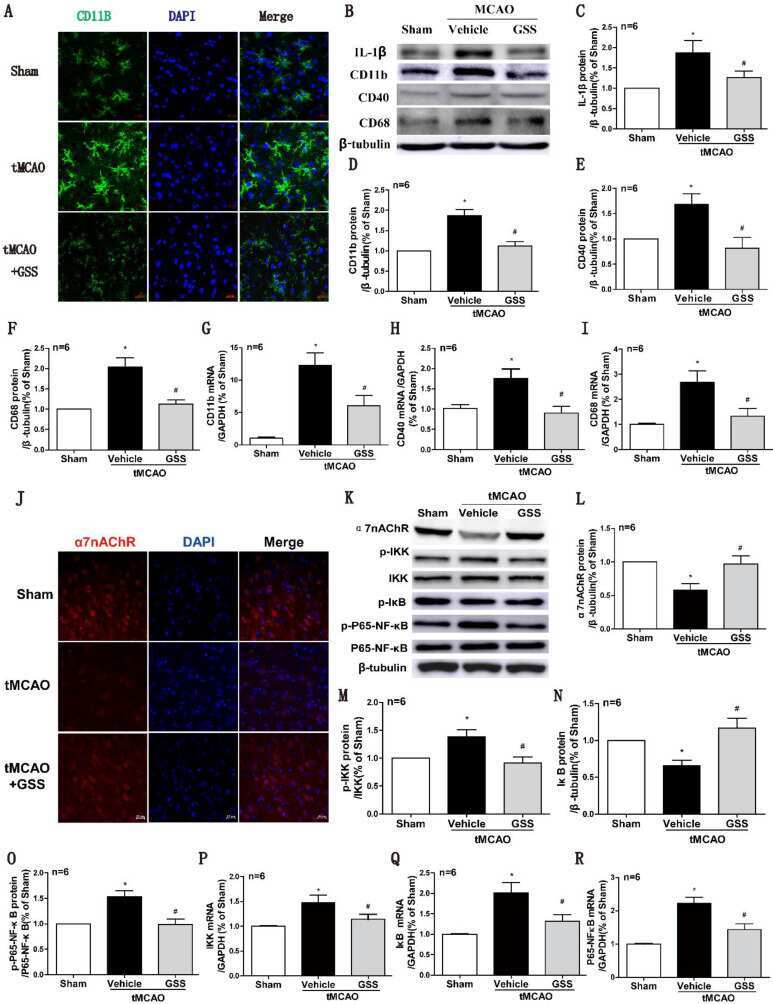
- Figure 2 GSS treatment inhibited microglial M1 polarization and alpha7nAChR-NF-kappaB signaling activation in tMCAO rats. Microglial M1 depolarization and alpha7nAChR-NF-kappaB signaling activation in the ischemic penumbra region was determined 24 h I/R. (A) Microglia morphology was determined by immunofluorescent staining of CD11b (Scale bar = 20 mum, n=6). (B-F) Western results of IL-1beta, CD11b, CD40 and CD68. (G-I) CD11b, CD40 and CD68 mRNA expression determined by qPCR. (J) Representative images of immunofluorescent staining of alpha7nAChR (Scale bar = 20 mum, n=6). (K-O) Western blot results of alpha7nAChR and NF-kappaB signaling proteins. (P-R), the qPCR results of IKK, IkappaB and P65-NF-kappaB mRNA expression. Comparisons between groups were carried out using one-way ANOVA followed by Newman-Keuls test. *P
- Submitted by
- Invitrogen Antibodies (provider)
- Main image
- Experimental details
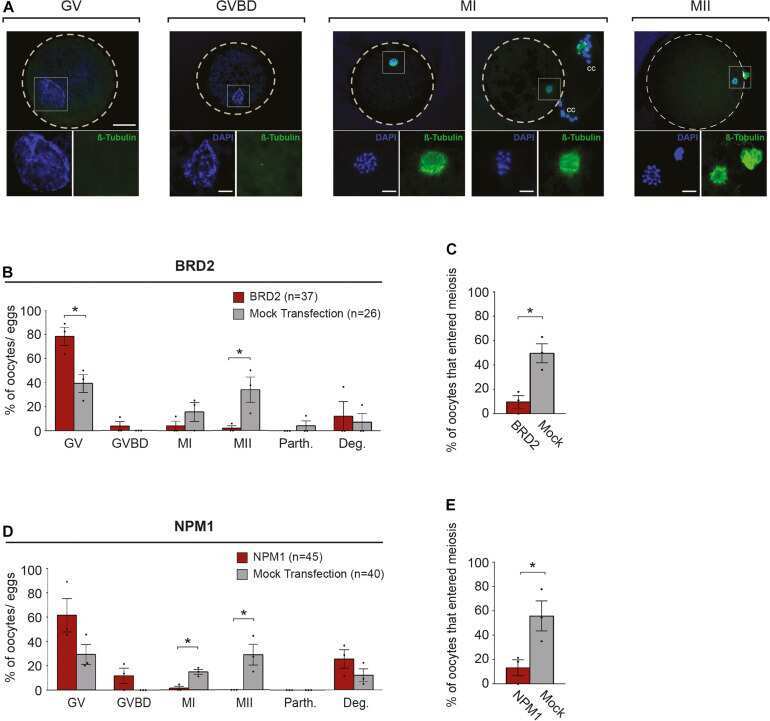
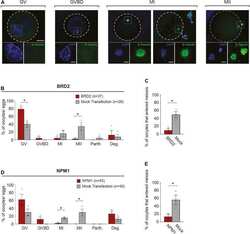
- FIGURE 3 Meiotic progression of BRD2 and NPM1-inhibited oocytes following 6 h of in vitro maturation (IVM). (A) Representative images of meiotic stages: GV- germinal vesicle, GVBD- germinal vesicle break-down, MI- metaphase I, and MII- metaphase II. Top images: merged FITC (anti-beta-Tubulin) and DAPI images. Outer dashed line delineates oocyte boundary. Scale bar = 50 mum. Lower images in squares: magnified area of chromatin configuration (DAPI) and meiotic spindle (beta-Tubulin). Scale bar = 10 mum. cc = cumulus cells. (B,D) Bar graphs showing the percentage of oocytes in each meiotic stage following protein inhibition and 6 h of IVM. GV, GVBD, MI, MII, Parth.- parthenotes, Deg.- degraded. (C,E) Bar graphs showing percentage of oocytes that entered meiosis following 6 h of IVM. Red bars = indicated protein inhibited, Gray bars = mock transfection control. Bars show mean +- SEM (3 replicates). * P < 0.05.