Explore
 Validate
 Learn
Learn Western blot
 Chromatin Immunoprecipitation
Antibody data
- Antibody Data
- Antigen structure
- References [2]
- Comments [0]
- Validations
- Chromatin Immunoprecipitation [1]
- Other assay [2]
Submit
Validation data
Reference
Comment
Report error
- Product number
- PA1-21780 - Provider product page

- Provider
- Invitrogen Antibodies
- Product name
- CDK8 Polyclonal Antibody
- Antibody type
- Polyclonal
- Antigen
- Synthetic peptide
- Reactivity
- Human, Mouse, Rat
- Host
- Rabbit
- Isotype
- IgG
- Vial size
- 500 µL
- Concentration
- 0.2 mg/mL
- Storage
- 4° C, do not freeze
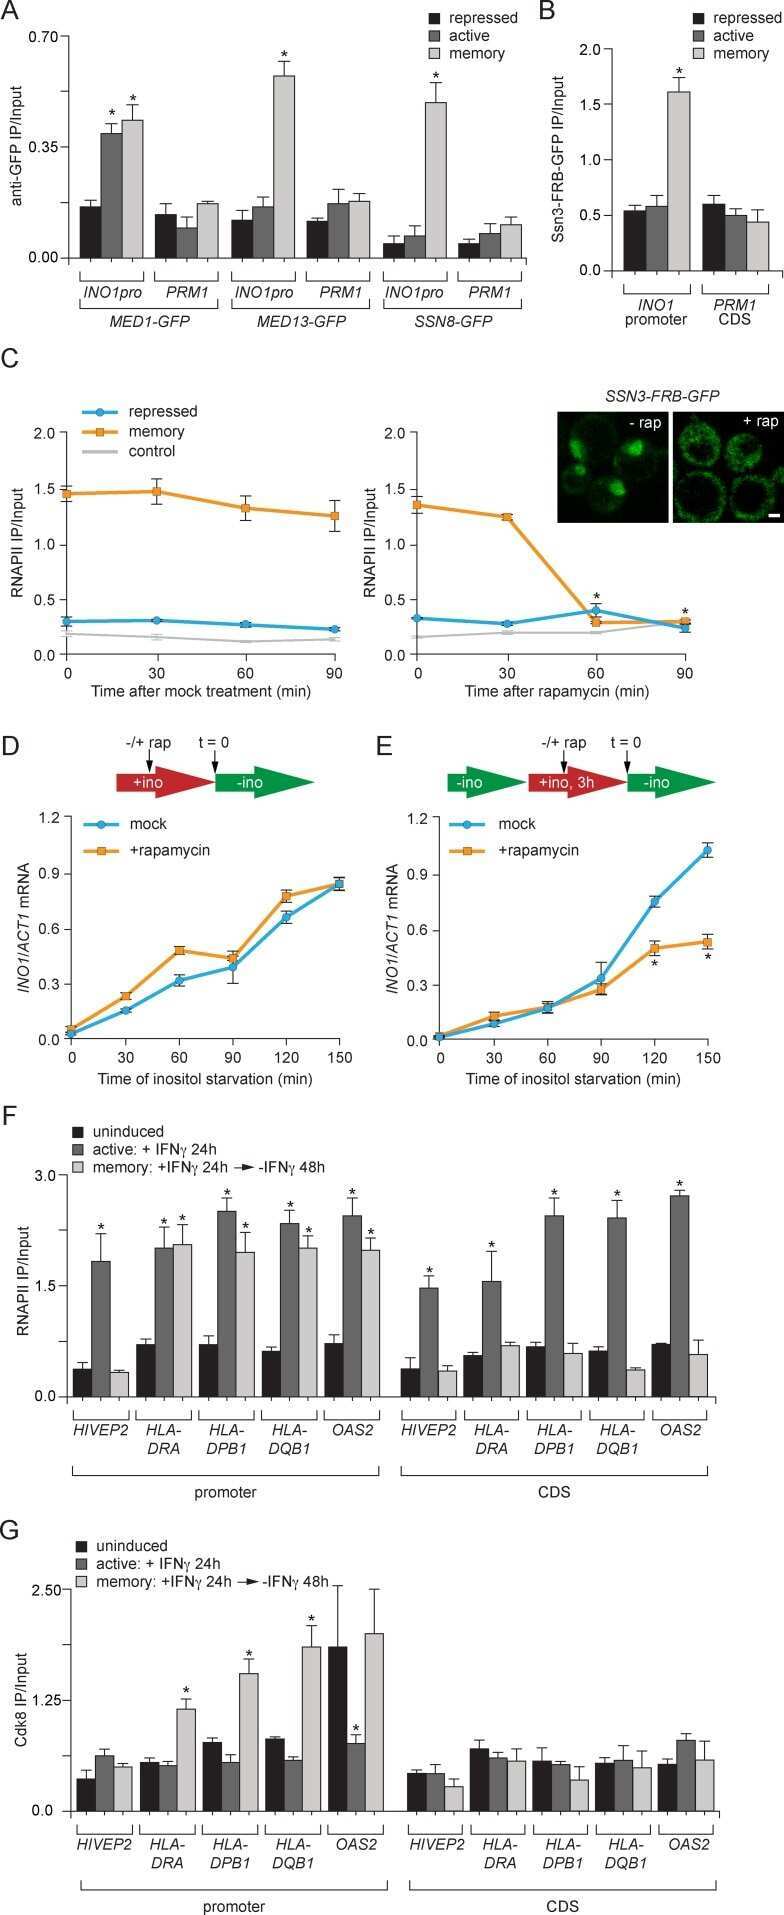
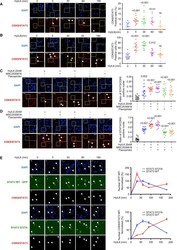
Submitted references CDK8 Fine-Tunes IL-6 Transcriptional Activities by Limiting STAT3 Resident Time at the Gene Loci.
Set1/COMPASS and Mediator are repurposed to promote epigenetic transcriptional memory.
Martinez-Fabregas J, Wang L, Pohler E, Cozzani A, Wilmes S, Kazemian M, Mitra S, Moraga I
Cell reports 2020 Dec 22;33(12):108545
Cell reports 2020 Dec 22;33(12):108545
Set1/COMPASS and Mediator are repurposed to promote epigenetic transcriptional memory.
D'Urso A, Takahashi YH, Xiong B, Marone J, Coukos R, Randise-Hinchliff C, Wang JP, Shilatifard A, Brickner JH
eLife 2016 Jun 23;5
eLife 2016 Jun 23;5
No comments: Submit comment
Supportive validation
- Submitted by
- Invitrogen Antibodies (provider)
- Main image
- Experimental details
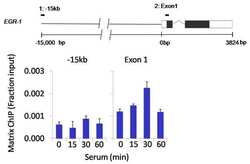
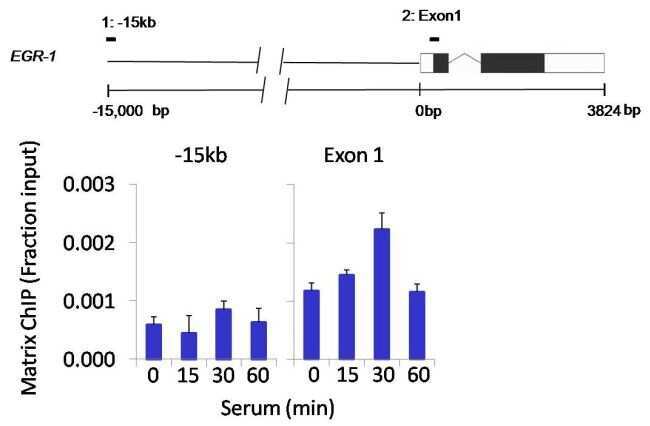
- Chromatin immunoprecipitation analysis of Cdk8 was performed using cross-linked chromatin from 1 x 10⁶ HCT116 colon carcinoma cells treated with serum for 0, 15, 30, and 60 minutes. Immunoprecipitation was performed using a multiplex microplate Matrix ChIP assay (see reference for Matrix ChIP protocol: http://www.ncbi.nlm.nih.gov/pubmed/22098709) with 1.0 µL/100 µL well volume of a Cdk8 polyclonal antibody (Product # PA1-21780). Chromatin aliquots from ~1 x 10⁵ cells were used per ChIP pull-down. Quantitative PCR data were done in quadruplicate using 1 µL of eluted DNA in 2 µL SYBR real-time PCR reactions containing primers to amplify -15kb upstream of the Egr1 gene or exon-1 of Egr1. PCR calibration curves were generated for each primer pair from a dilution series of sheared total genomic DNA. Quantitation of immunoprecipitated chromatin is presented as signal relative to the total amount of input chromatin. Results represent the mean +/- SEM for three experiments. A schematic representation of the Egr-1 locus is shown above the data where boxes represent exons (black boxes = translated regions, white boxes = untranslated regions); the zigzag line represents an intron; and the straight line represents upstream sequence. Regions amplified by Egr-1 primers are represented by black bars. Data courtesy of the Innovators Program.
Supportive validation
- Submitted by
- Invitrogen Antibodies (provider)
- Main image
- Experimental details
- NULL
- Submitted by
- Invitrogen Antibodies (provider)
- Main image
- Experimental details
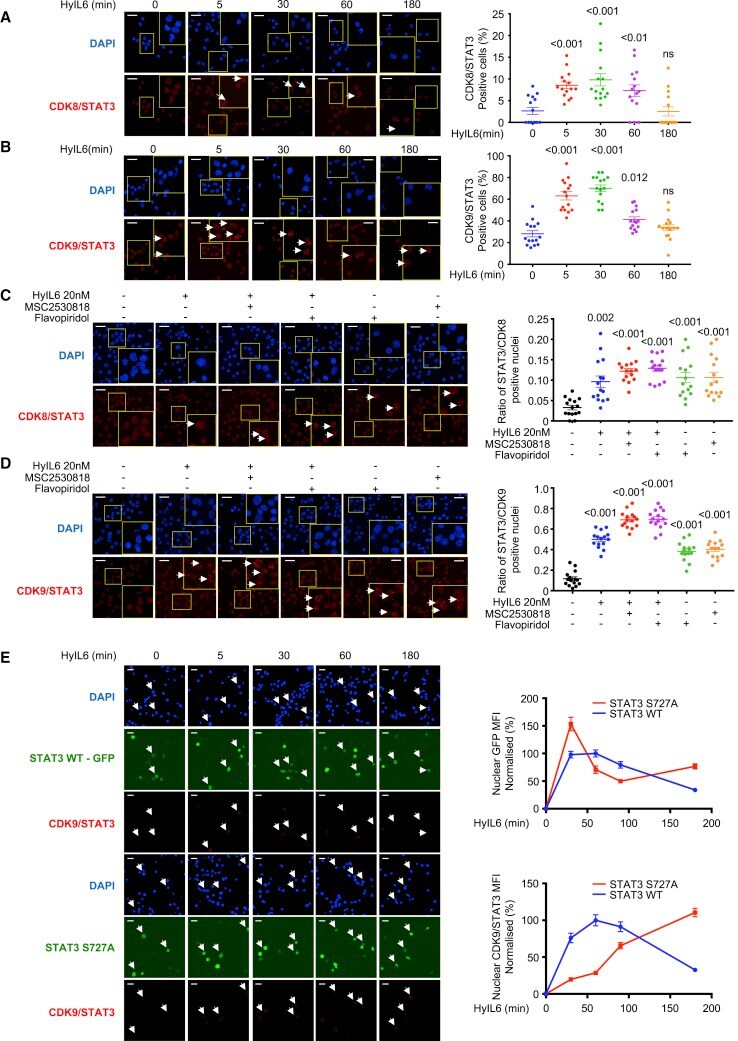
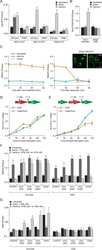
- Figure 4 PLA Analysis of the Interaction of STAT3 and CDK8/9 Induced upon HyIL-6 Stimulation in Human Primary CD4 + Th-1 Cells (A and B) Kinetics of the STAT3/CDK8 (A) or STAT3/CDK9 (B) interaction induced by 20 nM HyIL-6 in human primary CD4 + Th-1 cells. Scale bars, 20 mum. Statistical significance was calculated by one-way ANOVA. (C and D) STAT3/CDK8 (C) or STAT3/CDK9 (D) interactions were analyzed by PLA upon 20 nM HyIL-6 stimulation in the absence or presence of 2 muM MSC2530818 or 2 muM flavopiridol or upon treatment with the inhibitor only. Scale bars, 20 mum. Statistical significance was calculated by unpaired t test. White arrows in A to D indicate examples of cells where interaction signal was detected. Cumulative plots from n = 15 pictures alongside show the percentage of positive cells. Error bars show mean +- SEM. The p values were calculated based on non-parametric two-tailed Wilcoxon rank-sum test against the control group (first bar on the left). (E) STAT3/CDK9 interaction analyzed by PLA upon 20 nM HyIL-6 stimulation in STAT3 KnD Hut78 cells reconstituted with STAT3 WT-GFP (top panel) or STAT3 S727A-GFP (bottom panels). White arrows indicate examples of cells expressing the recombinant protein and where the STAT3/CDK9 interaction was detected by PLA. Scale bars, 20 mum. Graphs alongside show the nuclear GFP MFI normalized to unstimulated cells (top graph) or the nuclear STAT3/CDK9 PLA MFI in GFP-positive cells normalized to unstimulated cells (bottom graph).