 Explore
 Validate
 Learn
Learn Immunocytochemistry
 Immunohistochemistry
Antibody data
- Antibody Data
- Antigen structure
- References [20]
- Comments [0]
- Validations
- Immunocytochemistry [2]
- Flow cytometry [2]
- Other assay [12]
Submit
Validation data
Reference
Comment
Report error
- Product number
- 11-5699-41 - Provider product page

- Provider
- Invitrogen Antibodies
- Product name
- Ki-67 Monoclonal Antibody (20Raj1), FITC, eBioscience™
- Antibody type
- Monoclonal
- Antigen
- Other
- Description
- Description: The monoclonal antibody 20Raj1 recognizes the human Ki-67 protein. Two isoforms of Ki-67 exist, a 345 and 395 kDa form that are expressed in dividing cells. Ki-67 is expressed in all cell types and is detectable during active phases of the cell cycle (G1, S, G2, and mitosis) but is absent from resting cells (G0). During interphase, Ki-67 expression is localized to the nucleus but redistributes to the chromosomes during mitosis and has specifically been found to associate with heterochromatin-bound proteins such as chromobox protein homolog 3 (CBX3). In studies of tumor cells, Ki-67 expression has been used as a marker for determining the fraction of proliferating cells within a given population of tumor cells. This monoclonal antibody 20Raj1 recognizes canine Ki-67. Applications Reported: This 20Raj1 antibody has been reported for use in intracellular staining followed by flow cytometric analysis, immunohistochemical staining, and immunocytochemistry. Applications Tested: This 20Raj1 antibody has been pre-titrated and tested by intracellular staining and flow cytometric analysis of stimulated normal human peripheral blood cells using the Foxp3/Transcription Factor Staining Buffer Set (Product # 00-5523-00) and protocol. Please see BestProtocols® Section (Staining intracellular Antigens for Flow Cytometry) for staining protocol (refer to Protocol B: One-step protocol for intracellular (nuclear) proteins). This can be used at 5 µL (0.06 µg) per test. A test is defined as the amount (µg) of antibody that will stain a cell sample in a final volume of 100 µL. Cell number should be determined empirically but can range from 10^5 to 10^8 cells/test. Excitation: 488 nm; Emission: 520 nm; Laser: Blue Laser. Filtration: 0.2 µm post-manufacturing filtered.
- Reactivity
- Human, Canine
- Host
- Mouse
- Conjugate
- Green dye
- Isotype
- IgG
- Antibody clone number
- 20Raj1
- Vial size
- 25 Tests
- Concentration
- 5 μL/Test
- Storage
- 4°C, store in dark, DO NOT FREEZE!
Submitted references Protein/AS01(B) vaccination elicits stronger, more Th2-skewed antigen-specific human T follicular helper cell responses than heterologous viral vectors.
Analysis of CAR-Mediated Tonic Signaling.
Inhibition of two-pore channels in antigen-presenting cells promotes the expansion of TNFR2-expressing CD4(+)Foxp3(+) regulatory T cells.
Functional Study of the Retrotransposon-Derived Human PEG10 Protease.
Single residue in CD28-costimulated CAR-T cells limits long-term persistence and antitumor durability.
Human Liver Memory CD8(+) T Cells Use Autophagy for Tissue Residence.
Streptomyces Levis ABRIINW111 Inhibits SW480 Cells Growth by Apoptosis Induction.
Involvement of TWEAK and the NF-κB signaling pathway in lupus nephritis.
Small-Vessel Vasculopathy Due to Aberrant Autophagy in LAMP-2 Deficiency.
ATP Release from Chemotherapy-Treated Dying Leukemia Cells Elicits an Immune Suppressive Effect by Increasing Regulatory T Cells and Tolerogenic Dendritic Cells.
Impact of (chemo)radiotherapy on immune cell composition and function in cervical cancer patients.
Core Transcription Factors, MicroRNAs, and Small Molecules Drive Transdifferentiation of Human Fibroblasts Towards The Cardiac Cell Lineage.
S100A6 Regulates Endothelial Cell Cycle Progression by Attenuating Antiproliferative Signal Transducers and Activators of Transcription 1 Signaling.
Characterization of Human CD8 T Cell Responses in Dengue Virus-Infected Patients from India.
Monitoring regulatory T cells in clinical samples: consensus on an essential marker set and gating strategy for regulatory T cell analysis by flow cytometry.
A phase 1/2 study combining gemcitabine, Pegintron and p53 SLP vaccine in patients with platinum-resistant ovarian cancer.
Type I IFNs and IL-18 regulate the antiviral response of primary human γδ T cells against dendritic cells infected with Dengue virus.
Interleukin-7 and Toll-like receptor 7 induce synergistic B cell and T cell activation.
Biliary tree stem cells, precursors to pancreatic committed progenitors: evidence for possible life-long pancreatic organogenesis.
Characteristics of CD8+ T cell subsets in Chinese patients with chronic HIV infection during initial ART.
Nielsen CM, Ogbe A, Pedroza-Pacheco I, Doeleman SE, Chen Y, Silk SE, Barrett JR, Elias SC, Miura K, Diouf A, Bardelli M, Dabbs RA, Barfod L, Long CA, Haynes BF, Payne RO, Minassian AM, Bradley T, Draper SJ, Borrow P
Cell reports. Medicine 2021 Mar 16;2(3):100207
Cell reports. Medicine 2021 Mar 16;2(3):100207
Analysis of CAR-Mediated Tonic Signaling.
Calderon H, Mamonkin M, Guedan S
Methods in molecular biology (Clifton, N.J.) 2020;2086:223-236
Methods in molecular biology (Clifton, N.J.) 2020;2086:223-236
Inhibition of two-pore channels in antigen-presenting cells promotes the expansion of TNFR2-expressing CD4(+)Foxp3(+) regulatory T cells.
He T, Yang D, Li XQ, Jiang M, Islam MS, Chen S, Chen Y, Yang Y, Chou CK, Trivett AL, Oppenheim JJ, Chen X
Science advances 2020 Sep;6(40)
Science advances 2020 Sep;6(40)
Functional Study of the Retrotransposon-Derived Human PEG10 Protease.
Golda M, Mótyán JA, Mahdi M, Tőzsér J
International journal of molecular sciences 2020 Mar 31;21(7)
International journal of molecular sciences 2020 Mar 31;21(7)
Single residue in CD28-costimulated CAR-T cells limits long-term persistence and antitumor durability.
Guedan S, Madar A, Casado-Medrano V, Shaw C, Wing A, Liu F, Young RM, June CH, Posey AD Jr
The Journal of clinical investigation 2020 Jun 1;130(6):3087-3097
The Journal of clinical investigation 2020 Jun 1;130(6):3087-3097
Human Liver Memory CD8(+) T Cells Use Autophagy for Tissue Residence.
Swadling L, Pallett LJ, Diniz MO, Baker JM, Amin OE, Stegmann KA, Burton AR, Schmidt NM, Jeffery-Smith A, Zakeri N, Suveizdyte K, Froghi F, Fusai G, Rosenberg WM, Davidson BR, Schurich A, Simon AK, Maini MK
Cell reports 2020 Jan 21;30(3):687-698.e6
Cell reports 2020 Jan 21;30(3):687-698.e6
Streptomyces Levis ABRIINW111 Inhibits SW480 Cells Growth by Apoptosis Induction.
Faramarzian Azimi Maragheh B, Fatourachi P, Mohammadi SM, Valipour B, Behtari M, Dehnad A, Nozad Charoudeh H
Advanced pharmaceutical bulletin 2018 Nov;8(4):675-682
Advanced pharmaceutical bulletin 2018 Nov;8(4):675-682
Involvement of TWEAK and the NF-κB signaling pathway in lupus nephritis.
Sun F, Teng J, Yu P, Li W, Chang J, Xu H
Experimental and therapeutic medicine 2018 Mar;15(3):2611-2619
Experimental and therapeutic medicine 2018 Mar;15(3):2611-2619
Small-Vessel Vasculopathy Due to Aberrant Autophagy in LAMP-2 Deficiency.
Nguyen HT, Noguchi S, Sugie K, Matsuo Y, Nguyen CTH, Koito H, Shiojima I, Nishino I, Tsukaguchi H
Scientific reports 2018 Feb 20;8(1):3326
Scientific reports 2018 Feb 20;8(1):3326
ATP Release from Chemotherapy-Treated Dying Leukemia Cells Elicits an Immune Suppressive Effect by Increasing Regulatory T Cells and Tolerogenic Dendritic Cells.
Lecciso M, Ocadlikova D, Sangaletti S, Trabanelli S, De Marchi E, Orioli E, Pegoraro A, Portararo P, Jandus C, Bontadini A, Redavid A, Salvestrini V, Romero P, Colombo MP, Di Virgilio F, Cavo M, Adinolfi E, Curti A
Frontiers in immunology 2017;8:1918
Frontiers in immunology 2017;8:1918
Impact of (chemo)radiotherapy on immune cell composition and function in cervical cancer patients.
van Meir H, Nout RA, Welters MJ, Loof NM, de Kam ML, van Ham JJ, Samuels S, Kenter GG, Cohen AF, Melief CJ, Burggraaf J, van Poelgeest MI, van der Burg SH
Oncoimmunology 2017;6(2):e1267095
Oncoimmunology 2017;6(2):e1267095
Core Transcription Factors, MicroRNAs, and Small Molecules Drive Transdifferentiation of Human Fibroblasts Towards The Cardiac Cell Lineage.
Christoforou N, Chakraborty S, Kirkton RD, Adler AF, Addis RC, Leong KW
Scientific reports 2017 Jan 10;7:40285
Scientific reports 2017 Jan 10;7:40285
S100A6 Regulates Endothelial Cell Cycle Progression by Attenuating Antiproliferative Signal Transducers and Activators of Transcription 1 Signaling.
Lerchenmüller C, Heißenberg J, Damilano F, Bezzeridis VJ, Krämer I, Bochaton-Piallat ML, Hirschberg K, Busch M, Katus HA, Peppel K, Rosenzweig A, Busch H, Boerries M, Most P
Arteriosclerosis, thrombosis, and vascular biology 2016 Sep;36(9):1854-67
Arteriosclerosis, thrombosis, and vascular biology 2016 Sep;36(9):1854-67
Characterization of Human CD8 T Cell Responses in Dengue Virus-Infected Patients from India.
Chandele A, Sewatanon J, Gunisetty S, Singla M, Onlamoon N, Akondy RS, Kissick HT, Nayak K, Reddy ES, Kalam H, Kumar D, Verma A, Panda H, Wang S, Angkasekwinai N, Pattanapanyasat K, Chokephaibulkit K, Medigeshi GR, Lodha R, Kabra S, Ahmed R, Murali-Krishna K
Journal of virology 2016 Dec 15;90(24):11259-11278
Journal of virology 2016 Dec 15;90(24):11259-11278
Monitoring regulatory T cells in clinical samples: consensus on an essential marker set and gating strategy for regulatory T cell analysis by flow cytometry.
Santegoets SJ, Dijkgraaf EM, Battaglia A, Beckhove P, Britten CM, Gallimore A, Godkin A, Gouttefangeas C, de Gruijl TD, Koenen HJ, Scheffold A, Shevach EM, Staats J, Taskén K, Whiteside TL, Kroep JR, Welters MJ, van der Burg SH
Cancer immunology, immunotherapy : CII 2015 Oct;64(10):1271-86
Cancer immunology, immunotherapy : CII 2015 Oct;64(10):1271-86
A phase 1/2 study combining gemcitabine, Pegintron and p53 SLP vaccine in patients with platinum-resistant ovarian cancer.
Dijkgraaf EM, Santegoets SJ, Reyners AK, Goedemans R, Nijman HW, van Poelgeest MI, van Erkel AR, Smit VT, Daemen TA, van der Hoeven JJ, Melief CJ, Welters MJ, Kroep JR, van der Burg SH
Oncotarget 2015 Oct 13;6(31):32228-43
Oncotarget 2015 Oct 13;6(31):32228-43
Type I IFNs and IL-18 regulate the antiviral response of primary human γδ T cells against dendritic cells infected with Dengue virus.
Tsai CY, Liong KH, Gunalan MG, Li N, Lim DS, Fisher DA, MacAry PA, Leo YS, Wong SC, Puan KJ, Wong SB
Journal of immunology (Baltimore, Md. : 1950) 2015 Apr 15;194(8):3890-900
Journal of immunology (Baltimore, Md. : 1950) 2015 Apr 15;194(8):3890-900
Interleukin-7 and Toll-like receptor 7 induce synergistic B cell and T cell activation.
Bikker A, Kruize AA, van der Wurff-Jacobs KM, Peters RP, Kleinjan M, Redegeld F, de Jager W, Lafeber FP, van Roon JA
PloS one 2014;9(4):e94756
PloS one 2014;9(4):e94756
Biliary tree stem cells, precursors to pancreatic committed progenitors: evidence for possible life-long pancreatic organogenesis.
Wang Y, Lanzoni G, Carpino G, Cui CB, Dominguez-Bendala J, Wauthier E, Cardinale V, Oikawa T, Pileggi A, Gerber D, Furth ME, Alvaro D, Gaudio E, Inverardi L, Reid LM
Stem cells (Dayton, Ohio) 2013 Sep;31(9):1966-79
Stem cells (Dayton, Ohio) 2013 Sep;31(9):1966-79
Characteristics of CD8+ T cell subsets in Chinese patients with chronic HIV infection during initial ART.
Jiao Y, Hua W, Zhang T, Zhang Y, Ji Y, Zhang H, Wu H
AIDS research and therapy 2011 Mar 25;8:15
AIDS research and therapy 2011 Mar 25;8:15
No comments: Submit comment
Supportive validation
- Submitted by
- Invitrogen Antibodies (provider)
- Main image

- Experimental details
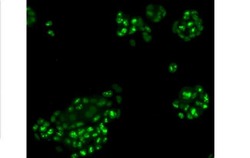
- Immunocytochemistry of fixed and permeabilized MCF7 cells stained with 10 µg/mL of Anti-Human Ki-67 FITC.
- Conjugate
- Green dye

- Submitted by
- Invitrogen Antibodies (provider)
- Main image
- Experimental details
- Immunocytochemistry of fixed and permeabilized MCF7 cells stained with 10 µg/mL of Anti-Human Ki-67 FITC.

Supportive validation
- Submitted by
- Invitrogen Antibodies (provider)
- Main image

- Experimental details
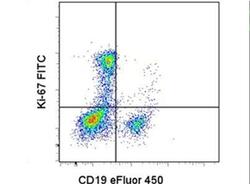
- Intracellular staining of normal human peripheral blood cells stimulated for 2-day with immobilized Anti-Human CD3 (Product # 16-0037-81) with Anti-Human CD19 eFluor® 450 (Product # 48-0199-42) and Anti-Human Ki-67 FITC (right). Staining was performed using the Foxp3/Transcription Factor Buffer Set (Product # 00-5523-00).
- Conjugate
- Green dye

- Submitted by
- Invitrogen Antibodies (provider)
- Main image
- Experimental details
- Intracellular staining of normal human peripheral blood cells stimulated for 2-day with immobilized Anti-Human CD3 (Product # 16-0037-81) with Anti-Human CD19 eFluor® 450 (Product # 48-0199-42) and Anti-Human Ki-67 FITC (right). Staining was performed using the Foxp3/Transcription Factor Buffer Set (Product # 00-5523-00).

Supportive validation
- Submitted by
- Invitrogen Antibodies (provider)
- Main image

- Experimental details
- NULL
- Conjugate
- Green dye

- Submitted by
- Invitrogen Antibodies (provider)
- Main image

- Experimental details
- NULL
- Conjugate
- Green dye

- Submitted by
- Invitrogen Antibodies (provider)
- Main image

- Experimental details
- NULL
- Conjugate
- Green dye

- Submitted by
- Invitrogen Antibodies (provider)
- Main image

- Experimental details
- NULL
- Conjugate
- Green dye

- Submitted by
- Invitrogen Antibodies (provider)
- Main image

- Experimental details
- NULL
- Conjugate
- Green dye

- Submitted by
- Invitrogen Antibodies (provider)
- Main image

- Experimental details
- Figure 2 Immunofluorescence characterization of transdifferentiated iCM (cardiac TF and microRNA). ( A ) Expression of ACTN2 and TNNT2 or ( B ) Expression of TNNT2 and Ki67 in HDF transdifferentiated for 2 weeks using induced expression of GATA4, TBX5, MEF2C, MYOCD, NKX2-5 and transfection with hsa-miR-1 and hsa-miR-133a. (Controls: M2rtTA only, microRNA only, cardiac TF only). ( C ) ACTN2. Panels on the right show varying degrees of cytoskeletal organization of ACTN2. ( D ) TNNT2. Panels on the right show varying degrees of cytoskeletal organization of TNNT2. ( E ) ACTN2 and GJA1. ( F ) TNNT2 and Ki67 expression in iCM. ( G ) VIM and MYH6/7. ( H ) TAGLN. ( I ) SMA. ( J ) MYH11. ( K ) ACTN2 expression in iCM 4 weeks following initiation of transdifferentiation. Panels on the right show varying degrees of cytoskeletal organization of ACTN2. ( L ) TNNT2 expression in iCM 4 weeks following initiation of transdifferentiation. Panels on the right show varying degrees of cytoskeletal organization of TNNT2.
- Conjugate
- Green dye

- Submitted by
- Invitrogen Antibodies (provider)
- Main image

- Experimental details
- Figure 6 Determining the effect of small molecule inhibitors on transdifferentiation efficiency. ( A ) Immunofluorescence of transdifferentiated cells (ACTN2/TNNT2) during exposure to small molecule inhibitors: Janus protein tyrosine kinase 1 (JAK1i), Sodium Butyrate (HDACi), SB431542 (TGFbetai), CHIR99021 (GSK3i). ( B ) Number of nuclei, ( C ) Number of ACTN2 + cells, and ( D ) Number of TNNT2 + cells (per mm 2 ). ( E ) Number of Ki67 + nuclei normalized to the total number of nuclei. ( F ) Number of ACTN2 + cells normalized to the total number of nuclei. ( G ) Number of TNNT2 + cells normalized to the total number of nuclei. Experiment performed in triplicate. 4 images were analyzed for each experiment. Error bar represents calculated standard deviation. Significant difference between two values was calculated using t-test (two-tailed distribution, two sample unequal variance).
- Conjugate
- Green dye

- Submitted by
- Invitrogen Antibodies (provider)
- Main image

- Experimental details
- Figure 7 Determining the effect of protein ligands on transdifferentiation efficiency. ( A ) Immunofluorescence of transdifferentiated cells (ACTN2/TNNT2) during exposure to protein ligands: IGF1, EGF, NRG1, SDF1A. ( B ) Number of nuclei, ( C ) Number of ACTN2 + cells, and ( D ) Number of TNNT2 + cells (per mm 2 ). ( E ) Number of Ki67 + nuclei normalized to the total number of nuclei. ( F ) Number of ACTN2 + cells normalized to the total number of nuclei. ( G ) Number of TNNT2 + cells normalized to the total number of nuclei. Experiment performed in triplicate. 4 images were analyzed for each experiment. Error bar represents calculated standard deviation. Significant difference between two values was calculated using t-test (two-tailed distribution, two sample unequal variance).
- Conjugate
- Green dye

- Submitted by
- Invitrogen Antibodies (provider)
- Main image

- Experimental details
- Figure 12 PR PEG10 influences the proliferation of HEK293T cells. In the cell proliferation assay, HEK293T ( a ) and HaCaT cells ( b ) were stained with FITC-conjugated anti-Ki67 antibody, which was detected using a flow cytometer (FACS). Significance values were determined as compared to mock control, otherwise they are indicated. Note: * p 0.05). Error bars represent SD ( n >= 2).
- Conjugate
- Green dye

- Submitted by
- Invitrogen Antibodies (provider)
- Main image

- Experimental details
- Figure 1 PfRH5 vaccination with the ChAd63-MVA platform induces greater activation of total circulating CD8 + and CD4 + T cell populations, while the protein/AS01 B platform elicits a more sustained increase in cTfh-phenotype cells PBMCs from days 0, 7, 14, and 63 were stained ex vivo and analyzed using the gating strategies shown in Figures S1-S3 . (A and B) Increases at day 63 in activated CD38 + Ki67 + cells within total CD8 + and CD4 + T cells (A) or Th1 (CXCR3 + CCR6 - ), Th2 (CXCR3 - CCR6 - ), and Th17 (CXCR3 - CCR6 + ) CD4 + T cell subsets (B) were compared between platforms following subtraction of day 0 CD38 + Ki67 + frequencies in paired samples. (C-E) Frequencies of total cTfh cells defined as CXCR5 + (C) or CXCR5 + PD1 + (D) cells within the CD45RA - CD4 + T cell population were compared between platforms and the frequency of cTfr cells within total cTfh cells (defined as the CD25 + Foxp3 + subset) (E). All of the available samples are plotted (ChAd63-MVA/protein/AS01 B ): day 0, n = 15/54; day 7, n = 15/24; day 14, n = 15/54; day 63, n = 12/20. For intra-trial comparisons (E), only vaccinees with all 4 time points were analyzed: ChAd63-MVA, n = 12, protein/AS01 B , n = 17. Comparisons were performed with Mann-Whitney tests (between trials) or Friedman tests with Dunn's correction for multiple comparisons (within trials comparing day 0 to post-vaccination time points). *p < 0.5, **p < 0.01, and ***p < 0.001. In all of the panels, each point represents a vaccinee.
- Conjugate
- Green dye

- Submitted by
- Invitrogen Antibodies (provider)
- Main image
- Experimental details
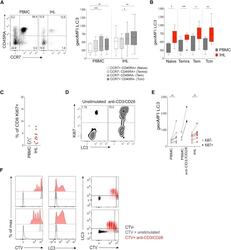
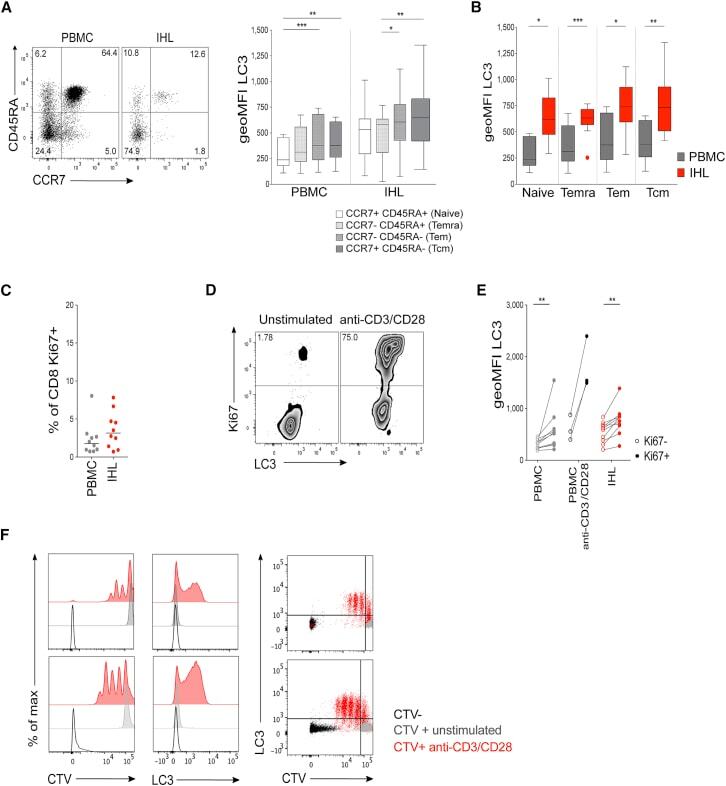
- Figure 2 High Autophagy Level of Intrahepatic T Cells Is Not a Result of a Difference in Differentiation Status or Recent Proliferation (A) Example plot of CD45RA versus CCR7 staining (CD8 + T cells) from a PBMC or IHL sample and summary data for LC3 staining of CD8 + T cell memory subsets (PBMC, 9; and IHL, 15, biological replicates; box whisker, Tukey). (B) Comparison of LC3 staining of CD8 + T cell memory subsets between paired PBMC and IHL samples (9 biological replicates; box whisker, Tukey; outliers shown as dots). (C) Ex vivo CD8 + T cell Ki67 expression. (D and E) Example plots (CD8 + T cells, PBMC) (D) and summary data for LC3 staining on Ki67 - and Ki67 + CD8 + T cells (E) in PBMCs and IHLs ex vivo (10 biological replicates) or after anti-CD3/CD28 stimulation (overnight, 0.5 mug/mL each; three biological replicates) in PBMCs. (F) Histograms showing the dilution of CellTrace Violet (CTV), LC3 staining, and co-staining of LC3 and CTV on CD8 + T cells after 5 days of stimulation with anti-CD3/CD28 (red), compared with that without stimulation (gray) or without CTV staining (black; two representative biological replicates of five, PBMCs). Cells were treated with bafA1 (A-F). Friedman test (ANOVA) with Dunn's post hoc test for pairwise multiple comparisons (A and B). Mann-Whitney t test (C and E). * p < 0.05, ** p < 0.005, *** p < 0.001.
- Conjugate
- Green dye
- Submitted by
- Invitrogen Antibodies (provider)
- Main image

- Experimental details
- Figure 4 Streptomyces Levis ABRIINW111 can alter the apoptosis and proliferation of colon cancer cells. SW480 was treated with indicated concentrations of metabolites for 48 h and was evaluated by flow cytometry (FACS) for Caspase3 and Ki-67 expression. (a) FACS profile of Caspase 3 expression: Control cells (a) 100 ng ml -1 (b) 500 ng ml -1 (c) 1000 ng ml -1 (d).(b) Mean (SD) proportion of Caspase 3 expression with an indicated concentration of metabolites. (c) FACS profile of Ki67 expression: Control cells (a) 100 ng ml -1 (b) 500 ng ml -1 (c) 1000 ng ml -1 (d). (d) Mean (SD) proportion of Ki67 expression with the indicated concentrations of metabolites. Values are demonstrated as mean +- SD from 4 independent experiments (P_Value
- Conjugate
- Green dye
