Explore
 Validate
 Learn
Learn Immunocytochemistry
 Immunohistochemistry
Antibody data
- Antibody Data
- Antigen structure
- References [59]
- Comments [0]
- Validations
- Immunocytochemistry [1]
- Other assay [39]
Submit
Validation data
Reference
Comment
Report error
- Product number
- PA5-19462 - Provider product page

- Provider
- Invitrogen Antibodies
- Product name
- Ki-67 Polyclonal Antibody
- Antibody type
- Polyclonal
- Antigen
- Synthetic peptide
- Description
- Heat-mediated antigen retrieval is recommended prior to tissue staining. Recommended positive controls: ICC/IF - Wildtype HAP1 cells, SK-N-SH cells, HeLa cells, MEF1 cells IHC (P) - Mouse and human spleen tissue, human skin carcinoma tissue, human colon tissue, mouse tumor tissue, human skin tissue
- Reactivity
- Human, Mouse, Rabbit
- Host
- Rabbit
- Isotype
- IgG
- Vial size
- 100 µg
- Concentration
- 0.9 mg/mL
- Storage
- Store at 4°C short term. For long term storage, store at -20°C, avoiding freeze/thaw cycles.
Submitted references NDRG2 inhibits pyruvate carboxylase-mediated anaplerosis and combines with glutamine blockade to inhibit the proliferation of glioma cells.
Medical Grade Honey as a Promising Treatment to Improve Ovarian Tissue Transplantation.
An essential function for autocrine hedgehog signaling in epithelial proliferation and differentiation in the trachea.
Brown-fat-mediated tumour suppression by cold-altered global metabolism.
Psychosocial Stress and Age Influence Depression and Anxiety-Related Behavior, Drive Tumor Inflammatory Cytokines and Accelerate Prostate Cancer Growth in Mice.
Dynamic Regulation of GH-IGF1 Signaling in Injury and Recovery in Hyperoxia-Induced Neonatal Lung Injury.
The challenge of ovarian tissue culture: 2D versus 3D culture.
KDM6A-ARHGDIB axis blocks metastasis of bladder cancer by inhibiting Rac1.
Cancer-specific loss of TERT activation sensitizes glioblastoma to DNA damage.
Mutual dependency between lncRNA LETN and protein NPM1 in controlling the nucleolar structure and functions sustaining cell proliferation.
Translation of Tudor-SN, a novel terminal oligo-pyrimidine (TOP) mRNA, is regulated by the mTORC1 pathway in cardiomyocytes.
Canonical NF-κB signaling maintains corneal epithelial integrity and prevents corneal aging via retinoic acid.
miR-17-3p promotes the proliferation of multiple myeloma cells by downregulating P21 expression through LMLN inhibition.
Simultaneous detection of multiple mRNAs and proteins in bovine IVD cells and tissue with single cell resolution.
Bioengineered Skeletal Muscle as a Model of Muscle Aging and Regeneration.
LncRNA MNX1-AS1 Contributes to Laryngeal Squamous Cell Carcinoma Growth and Migration by Regulating mir-744-5p/bcl9/β-Catenin Axis.
Myocyte Enhancer Factor 2C as a New Player in Human Breast Cancer Brain Metastases.
Differential Proliferation and Maturation of Subcortical Astrocytes During Postnatal Development.
Maternal arginine supplementation enhances thermogenesis in the newborn lamb.
Plasminogen is a master regulator and a potential drug candidate for the healing of radiation wounds.
RAGE impairs murine diabetic atherosclerosis regression and implicates IRF7 in macrophage inflammation and cholesterol metabolism.
Therapeutic paradigm of dual targeting VEGF and PDGF for effectively treating FGF-2 off-target tumors.
Retinoic Acid Is Required for Oligodendrocyte Precursor Cell Production and Differentiation in the Postnatal Mouse Corpus Callosum.
NCAM regulates temporal specification of neural progenitor cells via profilin2 during corticogenesis.
β3-Adrenoreceptor Blockade Induces Stem Cells Differentiation in Melanoma Microenvironment.
Mesenchymal stem cell-derived exosomes as a nanotherapeutic agent for amelioration of inflammation-induced astrocyte alterations in mice.
Primary infection by Pneumocystis induces Notch-independent Clara cell mucin production in rat distal airways.
Control of Germinal Center Localization and Lineage Stability of Follicular Regulatory T Cells by the Blimp1 Transcription Factor.
Transition to the ovulatory season in mares: An investigation of antral follicle receptor gene expression in vivo.
Stable Adult Hippocampal Neurogenesis in Cannabinoid Receptor CB2 Deficient Mice.
FABP5 regulates the proliferation of clear cell renal cell carcinoma cells via the PI3K/AKT signaling pathway.
Functional peroxisomes are required for β-cell integrity in mice.
Host-associated niche metabolism controls enteric infection through fine-tuning the regulation of type 3 secretion.
Periostin blockade overcomes chemoresistance via restricting the expansion of mesenchymal tumor subpopulations in breast cancer.
Pericyte ALK5/TIMP3 Axis Contributes to Endothelial Morphogenesis in the Developing Brain.
Losmapimod Overcomes Gefitinib Resistance in Non-small Cell Lung Cancer by Preventing Tetraploidization.
Reduced levels of methyltransferase DNMT2 sensitize human fibroblasts to oxidative stress and DNA damage that is accompanied by changes in proliferation-related miRNA expression.
Novel role of NPY in neuroimmune interaction and lung growth after intrauterine growth restriction.
Personal samplers of bioavailable pesticides integrated with a hair follicle assay of DNA damage to assess environmental exposures and their associated risks in children.
GD1a Overcomes Inhibition of Myelination by Fibronectin via Activation of Protein Kinase A: Implications for Multiple Sclerosis.
Autonomous and non-autonomous roles for ephrin-B in interneuron migration.
Multifunctional (3-in-1) cancer theranostics applications of hydroxyquinoline-appended polyfluorene nanoparticles.
Zika Virus Infects Intermediate Progenitor Cells and Post-mitotic Committed Neurons in Human Fetal Brain Tissues.
Caspr Controls the Temporal Specification of Neural Progenitor Cells through Notch Signaling in the Developing Mouse Cerebral Cortex.
Initiation of acute graft-versus-host disease by angiogenesis.
AKT1E¹⁷K Is Oncogenic in Mouse Lung and Cooperates with Chemical Carcinogens in Inducing Lung Cancer.
High fat diet increases melanoma cell growth in the bone marrow by inducing osteopontin and interleukin 6.
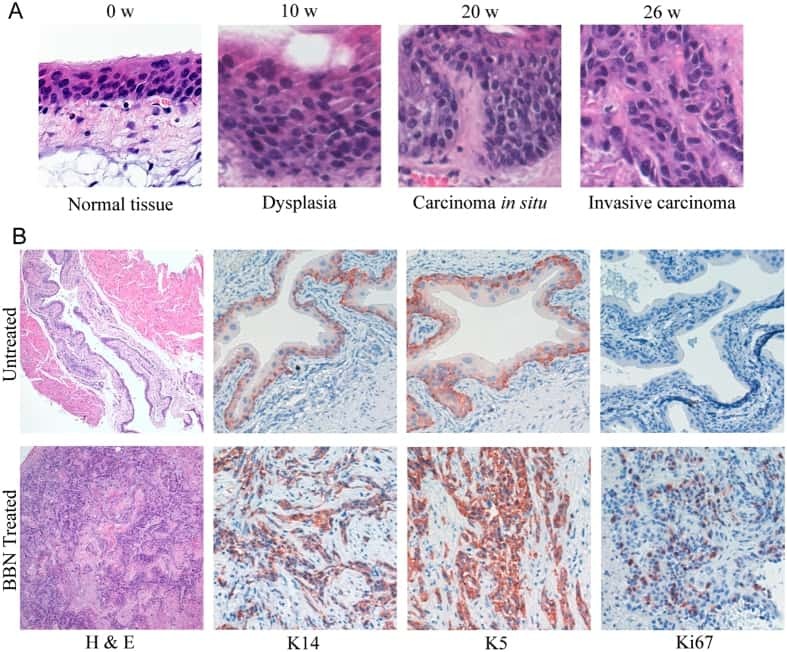
Conditional ablation of TGF-β signaling inhibits tumor progression and invasion in an induced mouse bladder cancer model.
Inhibition of Pediatric Glioblastoma Tumor Growth by the Anti-Cancer Agent OKN-007 in Orthotopic Mouse Xenografts.
Amiodarone as an autophagy promoter reduces liver injury and enhances liver regeneration and survival in mice after partial hepatectomy.
Molecular targeting of protein arginine deiminases to suppress colitis and prevent colon cancer.
Novel In Vivo model for combinatorial fluorescence labeling in mouse prostate.
Genetic disruption of Smad7 impairs skeletal muscle growth and regeneration.
OKN-007 decreases tumor necrosis and tumor cell proliferation and increases apoptosis in a preclinical F98 rat glioma model.
Regulation of YAP by mTOR and autophagy reveals a therapeutic target of tuberous sclerosis complex.
Darpp-32 and t-Darpp are differentially expressed in normal and malignant mouse mammary tissue.
Development and application of specific cytokine assays in tissue samples from a bottlenose dolphin with hyperinsulinemia.
Functional and mechanistic exploration of an adult neurogenesis-promoting small molecule.
β-catenin/cyclin D1 mediated development of suture mesenchyme in calvarial morphogenesis.
Wang J, Sun X, Wang J, Zhang K, Yuan Y, Guo Y, Yao L, Li X, Shen L
American journal of cancer research 2022;12(8):3729-3744
American journal of cancer research 2022;12(8):3729-3744
Medical Grade Honey as a Promising Treatment to Improve Ovarian Tissue Transplantation.
Azevedo AR, Pais AS, Almeida-Santos T, Pires VMR, Pessa P, Marques CC, Nolasco S, Castelo-Branco P, Prates JAM, Lopes-da-Costa L, Laranjo M, Botelho MF, Pereira RMLN, Pimenta JMBGA
Bioengineering (Basel, Switzerland) 2022 Jul 30;9(8)
Bioengineering (Basel, Switzerland) 2022 Jul 30;9(8)
An essential function for autocrine hedgehog signaling in epithelial proliferation and differentiation in the trachea.
Yin W, Liontos A, Koepke J, Ghoul M, Mazzocchi L, Liu X, Lu C, Wu H, Fysikopoulos A, Sountoulidis A, Seeger W, Ruppert C, Günther A, Stainier DYR, Samakovlis C
Development (Cambridge, England) 2022 Feb 1;149(3)
Development (Cambridge, England) 2022 Feb 1;149(3)
Brown-fat-mediated tumour suppression by cold-altered global metabolism.
Seki T, Yang Y, Sun X, Lim S, Xie S, Guo Z, Xiong W, Kuroda M, Sakaue H, Hosaka K, Jing X, Yoshihara M, Qu L, Li X, Chen Y, Cao Y
Nature 2022 Aug;608(7922):421-428
Nature 2022 Aug;608(7922):421-428
Psychosocial Stress and Age Influence Depression and Anxiety-Related Behavior, Drive Tumor Inflammatory Cytokines and Accelerate Prostate Cancer Growth in Mice.
Bellinger DL, Dulcich MS, Molinaro C, Gifford P, Lorton D, Gridley DS, Hartman RE
Frontiers in oncology 2021;11:703848
Frontiers in oncology 2021;11:703848
Dynamic Regulation of GH-IGF1 Signaling in Injury and Recovery in Hyperoxia-Induced Neonatal Lung Injury.
Vohlen C, Mohr J, Fomenko A, Kuiper-Makris C, Grzembke T, Aydogmus R, Wilke R, Hirani D, Dötsch J, Alejandre Alcazar MA
Cells 2021 Oct 29;10(11)
Cells 2021 Oct 29;10(11)
The challenge of ovarian tissue culture: 2D versus 3D culture.
Pais AS, Reis S, Laranjo M, Caramelo F, Silva F, Botelho MF, Almeida-Santos T
Journal of ovarian research 2021 Nov 1;14(1):147
Journal of ovarian research 2021 Nov 1;14(1):147
KDM6A-ARHGDIB axis blocks metastasis of bladder cancer by inhibiting Rac1.
Liu L, Cui J, Zhao Y, Liu X, Chen L, Xia Y, Wang Y, Chen S, Sun S, Shi B, Zou Y
Molecular cancer 2021 May 18;20(1):77
Molecular cancer 2021 May 18;20(1):77
Cancer-specific loss of TERT activation sensitizes glioblastoma to DNA damage.
Amen AM, Fellmann C, Soczek KM, Ren SM, Lew RJ, Knott GJ, Park JE, McKinney AM, Mancini A, Doudna JA, Costello JF
Proceedings of the National Academy of Sciences of the United States of America 2021 Mar 30;118(13)
Proceedings of the National Academy of Sciences of the United States of America 2021 Mar 30;118(13)
Mutual dependency between lncRNA LETN and protein NPM1 in controlling the nucleolar structure and functions sustaining cell proliferation.
Wang X, Hu X, Song W, Xu H, Xiao Z, Huang R, Bai Q, Zhang F, Chen Y, Liu Y, Fang J, Li X, Shen Q, Zhao H, Yang X
Cell research 2021 Jun;31(6):664-683
Cell research 2021 Jun;31(6):664-683
Translation of Tudor-SN, a novel terminal oligo-pyrimidine (TOP) mRNA, is regulated by the mTORC1 pathway in cardiomyocytes.
Gan S, Su C, Ma J, Liu M, Cui X, Xin L, Ren Y, Gao X, Ge L, Wei M, Yang J
RNA biology 2021 Jun;18(6):900-913
RNA biology 2021 Jun;18(6):900-913
Canonical NF-κB signaling maintains corneal epithelial integrity and prevents corneal aging via retinoic acid.
Yu Q, Biswas S, Ma G, Zhao P, Li B, Li J
eLife 2021 Jun 4;10
eLife 2021 Jun 4;10
miR-17-3p promotes the proliferation of multiple myeloma cells by downregulating P21 expression through LMLN inhibition.
Xiang P, Yeung YT, Wang J, Wu Q, Du R, Huang C, Jia X, Gao Y, Zhi Y, Guo F, Wei H, Zhang D, Liu Y, Liu L, Liang L, Wang J, Song Y, Liu K, Fang B
International journal of cancer 2021 Jun 15;148(12):3071-3085
International journal of cancer 2021 Jun 15;148(12):3071-3085
Simultaneous detection of multiple mRNAs and proteins in bovine IVD cells and tissue with single cell resolution.
Li K, Varden L, Henderson A, Lufkin T, Kraus P
Biotechnology letters 2021 Jan;43(1):13-24
Biotechnology letters 2021 Jan;43(1):13-24
Bioengineered Skeletal Muscle as a Model of Muscle Aging and Regeneration.
Rajabian N, Shahini A, Asmani M, Vydiam K, Choudhury D, Nguyen T, Ikhapoh I, Zhao R, Lei P, Andreadis ST
Tissue engineering. Part A 2021 Jan;27(1-2):74-86
Tissue engineering. Part A 2021 Jan;27(1-2):74-86
LncRNA MNX1-AS1 Contributes to Laryngeal Squamous Cell Carcinoma Growth and Migration by Regulating mir-744-5p/bcl9/β-Catenin Axis.
Ma B, Ren G, Xu J, Yin C, Shi Y
Cell transplantation 2021 Jan-Dec;30:9636897211005682
Cell transplantation 2021 Jan-Dec;30:9636897211005682
Myocyte Enhancer Factor 2C as a New Player in Human Breast Cancer Brain Metastases.
Galego S, Kauppila LA, Malhó R, Pimentel J, Brito MA
Cells 2021 Feb 12;10(2)
Cells 2021 Feb 12;10(2)
Differential Proliferation and Maturation of Subcortical Astrocytes During Postnatal Development.
Shoneye T, Orrego AT, Jarvis R, Men Y, Chiang MSR, Yang Y
Frontiers in neuroscience 2020;14:435
Frontiers in neuroscience 2020;14:435
Maternal arginine supplementation enhances thermogenesis in the newborn lamb.
McKnight SM, Simmons RM, Wu G, Satterfield MC
Journal of animal science 2020 May 1;98(5)
Journal of animal science 2020 May 1;98(5)
Plasminogen is a master regulator and a potential drug candidate for the healing of radiation wounds.
Fallah M, Viklund E, Bäckman A, Brodén J, Lundskog B, Johansson M, Blomquist M, Wilczynska M, Ny T
Cell death & disease 2020 Mar 23;11(3):201
Cell death & disease 2020 Mar 23;11(3):201
RAGE impairs murine diabetic atherosclerosis regression and implicates IRF7 in macrophage inflammation and cholesterol metabolism.
Senatus L, López-Díez R, Egaña-Gorroño L, Liu J, Hu J, Daffu G, Li Q, Rahman K, Vengrenyuk Y, Barrett TJ, Dewan MZ, Guo L, Fuller D, Finn AV, Virmani R, Li H, Friedman RA, Fisher EA, Ramasamy R, Schmidt AM
JCI insight 2020 Jul 9;5(13)
JCI insight 2020 Jul 9;5(13)
Therapeutic paradigm of dual targeting VEGF and PDGF for effectively treating FGF-2 off-target tumors.
Hosaka K, Yang Y, Seki T, Du Q, Jing X, He X, Wu J, Zhang Y, Morikawa H, Nakamura M, Scherzer M, Sun X, Xu Y, Cheng T, Li X, Liu X, Li Q, Liu Y, Hong A, Chen Y, Cao Y
Nature communications 2020 Jul 24;11(1):3704
Nature communications 2020 Jul 24;11(1):3704
Retinoic Acid Is Required for Oligodendrocyte Precursor Cell Production and Differentiation in the Postnatal Mouse Corpus Callosum.
Morrison VE, Smith VN, Huang JK
eNeuro 2020 Jan Feb;7(1)
eNeuro 2020 Jan Feb;7(1)
NCAM regulates temporal specification of neural progenitor cells via profilin2 during corticogenesis.
Huang R, Yuan DJ, Li S, Liang XS, Gao Y, Lan XY, Qin HM, Ma YF, Xu GY, Schachner M, Sytnyk V, Boltze J, Ma QH, Li S
The Journal of cell biology 2020 Jan 6;219(1)
The Journal of cell biology 2020 Jan 6;219(1)
β3-Adrenoreceptor Blockade Induces Stem Cells Differentiation in Melanoma Microenvironment.
Calvani M, Bruno G, Dabraio A, Subbiani A, Bianchini F, Fontani F, Casazza G, Vignoli M, De Logu F, Frenos S, Filippi L, Favre C
International journal of molecular sciences 2020 Feb 20;21(4)
International journal of molecular sciences 2020 Feb 20;21(4)
Mesenchymal stem cell-derived exosomes as a nanotherapeutic agent for amelioration of inflammation-induced astrocyte alterations in mice.
Xian P, Hei Y, Wang R, Wang T, Yang J, Li J, Di Z, Liu Z, Baskys A, Liu W, Wu S, Long Q
Theranostics 2019;9(20):5956-5975
Theranostics 2019;9(20):5956-5975
Primary infection by Pneumocystis induces Notch-independent Clara cell mucin production in rat distal airways.
Méndez A, Rojas DA, Ponce CA, Bustamante R, Beltrán CJ, Toledo J, García-Angulo VA, Henriquez M, Vargas SL
PloS one 2019;14(6):e0217684
PloS one 2019;14(6):e0217684
Control of Germinal Center Localization and Lineage Stability of Follicular Regulatory T Cells by the Blimp1 Transcription Factor.
Shen E, Rabe H, Luo L, Wang L, Wang Q, Yin J, Yang X, Liu W, Sido JM, Nakagawa H, Ao L, Kim HJ, Cantor H, Leavenworth JW
Cell reports 2019 Nov 12;29(7):1848-1861.e6
Cell reports 2019 Nov 12;29(7):1848-1861.e6
Transition to the ovulatory season in mares: An investigation of antral follicle receptor gene expression in vivo.
Ishak GMA, Dutra GA, Gastal GDA, Gastal MO, Feugang JM, Gastal EL
Molecular reproduction and development 2019 Dec;86(12):1832-1845
Molecular reproduction and development 2019 Dec;86(12):1832-1845
Stable Adult Hippocampal Neurogenesis in Cannabinoid Receptor CB2 Deficient Mice.
Mensching L, Djogo N, Keller C, Rading S, Karsak M
International journal of molecular sciences 2019 Aug 1;20(15)
International journal of molecular sciences 2019 Aug 1;20(15)
FABP5 regulates the proliferation of clear cell renal cell carcinoma cells via the PI3K/AKT signaling pathway.
Lv Q, Wang G, Zhang Y, Han X, Li H, Le W, Zhang M, Ma C, Wang P, Ding Q
International journal of oncology 2019 Apr;54(4):1221-1232
International journal of oncology 2019 Apr;54(4):1221-1232
Functional peroxisomes are required for β-cell integrity in mice.
Baboota RK, Shinde AB, Lemaire K, Fransen M, Vinckier S, Van Veldhoven PP, Schuit F, Baes M
Molecular metabolism 2019 Apr;22:71-83
Molecular metabolism 2019 Apr;22:71-83
Host-associated niche metabolism controls enteric infection through fine-tuning the regulation of type 3 secretion.
Connolly JPR, Slater SL, O'Boyle N, Goldstone RJ, Crepin VF, Ruano-Gallego D, Herzyk P, Smith DGE, Douce GR, Frankel G, Roe AJ
Nature communications 2018 Oct 10;9(1):4187
Nature communications 2018 Oct 10;9(1):4187
Periostin blockade overcomes chemoresistance via restricting the expansion of mesenchymal tumor subpopulations in breast cancer.
Nakazawa Y, Taniyama Y, Sanada F, Morishita R, Nakamori S, Morimoto K, Yeung KT, Yang J
Scientific reports 2018 Mar 5;8(1):4013
Scientific reports 2018 Mar 5;8(1):4013
Pericyte ALK5/TIMP3 Axis Contributes to Endothelial Morphogenesis in the Developing Brain.
Dave JM, Mirabella T, Weatherbee SD, Greif DM
Developmental cell 2018 Mar 26;44(6):665-678.e6
Developmental cell 2018 Mar 26;44(6):665-678.e6
Losmapimod Overcomes Gefitinib Resistance in Non-small Cell Lung Cancer by Preventing Tetraploidization.
Yeung YT, Yin S, Lu B, Fan S, Yang R, Bai R, Zhang C, Bode AM, Liu K, Dong Z
EBioMedicine 2018 Feb;28:51-61
EBioMedicine 2018 Feb;28:51-61
Reduced levels of methyltransferase DNMT2 sensitize human fibroblasts to oxidative stress and DNA damage that is accompanied by changes in proliferation-related miRNA expression.
Lewinska A, Adamczyk-Grochala J, Kwasniewicz E, Deregowska A, Semik E, Zabek T, Wnuk M
Redox biology 2018 Apr;14:20-34
Redox biology 2018 Apr;14:20-34
Novel role of NPY in neuroimmune interaction and lung growth after intrauterine growth restriction.
Thangaratnarajah C, Dinger K, Vohlen C, Klaudt C, Nawabi J, Lopez Garcia E, Kwapiszewska G, Dobner J, Nüsken KD, van Koningsbruggen-Rietschel S, von Hörsten S, Dötsch J, Alejandre Alcázar MA
American journal of physiology. Lung cellular and molecular physiology 2017 Sep 1;313(3):L491-L506
American journal of physiology. Lung cellular and molecular physiology 2017 Sep 1;313(3):L491-L506
Personal samplers of bioavailable pesticides integrated with a hair follicle assay of DNA damage to assess environmental exposures and their associated risks in children.
Vidi PA, Anderson KA, Chen H, Anderson R, Salvador-Moreno N, Mora DC, Poutasse C, Laurienti PJ, Daniel SS, Arcury TA
Mutation research. Genetic toxicology and environmental mutagenesis 2017 Oct;822:27-33
Mutation research. Genetic toxicology and environmental mutagenesis 2017 Oct;822:27-33
GD1a Overcomes Inhibition of Myelination by Fibronectin via Activation of Protein Kinase A: Implications for Multiple Sclerosis.
Qin J, Sikkema AH, van der Bij K, de Jonge JC, Klappe K, Nies V, Jonker JW, Kok JW, Hoekstra D, Baron W
The Journal of neuroscience : the official journal of the Society for Neuroscience 2017 Oct 11;37(41):9925-9938
The Journal of neuroscience : the official journal of the Society for Neuroscience 2017 Oct 11;37(41):9925-9938
Autonomous and non-autonomous roles for ephrin-B in interneuron migration.
Talebian A, Britton R, Ammanuel S, Bepari A, Sprouse F, Birnbaum SG, Szabó G, Tamamaki N, Gibson J, Henkemeyer M
Developmental biology 2017 Nov 15;431(2):179-193
Developmental biology 2017 Nov 15;431(2):179-193
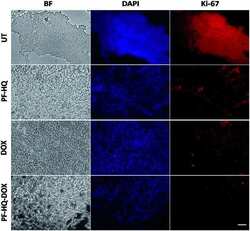
Multifunctional (3-in-1) cancer theranostics applications of hydroxyquinoline-appended polyfluorene nanoparticles.
Chowdhury SR, Mukherjee S, Das S, Patra CR, Iyer PK
Chemical science 2017 Nov 1;8(11):7566-7575
Chemical science 2017 Nov 1;8(11):7566-7575
Zika Virus Infects Intermediate Progenitor Cells and Post-mitotic Committed Neurons in Human Fetal Brain Tissues.
Lin MY, Wang YL, Wu WL, Wolseley V, Tsai MT, Radic V, Thornton ME, Grubbs BH, Chow RH, Huang IC
Scientific reports 2017 Nov 1;7(1):14883
Scientific reports 2017 Nov 1;7(1):14883
Caspr Controls the Temporal Specification of Neural Progenitor Cells through Notch Signaling in the Developing Mouse Cerebral Cortex.
Wu ZQ, Li D, Huang Y, Chen XP, Huang W, Liu CF, Zhao HQ, Xu RX, Cheng M, Schachner M, Ma QH
Cerebral cortex (New York, N.Y. : 1991) 2017 Feb 1;27(2):1369-1385
Cerebral cortex (New York, N.Y. : 1991) 2017 Feb 1;27(2):1369-1385
Initiation of acute graft-versus-host disease by angiogenesis.
Riesner K, Shi Y, Jacobi A, Kräter M, Kalupa M, McGearey A, Mertlitz S, Cordes S, Schrezenmeier JF, Mengwasser J, Westphal S, Perez-Hernandez D, Schmitt C, Dittmar G, Guck J, Penack O
Blood 2017 Apr 6;129(14):2021-2032
Blood 2017 Apr 6;129(14):2021-2032
AKT1E¹⁷K Is Oncogenic in Mouse Lung and Cooperates with Chemical Carcinogens in Inducing Lung Cancer.
Malanga D, Belmonte S, Colelli F, Scarfò M, De Marco C, Oliveira DM, Mirante T, Camastra C, Gagliardi M, Rizzuto A, Mignogna C, Paciello O, Papparella S, Fagman H, Viglietto G
PloS one 2016;11(2):e0147334
PloS one 2016;11(2):e0147334
High fat diet increases melanoma cell growth in the bone marrow by inducing osteopontin and interleukin 6.
Chen GL, Luo Y, Eriksson D, Meng X, Qian C, Bäuerle T, Chen XX, Schett G, Bozec A
Oncotarget 2016 May 3;7(18):26653-69
Oncotarget 2016 May 3;7(18):26653-69
Conditional ablation of TGF-β signaling inhibits tumor progression and invasion in an induced mouse bladder cancer model.
Liang Y, Zhu F, Zhang H, Chen D, Zhang X, Gao Q, Li Y
Scientific reports 2016 Jul 5;6:29479
Scientific reports 2016 Jul 5;6:29479
Inhibition of Pediatric Glioblastoma Tumor Growth by the Anti-Cancer Agent OKN-007 in Orthotopic Mouse Xenografts.
Coutinho de Souza P, Mallory S, Smith N, Saunders D, Li XN, McNall-Knapp RY, Fung KM, Towner RA
PloS one 2015;10(8):e0134276
PloS one 2015;10(8):e0134276
Amiodarone as an autophagy promoter reduces liver injury and enhances liver regeneration and survival in mice after partial hepatectomy.
Lin CW, Chen YS, Lin CC, Chen YJ, Lo GH, Lee PH, Kuo PL, Dai CY, Huang JF, Chung WL, Yu ML
Scientific reports 2015 Oct 30;5:15807
Scientific reports 2015 Oct 30;5:15807
Molecular targeting of protein arginine deiminases to suppress colitis and prevent colon cancer.
Witalison EE, Cui X, Causey CP, Thompson PR, Hofseth LJ
Oncotarget 2015 Nov 3;6(34):36053-62
Oncotarget 2015 Nov 3;6(34):36053-62
Novel In Vivo model for combinatorial fluorescence labeling in mouse prostate.
Fang X, Gyabaah K, Nickkholgh B, Cline JM, Balaji KC
The Prostate 2015 Jun 15;75(9):988-1000
The Prostate 2015 Jun 15;75(9):988-1000
Genetic disruption of Smad7 impairs skeletal muscle growth and regeneration.
Cohen TV, Kollias HD, Liu N, Ward CW, Wagner KR
The Journal of physiology 2015 Jun 1;593(11):2479-97
The Journal of physiology 2015 Jun 1;593(11):2479-97
OKN-007 decreases tumor necrosis and tumor cell proliferation and increases apoptosis in a preclinical F98 rat glioma model.
de Souza PC, Balasubramanian K, Njoku C, Smith N, Gillespie DL, Schwager A, Abdullah O, Ritchey JW, Fung KM, Saunders D, Jensen RL, Towner RA
Journal of magnetic resonance imaging : JMRI 2015 Dec;42(6):1582-91
Journal of magnetic resonance imaging : JMRI 2015 Dec;42(6):1582-91
Regulation of YAP by mTOR and autophagy reveals a therapeutic target of tuberous sclerosis complex.
Liang N, Zhang C, Dill P, Panasyuk G, Pion D, Koka V, Gallazzini M, Olson EN, Lam H, Henske EP, Dong Z, Apte U, Pallet N, Johnson RL, Terzi F, Kwiatkowski DJ, Scoazec JY, Martignoni G, Pende M
The Journal of experimental medicine 2014 Oct 20;211(11):2249-63
The Journal of experimental medicine 2014 Oct 20;211(11):2249-63
Darpp-32 and t-Darpp are differentially expressed in normal and malignant mouse mammary tissue.
Christenson JL, Kane SE
Molecular cancer 2014 Aug 15;13:192
Molecular cancer 2014 Aug 15;13:192
Development and application of specific cytokine assays in tissue samples from a bottlenose dolphin with hyperinsulinemia.
Eberle KC, Waters TE, Jensen ED, Venn-Watson SK, Sacco RE
Frontiers in endocrinology 2013;4:134
Frontiers in endocrinology 2013;4:134
Functional and mechanistic exploration of an adult neurogenesis-promoting small molecule.
Petrik D, Jiang Y, Birnbaum SG, Powell CM, Kim MS, Hsieh J, Eisch AJ
FASEB journal : official publication of the Federation of American Societies for Experimental Biology 2012 Aug;26(8):3148-62
FASEB journal : official publication of the Federation of American Societies for Experimental Biology 2012 Aug;26(8):3148-62
β-catenin/cyclin D1 mediated development of suture mesenchyme in calvarial morphogenesis.
Mirando AJ, Maruyama T, Fu J, Yu HM, Hsu W
BMC developmental biology 2010 Nov 26;10:116
BMC developmental biology 2010 Nov 26;10:116
No comments: Submit comment
Supportive validation
- Submitted by
- Invitrogen Antibodies (provider)
- Main image

- Experimental details
- Immunofluorescence analysis of Ki67 was performed using 70% confluent log phase HeLa cells serum starved for 36 Hrs followed by serum release for 6 Hrs. The cells were fixed with 4% Paraformaldehyde for 10 minutes, permeabilized with 0.1% Triton™ X-100 for 10 minutes, and blocked with 2% BSA for 10 minutes at room temperature. The cells were labeled with Ki-67 Polyclonal Antibody (Product # PA5-19462) at 1 µg/mL in 0.1% BSA, incubated at 4 degree celsius overnight and then labeled with Goat anti-Rabbit IgG (H+L) Superclonal™ Secondary Antibody, Alexa Fluor® 488 conjugate (Product # A27034, 1:2000 dilution) for 45 minutes at room temperature (Panel a: Green). Nuclei (Panel b: Blue) were stained with SlowFade® Gold Antifade Mountant with DAPI (Product # S36938). F-actin (Panel c: Red) was stained with Rhodamine Phalloidin (Product # R415, 1:300). Panel d represents the merged image showing nuclear localization. Panel e represents serum starved cells with reduced signal. Panel f represents control cells with no primary antibody to assess background. The images were captured at 60X magnification.

Supportive validation
- Submitted by
- Invitrogen Antibodies (provider)
- Main image
- Experimental details
- NULL

- Submitted by
- Invitrogen Antibodies (provider)
- Main image

- Experimental details
- NULL

- Submitted by
- Invitrogen Antibodies (provider)
- Main image

- Experimental details
- NULL

- Submitted by
- Invitrogen Antibodies (provider)
- Main image

- Experimental details
- NULL

- Submitted by
- Invitrogen Antibodies (provider)
- Main image

- Experimental details
- NULL
- Submitted by
- Invitrogen Antibodies (provider)
- Main image
- Experimental details
- NULL

- Submitted by
- Invitrogen Antibodies (provider)
- Main image

- Experimental details
- NULL

- Submitted by
- Invitrogen Antibodies (provider)
- Main image

- Experimental details
- NULL

- Submitted by
- Invitrogen Antibodies (provider)
- Main image
- Experimental details
- NULL
- Submitted by
- Invitrogen Antibodies (provider)
- Main image

- Experimental details
- NULL

- Submitted by
- Invitrogen Antibodies (provider)
- Main image

- Experimental details
- NULL

- Submitted by
- Invitrogen Antibodies (provider)
- Main image

- Experimental details
- NULL

- Submitted by
- Invitrogen Antibodies (provider)
- Main image

- Experimental details
- NULL

- Submitted by
- Invitrogen Antibodies (provider)
- Main image
- Experimental details
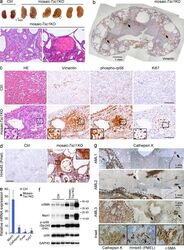
- Figure 2. Mosaic- Tsc1 KO mice develop renal mesenchymal lesions recapitulating PEComas associated with human TSC. Kidneys from ctrl ( n = 3) and mosaic- Tsc1 KO ( n = 3) mice were analyzed at 6 wk of age. (a) Macroscopic photos and representative H&E staining. Arrows indicate hemorrhages. (b-d) Expression of vimentin (b and c), phospho-rpS6, and Ki67 (c) and Hmb45/Pmel (d) was assessed by immunohistochemistry. H&E staining was shown on left in c. Arrows in b indicate vimentin + microhamartomas in mosaic- Tsc1 KO kidneys. For immunohistochemistry analysis, similar stainings were found in three different ctrl/mosaic- Tsc1 KO mice (three sections per mouse). (e) Expression of Mart1, Cathepsin K, Pmel, and Tyrp1 mRNA was assessed by qRT-PCR. Mean +- SEM; n = 3 mice/group; *, P < 0.05. (f) Expression of alpha-SMA, Mart1, p-rpS6, and total rpS6 protein was assessed by Immunoblot. (g) Expression of the indicated proteins in three distinct human angiomyolipoma (AML) samples was assessed by immunohistochemistry. Arrows indicate the microhamartoma. Bar, 100 um unless otherwise indicated. Insets show higher magnification of the lesions indicated with squares.

- Submitted by
- Invitrogen Antibodies (provider)
- Main image

- Experimental details
- Fig. 3 Co-ordinated expression of the non-LEE-encoded effector repertoire in vivo. a Expression dynamics of the NLE repertoire in vivo compared to in vitro growth in DMEM. The line plots illustrate fold-change in expression at each site and time point during infection. A selection of NLEs ( espS, espI nleA , espO, espM3 and espK ) displaying the highest fold changes in expression are labelled and colour coded while remaining NLE genes are illustrated in grey. Gene expression data represents the mean of three replicates in all cases and full expression heatmaps are found in Supplementary Figure 4a . b Venn diagrams illustrating the overlap in NLEs differentially expressed throughout infection ( P

- Submitted by
- Invitrogen Antibodies (provider)
- Main image

- Experimental details
- Figure 3 Dynamic regulation of mesenchymal cell expansion and tumor invasion in residual tumors upon chemotherapy. ( A ) Tumor growth curve following relapse from paclitaxel (PTX) treatment in MCF10DCIS xenografts. Arrows indicate times of drug administration. Tumor volume was measured on the indicated days and presented as mean +- standard error (n = 10). ( B ) Flow cytometry analysis of indicated tumors using CD44 and CD24 antibodies. Samples were prepared from the mixture of 10 tumors. Ratio of CD44 high /CD24 low to CD24 high tumor cells is presented on the plots. ( C ) Immunofluorescence staining of E-Cadherin and human nuclei in tumor. Scale bar, 100 um. ( D ) Quantitation of the epithelial area ratio in tumors (n = 15). E-Cadherin positive area was normalized against the total human nuclei positive area. Bars represent mean, and error bars represent standard deviation. *P < 0.05, ****P < 0.0001, Mann-Whitney's test. ( E ) Immunofluorescence staining of CD44 and Ki67 in tumors. Scale bar, 100 um. ( F ) The number of CD44 high /Ki67 + cancer cells per field were counted (left panel, n = 15), and the ratio of CD44 high /Ki67 + cancer cells against total Ki67 + cells was calculated (right panel, n = 15). Bars represent mean, and error bars represent standard deviation. *** P < 0.001, **** P < 0.0001, Mann-Whitney's test. ( G ) Immunofluorescence staining of E-Cadherin and Ki67 in tumors. Scale bar, 100 um. ( H ) The number of E-Cadherin-/Ki67+ cancer cells per field were c

- Submitted by
- Invitrogen Antibodies (provider)
- Main image

- Experimental details
- Figure 6 Knockdown of periostin inhibited mesenchymal cell proliferation and invasion, but did not affect apoptosis induction immediately after chemotherapy. ( A ) Immunofluorescence staining of CD44 and cleaved caspase-3 in MC10DCIS tumors. Tumors were sampled 1 or 3 days after one dose of PTX treatment. Scale bar, 100 um. ( B ) The number of CD44 high /cleaved Caspase-3 + cancer cells per field were counted (left panel, n = 10), and the ratio of CD44 high /cleaved caspase-3 + cancer cells against total cleaved caspase-3 + cells was calculated (right panel, n = 10). Bars represent mean, and error bars represent standard deviation. ** P < 0.01, *** P < 0.001, **** P < 0.0001, Mann-Whitney's test. ( C ) Immunofluorescence staining of CD44 and Ki67 in MC10DCIS tumors. Tumors were sampled 1 or 3 days after one dose of PTX treatment. Scale bar, 100 um. ( D ) The number of CD44 high /Ki67 + cancer cells per field were counted (left panel, n = 10), and the ratio of CD44 high /Ki67 + cancer cells against total Ki67 + cells was calculated (right panel, n = 10). Bars represent mean, and error bars represent standard deviation. *** P < 0.001, **** P < 0.0001, Mann-Whitney's test. ( E ) Immunofluorescence staining of laminin-5, periostin, E-cadherin and MT1-MMP in tumors. Tumors were sampled 3 days after one dose of PTX treatment. Scale bar, 100 um.

- Submitted by
- Invitrogen Antibodies (provider)
- Main image

- Experimental details
- Figure 7 An antibody targeting cancer-specific periostin variants inhibited mesenchymal cell expansion and tumor invasion after chemotherapy and halted tumor progression. ( A ) Diagram of splicing variants of human and mouse POSTN . Arrows indicate the location of designed primers. ( B ) Quantitative PCR analysis of POSTN splicing variants in tumor with or without PTX treatment. The region over exon 20 and 21 (hPNex20-21) was also amplified. Relative values against human total POSTN expression in vehicle-treated tumor are presented. Relative values are presented as mean +- standard error, * P < 0.02, Student's t test. ( C ) Immunofluorescence staining of periostin variants containing exon 21 in tumor upon PTX treatment and periostin knockdown. Scale bar, 100 um. ( D ) Tumor growth curve in MCF10DCIS xenografts treated with PTX and/or PN21-Ab. Upper arrows indicate times of PTX administration, and lower arrows indicate times of PN21-Ab administration. Tumor volumes were measured on the indicated days and are presented as mean +- standard error (n = 10). ** P < 0.01, Student's t test. ( E ) Flow cytometry analysis of tumors at Day 24 using CD44 and CD24 antibodies. Samples were prepared from a mixture of 10 tumors. Ratio of CD44 high /CD24 low to CD24 high tumor cells is presented on the plots. ( F ) The ratio of CD44 high /Ki67 + cancer cells against total Ki67 + cells was quantified in tumors collected at Day 24 (n = 15). Bars represent mean, and error bars represent standard

- Submitted by
- Invitrogen Antibodies (provider)
- Main image
- Experimental details
- Figure 4 A germinal center, surrounded by a T-cell zone, in the spleen of a dolphin with hyperinsulinemia . Dolphin splenic tissue sections were incubated with primary anti-Ki67, followed by anti-dolphin CD2, and nuclear staining using VECTASHIELD mounting medium with DAPI. Original magnification 20x.

- Submitted by
- Invitrogen Antibodies (provider)
- Main image

- Experimental details
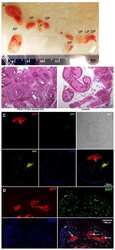
- Figure 6. Verteporfin treatment inhibits proliferation and induces apoptosis of Tsc1 - cells in vivo. Mice were administered i.p. with vehicle or verteporfin at a dose of 100 mg/kg every other day for 10 d before sacrifice. Mice were sacrificed at 6 wk of age. Three independent experiments were performed and mice in different treatments were pooled for analysis. (a) Kidney/body weight ratio of Ctrl and mosaic- Tsc1 KO mice treated with placebo or Verteporfin. n = 3 mice/group. Mean +- SEM; *, P < 0.05, ***, P < 0.001. (b) Representative pictures of hematoxylin and eosin staining of kidney sections from Ctrl and mosaic- Tsc1 KO mice treated with placebo or Verteporfin. Bar, 1 mm. (c) Expression of indicated mRNAs was analyzed by qRT-PCR in kidney samples from Ctrl and mosaic- Tsc1 KO mice treated with placebo or Verteporfin. n = 3 mice/group. Mean +- SEM; *, P < 0.05, **, P < 0.01. (d) Percentage of Ki67 and alphaSMA double-positive cells in alpha-SMA + mesenchymal lesions in the indicated kidneys. Immunofluorescence staining and counting were performed on three sagittal sections from different kidney regions for each mouse. Representative images are shown. Mean +- SEM; n = 3 mice/group; **, P < 0.01; Bar, 100 um. Insets show the lesions indicated with arrows. (e) In situ apoptotic cells were assessed by TUNEL assay on the kidney sections from Ctrl and mosaic- Tsc1 KO mice treated with placebo or verteporfin. The number of TUNEL + cells were counted in ten distinct fields

- Submitted by
- Invitrogen Antibodies (provider)
- Main image

- Experimental details
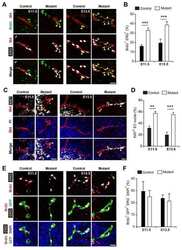
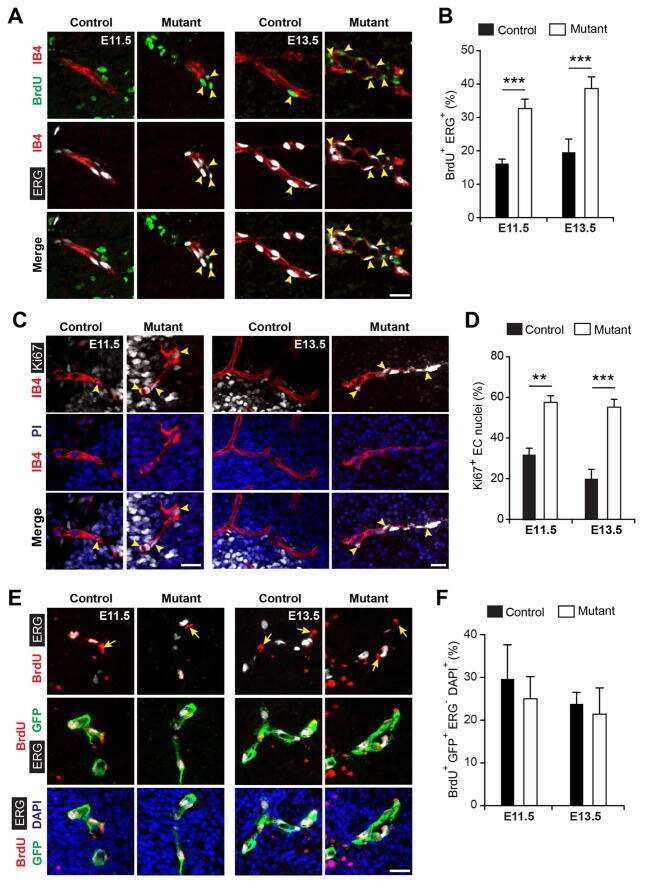
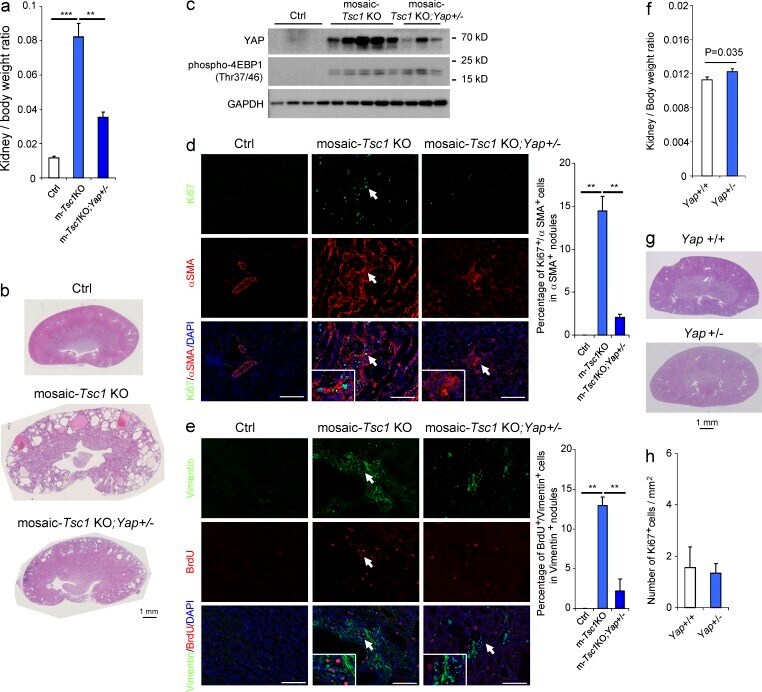
- Figure 7. Heterozygous deletion of Yap compromises the proliferation of renal mesenchymal lesions in mosaic- Tsc1 KO mice. Three independent tamoxifen injection experiments were performed and female mice of indicated genotypes were pooled for analysis. (a) Kidney/body weight ratio of the indicated mice sacrificed at 6 wk of age (Ctrl, n = 4; mosaic- Tsc1 KO, n = 5; mosaic- Tsc1 KO ;Yap +/- , n = 3). (b) Representative pictures of hematoxylin and eosin staining of kidney sections from the indicated mice. (c) Expression of indicated proteins was analyzed by immunoblot in mouse kidney samples from the indicated genotypes. (d) Percentage of Ki67 and alpha-SMA double-positive cells in alpha-SMA + kidney lesions from mice of the indicated genotypes. Immunofluorescence staining and counting were performed on three sagittal sections from different kidney regions for each mouse (Ctrl, n = 4, mosaic- Tsc1 KO, n = 5; mosaic- Tsc1 KO ;Yap +/- , n = 3). Insets show the lesions indicated with arrows. Bars, 100 um. Mean +- SEM, **, P < 0.01. (e) Percentage of BrdU and Vimentin double-positive cells in Vimentin + mesenchymal lesions in the indicated kidneys. BrdU (50 mg/kg) was injected i.p. 24 h before sacrifice. Immunofluorescence staining and counting were performed on three sagittal sections from different kidney regions for each mouse. Representative images are shown (Ctrl, n = 4; mosaic- Tsc1 KO, n = 5; mosaic- Tsc1 KO ;Yap +/- , n = 3; mean +- SEM; **, P < 0.01; Bar, 100 um). Insets s
- Submitted by
- Invitrogen Antibodies (provider)
- Main image
- Experimental details
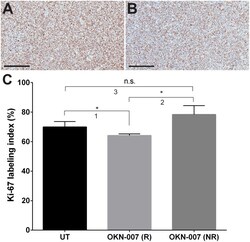
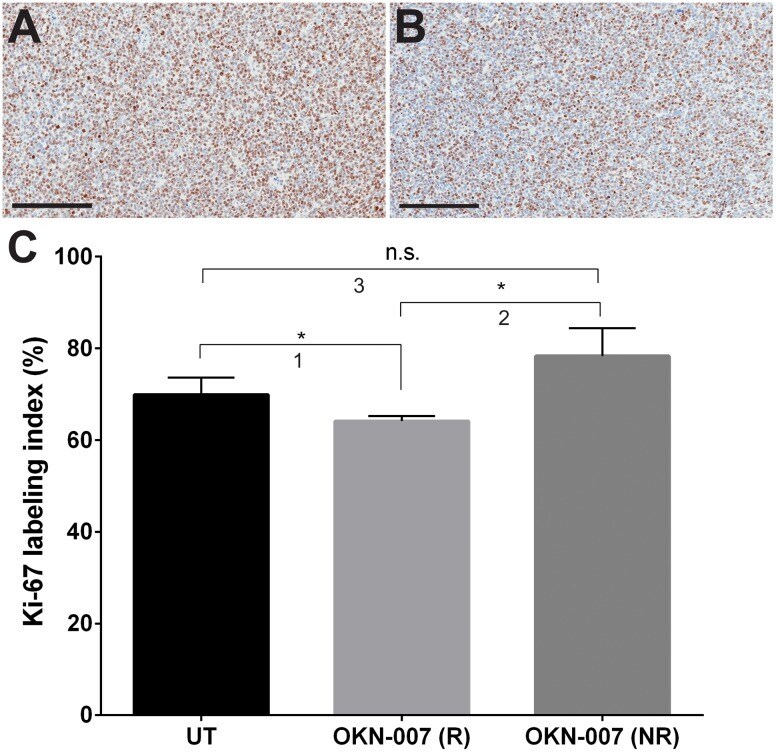
- Fig 7 Effect of OKN-007 on cell proliferation in IC3752 pGBM tumor bearing mice. Immunohistochemistry images of Ki-67 levels in untreated (A) and OKN-007-treated (B) IC3752 pGBM tumors. (C) Ki-67 LI was significantly lower ( p < 0.05) in the OKN-007-R treated group (n = 4) than in the untreated group (n = 6). There was no significant difference between the Ki-67 LI of the OKN-007-NR (n = 2) and the untreated groups. Values are represented as means +- SD. Asterisks indicate statistically significant difference (* p < 0.05). n.s.: not statistically significant. Scale bar = 200 mum. Group comparisons: (1) UT vs. OKN-007 (R); (2) OKN-007 (R) vs. OKN-007 (NR); and (3) UT vs. OKN-007 (NR).
- Submitted by
- Invitrogen Antibodies (provider)
- Main image

- Experimental details
- Figure 4 Cell proliferation proteins (Cyclin D1, Cyclin E1, and Ki67) are downregulated in mice treated with Cl-amidine Colons from 4 mice per group were euthanized at day 35 and processed for IHC analysis. IRS of colons at day 35 stained with A. Cyclin D1, B. Cyclin E1, both known targets of miR-16, and C. Ki-67, a cell proliferation marker. Representative sections of stained colons (400x total magnification) are shown. Significant differences from the AOM + DSS only group are indicated by * ( p < 0.05), ** ( p < 0.01), and *** ( p < 0.005).

- Submitted by
- Invitrogen Antibodies (provider)
- Main image

- Experimental details
- Figure 3 Amiodarone enhanced liver growth and hepatocyte proliferation in the liver regeneration after PHx. Wild-type mice were intraperitoneally injected with vehicle (Veh), amiodarone (AD), or chloroquine (CQ) at 0.5 h before PHx or sham operation and then once per day until 168 h. Liver tissues were harvested at 0-168 h after surgery. Liver-to-body-weight ratios were calculated ( A ). Liver sections at 24 h after the sham operation, PHx with Veh, AD, or CQ were stained with H&E; original magnification, 400X ( B ). Representative immunohistochemical staining of Ki67 is shown ( C ). The percentage of Ki67-positive nuclei in hepatocyte was counted under low-power fields (200 x) in 15 random sections from at least six different mice ( D ). Liver tissues were harvested at 0 h, 12 h, 24 h, or 48 h after surgery, and the tissue extracts were analyzed for PCNA, cyclin A, B, D1, E, p21, TGF-beta1, and beta-actin protein by Western blotting ( E,F ). The values are shown as the mean +- SD in the bar graph and compared by Student's t test. # P < 0.05 versus vehicle-treated PHx. Scale bar, 25 mum in B, 50 mum in C (n = 6).

- Submitted by
- Invitrogen Antibodies (provider)
- Main image

- Experimental details
- Figure 4 Inhibition of autophagy reduced liver growth and hepatocyte proliferation in the early phase of liver regeneration after PHx. Wild-type mice were given control or Atg7-specific siRNA for 48 h before treatment with PHx. Liver tissues were harvested at 24 h after surgery and tissue extracts were analyzed for Atg7, LC3-II, and beta-actin by Western blotting ( A ). The liver-to-body-weight ratios were calculated ( B ). Representative immunohistochemical staining of Ki67 is shown. Scale bar, 50 mum ( C ). The percentage of Ki67-positive nuclei in hepatocytes was counted in low-power field (200X) in 15 random sections from 3 different mice ( D ). Tissue extracts were analyzed for PCNA, cyclin D1, TGF-beta1, and beta-actin by Western blotting ( E ). Immunohistochemical staining of senescence-associated beta-galactosidase (SA-beta-gal) in hepatocytes. Scale bar, 100 mum ( F ). Fold-changes in IL-6 ( G ) and IL-8 ( H ) mRNA expression at 24 h after 70% PHx. Wild-type mice were intraperitoneally injected with vehicle (Veh) or chloroquine (CQ) at 0.5 h before PHx or the sham operation and then once per day until 48 h. Liver tissues were harvested at 0-48 h after surgery and tissue extracts were analyzed for PCNA, cyclin D1, TGF-beta1, and beta-actin by Western blotting ( I,J ). The values are shown as the mean +- SD in the bar graph and compared using Student's t test. #P < 0.05 versus control-treated PHx (n = 3).

- Submitted by
- Invitrogen Antibodies (provider)
- Main image

- Experimental details
- Figure 1 High fat diet mice have an increased bone tumor growth correlated with tumor-infiltrating osteoclasts/macrophages A. Experimental scheme: mice fed for 6 weeks with normal diet (ND) or high fat diet (HFD) were injected intratibially (i.t.) with B16F10 cells (1x10 4 ) in PBS (50 mul) or with vehicle (PBS, 50 mul). Then, mice were sacrificed at day 3, 5, 6, 7, and 9 post tumor inoculation. B. Hematoxilin & Eosin (HE) stained pictures of tibiae from ND and HFD mice at day 7 post i.t. B16F10 cell injection (magnification x10). Tumor areas are shown by red dotted line. Quantification of the tumor growth at the indicated time point. C-D. Ki67 staining (C) and Ki67 + cells quantification (D) in bone tumor area from ND and HFD mice at day 7 post i.t. B16F10 cell injection (magnification x20). Arrows indicate Ki67 + cells. E. Cyclin D1 mRNA levels in bone from ND and HFD mice at 7 days post i.t. B16F10 cells injection. F. TRAP staining pictures in bone tumor area from ND or HFD mice (magnification x20). Histomorphometric osteoclast quantification in the tumor center of ND or HFD mice. Abbreviations: N.Oc/B.Pm, Number of osteoclasts per bone perimeter; Oc.S/BS, osteoclast surface/bone surface. G. Osteoclast and macrophage gene markers expression in bone from ND and HFD mice 7 days post i.t. B16F10 cells injection. All data are means +- SEM; n=6 to 8 per group. *p

- Submitted by
- Invitrogen Antibodies (provider)
- Main image

- Experimental details
- Figure 5 Tumor growth in PyMT/Ppp1r1b +/+ and PyMT/Ppp1r1b -/- mice. (A) The age at which tumors first appeared (tumor volume 100-300 mm 3 ) was recorded for wild-type (PyMT/Ppp1r1b +/+ ) and knockout (PyMT/Ppp1r1b -/- ) tumor mice (n = 14 per group). Individual ages and the mean age at appearance (+-standard error of the mean) are shown. (B) Kaplan-Meier survival plot showing the age at which mice were euthanized because of extensive tumor burden (maximum tumor volume >1500 mm 3 ). (C-D) Mice surviving to 20 weeks of age were euthanized and tumor volume was measured. (C) Total tumor volume in these mice was calculated as the sum of the individual tumor volumes for each mouse. (D) Maximum tumor volume was defined as the volume of the largest individual tumor per mouse ( n = 8-12 per group); mean +- standard error of the mean, * p < 0.05. (E-F) Tumors were collected at 20 weeks of age, formalin-fixed, sectioned and immuno-stained for Ki67 and CD31. (E) Representative tumor sections and bar graph showing the mean (+- standard error of the mean) number of Ki67-positive cells per field in 10 nonoverlapping fields from three tumors per group (25x magnification, scale bar = 50 mum). (F) Representative tumor sections and bar graph showing the mean (+- standard error of the mean) microvessel density determined by counting the number of CD31-positive endothelial clusters (white arrows) in 10 nonoverlapping fields from three tumors per group (25x magnification, scale bar = 50 mum). (G)

- Submitted by
- Invitrogen Antibodies (provider)
- Main image
- Experimental details
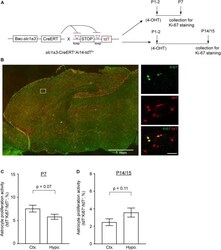
- FIGURE 3 Astrocyte proliferation activity in cortex and hypothalamus determined by genetic labeling of astrocytes and Ki67 immunostaining. (A) Experimental strategy for genetic labeling of astrocytes and Ki-67 staining of proliferating cells at different postnatal time points. (B) Representative images of astrocyte labeling with the tdT reporter in Slc1a3 -CreERT + Ai14-tdT f/+ mice and Ki-67 labeling of actively proliferating cells in P7 brain; magnified images show cortical astrocytes. Scale bars: 1 mm (left panel), 30 mum (magnified images). Percentage of proliferating astrocytes (100 x tdT + Ki-67 + /tdT + ) in cortex and hypothalamus at P7 (C) and P14/P15 (D) ; n = 3 images/mouse from 3-4 individual mice per region/time point. p -values determined by unpaired two-tailed t -test.

- Submitted by
- Invitrogen Antibodies (provider)
- Main image

- Experimental details
- Figure 6. Knockdown of MNX1-AS1 inhibited cell tumorigenesis in LSCC cells. (A) Tumor shapes in shRNA and shMNX1-AS1 groups. (B) Tumor volumes and weights in shRNA and shMNX1-AS1 groups. (C) The levels of miR-744-5p, MNX1-AS1 and BCL9 mRNA were detected by using qRT-PCR assay in tumor tissues from the shRNA and shMNX1-AS1 groups. (D) Immunohistochemistry technology was used to detect the protein levels of BCL9, Ki-67 and beta-catenin in tumor tissues from the shRNA and shMNX1-AS1 groups. ( ** P < 0.01, compared with shRNA group.). LSCC: laryngeal squamous cell carcinoma.

- Submitted by
- Invitrogen Antibodies (provider)
- Main image
- Experimental details
- Fig. 4. Reduction of GABPB1L potentiates anti-tumor response of TERT p mutant GBM to chemotherapy. ( A ) A schematic for possible sensitization of TERT promoter mutant GBM cells to TMZ through GABPB1L inhibition. Inhibiting GABPB1L leads to reduced TERT expression, resulting in a blunted DDR and lack of normal cell cycle arrest, ultimately reducing cancer cell viability following DNA damage. SSB, single-strand break; DSB, double-strand break; DDR, DNA-damage response. ( B ) Representative immunoblots of yH2AX in U-251 cells expressing doxycycline-induced shRNAs targeting TERT (shTERT.3795 and shTERT.3592) or GABPB1L (shGB1L.968 and shGB1L.1202) compared with a nontargeting (renilla luciferase, shRen.713) shRNA. ( C ) Representative immunoblots ( Bottom ) and quantification ( Top , from triplicate blots) of yH2AX in U-251 cells engineered to stably express either BFP (control) or TERT (rescue) in the presence of shRNAs targeting TERT (shTERT.3795 and shTERT.3592) or GABPB1L (shGB1L.968 and shGB1L.1202) compared with a nontargeting shRNA (renilla luciferase, shRen.713). ( B and C ) Cells were incubated with doxycycline for 6 d prior to harvest and treated with specified dose(s) of TMZ 20 h prior to harvest. ( D ) Representative images ( Left ) and G2/G1 ratio quantification ( Right ) from flow cytometry-based cell cycle analysis of U-251 WT and GABPB1L heterozygous knockout cells treated with a dose titration of TMZ 72 h prior to harvest. p, P value (unpaired two-tailed Student

- Submitted by
- Invitrogen Antibodies (provider)
- Main image

- Experimental details
- Fig. 1 The role of KDM6A in proliferation of BCa cells. a The protein expression levels of KDM6A in the BCa cells were determined by Western blot. b The lentivirus mediated KDM6A overexpression in BCa cells were examined by Western blot. c and d Effect of KDM6A overexpression on cell proliferation was examined by MTT assays (c) and colony formation assays (d) in the BCa cells. e The protein expression levels of KDM6A in the indicated cells were determined by Western blot. f The image of subcutaneous tumours developed by the indicated T24 cells peeled from mice was shown. g The representative IHC images of KDM6A and Ki67 in subcutaneous tumours were shown. Scale bars, 50 mum (left) and 20 mum (right). h Cell migration assay of bone marrow monocyte derived-macrophages cocultured with conditioned medium (CM) from indicated cells. All quantification analyses were based on independent triplicate experiments. Error bars represent SD. ** p < 0.01, NS no significant, based on Student's t test

- Submitted by
- Invitrogen Antibodies (provider)
- Main image

- Experimental details
- Fig. 7 Physiological relevance of LETN in liver cancer and NPC proliferation. a - d Proliferation curves of NPM1 -/- HUH7 cells expressing full-length NPM1 (NPM1-F), NPM1-DeltaC, or NPM1-DeltaN, upon overexpression ( a , b ) or siRNA-mediated knockdown ( c , d ) of LETN . The statistical significance levels were obtained by pair-wise comparisons between EV and LETN -OE ( a , b ), or between siNC and si LETN ( c , d ). The error bars represent the +- SD of three biological replicates. e , f Liver cancer patients in TCGA were partitioned into subgroups according to the expression levels of LETN or NPM1 in the tumors. Kaplan-Meier survival curves were prepared for the subgroups of patients with LETN or NPM1 expression above the top 30th percentile or below the bottom 30th percentile ( e ). Next, intersections among the four groups above partitioned these patients further into four new subgroups ( LETN low/high & NPM1 low/high). Kaplan-Meier survival curves for these subgroups were prepared ( f ). P -values were obtained with log-rank tests. g Proliferation signals shown by Ki67 staining in NPC cells derived from H9 ESC cells. The shRNA vectors used in this experiment were labeled with mCherry.

- Submitted by
- Invitrogen Antibodies (provider)
- Main image

- Experimental details
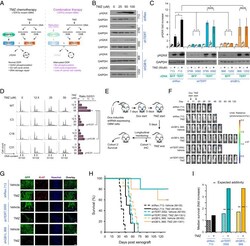
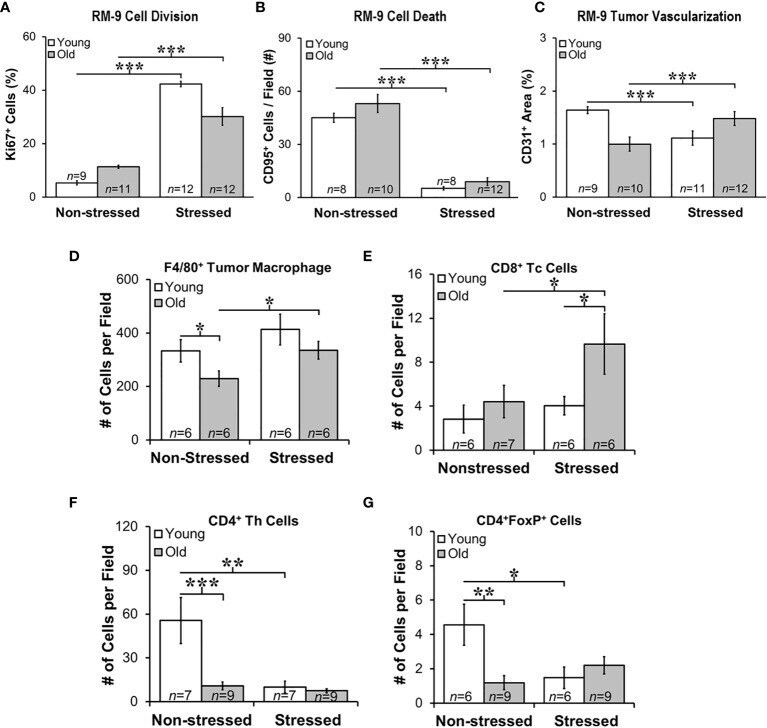
- Figure 5 Stress Promoted Tumor Proliferation and Apoptosis, but Age-dependent Infiltration of Immune Cell Subsets and Vascularization Support Age-dependent Anti-tumor Defense Mechanisms. Quantitation of immunostaining for proliferation (A) , apoptosis (B) , angiogenesis (C) , F4/80 + macrophages, and CD8 + , CD4 + , and CD4 + FoxP + cells (D-G , respectively) in young (open bar) and old (gray bar) non-stressed and stressed mice D14 after orthotopic prostate tumor inoculation. (A) Stress increased prostate tumor expression of Ki67 in young and old mice compared with non-stress age-matched mice. (B) Conversely, CD95 expression was lower in RM-9 tumors from stressed than in non-stressed young and old mice. (C) CD31 immunoreactivity was higher in stressed than non-stressed old mice, but in young mice expression was greater in non-stressed than the stressed group. (D) F4/80 + tumor macrophages were fewer (* p < 0.05) in old than young non-stressed mice, but were higher in stressed than non-stressed old mice. (E) CD8 + Tc cell numbers were similar in non-stressed mice, but were higher in old than young in stressed mice. Moreover, more ( p
- Submitted by
- Invitrogen Antibodies (provider)
- Main image

- Experimental details
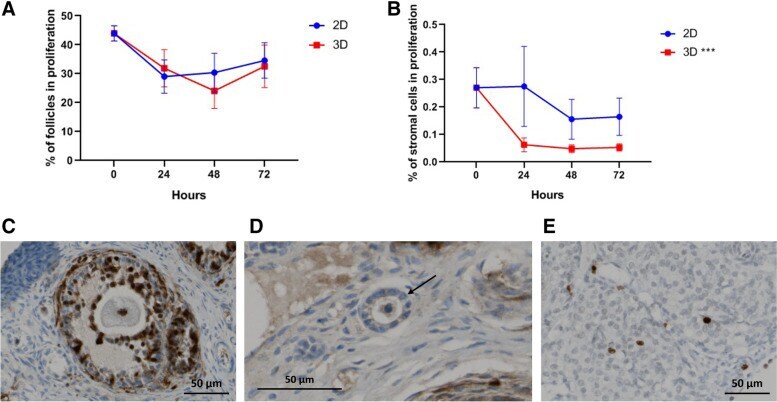
- Fig. 5 Tissue proliferation evaluated through Ki67 staining in follicles ( A ) and stromal cells ( B ). Representative images of Ki67 staining in a secondary follicle ( C ) and stromal cells ( E ). A negative primary follicle (arrow) is represented in D . A linear regression was performed for 2D and 3D groups and their corresponding slopes show a decrease over time in stromal cell proliferation for 3D group. Original magnification x 200 ( C , E ) and x 400 ( D ), scale bar 50 mum. Data presented as mean +- SEM. *** p < 0.001
- Submitted by
- Invitrogen Antibodies (provider)
- Main image

- Experimental details
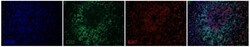
- Figure 5 Intraventricular injection of MSC-Exo alleviates SE-induced hippocampal astrocytic activation in mice. The influence of MSC-Exo on hippocampal astrocytic activation was examined in the acute and chronic stages of SE. (A-L) Representative images display the immunofluorescence intensity of GFAP (A-L, red), CD81 (A-D, green), C3 (E-H, green), and ki67 (I-L, green) in the hippocampus at 4 d post-SE, cell nuclei stained with DAPI (blue). (M-P) Fluorescence intensity assay of the relative expression of GFAP (M), CD81 (N), C3 (O), and ki67 (P) in each group. (Q) Western blots of protein expression of C3, CD81, and GFAP at 24 h, 4 d, 7 d, and 8 w post-SE in the hippocampus. (R-T) Statistical analysis of changes in C3 (R), CD81 (S), and GFAP (T) expression in each group. Statistical difference between groups is displayed in histograms. Scale bars: A-L, 50 mum; A1-L1 and A2-L2, 20 mum.

- Submitted by
- Invitrogen Antibodies (provider)
- Main image

- Experimental details
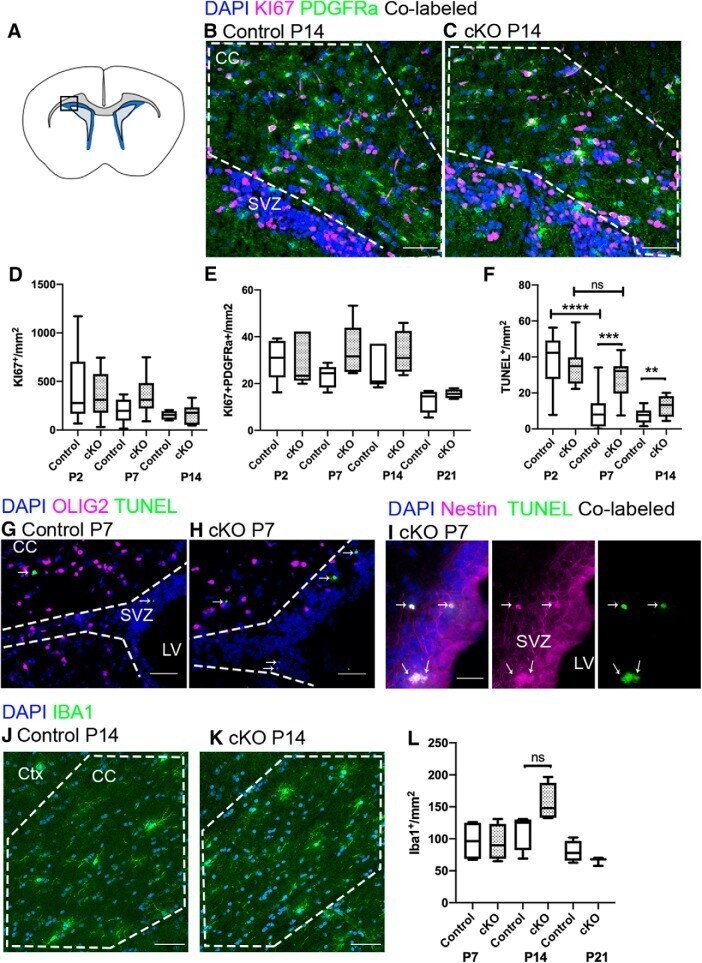
- Figure 6. NSC survival is reduced in the Raldh2 cKO. A , Coronal section illustrating the regions imaged in the other panels. B , C , Control and cKO mice both have proliferating PDGFRalpha + cells (green) identified by co-labeling (white) with KI67 (magenta), and non-proliferating PDGFRalpha + cells. D , E , Control and cKO mice have comparable numbers of total KI67 + cells and KI67 + PDGFRalpha + cells at all time points. F , Between P2 and P7 in control animals, the number of TUNEL + cells dropped significantly. Between P2 and P7 in cKO mice, TUNEL + cell numbers were unchanged. At P7 and P14, cKO mice had significantly more TUNEL + cells than controls. G , H , Dying cells identified by labeling with TUNEL (green, thin arrow) were present in the CC and SVZ (delineated by dotted lines) of both controls and cKO, though no OLIG2 + cells were co-labeled with TUNEL. I , In the cKO SVZ, 76% of all TUNEL + cells were co-labeled by Nestin [magenta, co-labeled cells are white (thin arrow)]. J , K , Immunofluorescence for IBA1 + in the CC of control and cKO mice. L , Quantification of the number of IBA1 + cells shows no significant difference between groups; a transient increase in IBA1 + cells appears at P7 in cKO mice but does not reach significance. CC, corpus callosum; SVZ, subventricular zone; LV, lateral ventricle; cKO, conditional knock-out. Scale bars: 50 mum ( B , C , G , H , J , K ) and 25 mum ( I ). Box and whisker plot, box: 25th and 75th percentile, whiskers: minimum to
- Submitted by
- Invitrogen Antibodies (provider)
- Main image

- Experimental details
- Figure 1 Representative confocal microscopy images of immunohistochemistry detection of Ki67, DCX (doublecortin) and CR (calretinin) in CB2 wildtype and knockout brain sections. ( a ) Overview of the mouse dentate gyrus (magenta in black rectangle) in the hippocampus and identification of relevant structures in a representative microscopy image of a brain section with DAPI-staining. ( b ) Merged fluorescent images of subgranular zone (SGZ) from both genotypes stained with DCX (green), calretinin (magenta) and DAPI (blue) are seen in the first row. The white rectangle shows the field of view that is shown in rows two to four in higher magnification. White arrowheads indicating the location of CR+DCX+ cells, the asterisk shows a CR+ inhibitory neuron in the hilus. ( c ) Merged fluorescent images of SGZ from both genotypes stained with Ki67 (green) and DAPI (blue) are seen in the first row. The white rectangle shows the field of view that is shown in rows two to three in higher magnification. The dotted line represents the SGZ. Template for scheme in ( a ) modified from The Scalable Brain Atlas [ 18 , 19 ].

- Submitted by
- Invitrogen Antibodies (provider)
- Main image

- Experimental details
- Figure 1 ( a ) Tumor growth rate after the subcutaneous injection of B16-F10 cells in control (Crl), vehicle-(Veh), propranolol-(Prop), or SR59230A-(SR) treated C57BL/6 mice (n = 6). Values are presented as mean +- SD. ( b ) Representative Annexin V/PI staining plots of homogenized tumor samples after 20 days of treatment (T20). ( c ) Confocal microscopy images of PI staining of tumors obtained from mice injected with B16-F10-GFP. ( d ) Representative immunohistochemical staining of proliferation marker Ki-67 in tumor tissues after 20 days of treatment (T20), and relative quantification. ( e ) Representative immunohistochemical staining of beta2- and beta3-ARs in tumor tissues, and relative quantification after 10 days (T10) and 20 days (T20) of treatment. ns= not significant; beta2-Ars = beta2-Adrenoreceptors; beta3-ARs= beta3-Adrenoreceptors.

- Submitted by
- Invitrogen Antibodies (provider)
- Main image

- Experimental details
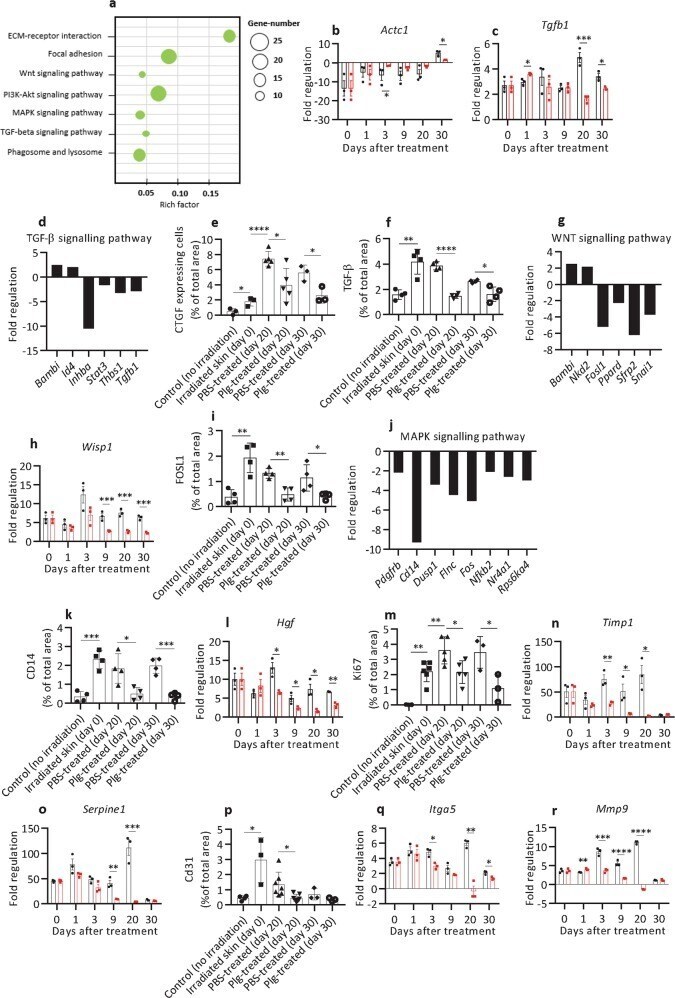
- Fig. 4 Plasminogen treatment regulates the expression of genes responsible for the formation and remodeling of granulation tissue. a The KEGG enrichment scatter plot of genes involved in the formation and remodeling of granulation tissue that were significantly downregulated in plasminogen-treated wounds at day 20 when compared with PBS-treated wounds, as identified using mRNA sequencing. b , c Expression of Actc1 and Tgfb1 (respectively) in radiation wounds before treatment (day 0) ( n = 3) and at different time points of PBS (black) ( n = 3) or plasminogen (red) ( n = 3) treatment as measured with the Mouse Wound Healing RT 2 Profiler PCR array. The mRNA levels for all samples are presented as fold regulation relative to mRNA levels in the control healthy, nonirradiated skin. d The expression of genes involved in the TGF-beta pathway that were significantly changed in plasminogen-treated wounds at day 20 when compared with PBS-treated wounds, as measured using mRNA sequencing. e , f Quantification of CTGF and TGF-beta (respectively) protein levels in healthy non-radiated skin, in irradiated skin before treatment (day 0), and in PBS- and plasminogen-treated radiation wounds at days 20 and 30, based on immunostaining of paraffin sections from the wounded area ( n >= 3). g Expression of genes involved in the WNT pathway measured as described in panel d . h Expression of Wisp1 in radiation wounds shown as described in panel b . i Quantification of FOSL1 protein levels as descri