Explore
 Validate
 Learn
Learn Western blot
Antibody data
- Antibody Data
- Antigen structure
- References [12]
- Comments [0]
- Validations
- Western blot [2]
- ELISA [2]
- Immunocytochemistry [3]
- Chromatin Immunoprecipitation [2]
- Other assay [6]
Submit
Validation data
Reference
Comment
Report error
- Product number
- 49-1008 - Provider product page

- Provider
- Invitrogen Antibodies
- Product name
- H3K9me3 Polyclonal Antibody
- Antibody type
- Polyclonal
- Antigen
- Synthetic peptide
- Description
- 49-1008, H3K9me3 antibody, has been shown to recognize plant species such as Arabidopsis and silena latifolia.
- Reactivity
- Human, Mouse, Zebrafish
- Host
- Rabbit
- Isotype
- IgG
- Vial size
- 50 µg
- Concentration
- 0.9 mg/mL
- Storage
- -20° C, Avoid Freeze/Thaw Cycles
Submitted references Natural Antisense Transcript PEBP1P3 Regulates the RNA Expression, DNA Methylation and Histone Modification of CD45 Gene.
Misexpression of genes lacking CpG islands drives degenerative changes during aging.
Inducing and exploiting vulnerabilities for the treatment of liver cancer.
Silencing of retrotransposons by SETDB1 inhibits the interferon response in acute myeloid leukemia.
DNA methylation and not H3K4 trimethylation dictates the expression status of miR-152 gene which inhibits migration of breast cancer cells via DNMT1/CDH1 loop.
Epigenetic drift towards histone modifications regulates CAV1 gene expression in colon cancer.
Upregulating endogenous genes by an RNA-programmable artificial transactivator.
Long non-coding RNA urothelial carcinoma associated 1 induces cell replication by inhibiting BRG1 in 5637 cells.
p107-Dependent recruitment of SWI/SNF to the alkaline phosphatase promoter during osteoblast differentiation.
FBXO22 protein is required for optimal synthesis of the N-methyl-D-aspartate (NMDA) receptor coagonist D-serine.
Cross-species genomic and epigenomic landscape of retinoblastoma.
Induction of 11β-HSD 1 and activation of distinct mineralocorticoid receptor- and glucocorticoid receptor-dependent gene networks in decidualizing human endometrial stromal cells.
Su Z, Liu G, Zhang B, Lin Z, Huang D
Genes 2021 May 17;12(5)
Genes 2021 May 17;12(5)
Misexpression of genes lacking CpG islands drives degenerative changes during aging.
Lee JY, Davis I, Youth EHH, Kim J, Churchill G, Godwin J, Korstanje R, Beck S
Science advances 2021 Dec 17;7(51):eabj9111
Science advances 2021 Dec 17;7(51):eabj9111
Inducing and exploiting vulnerabilities for the treatment of liver cancer.
Wang C, Vegna S, Jin H, Benedict B, Lieftink C, Ramirez C, de Oliveira RL, Morris B, Gadiot J, Wang W, du Chatinier A, Wang L, Gao D, Evers B, Jin G, Xue Z, Schepers A, Jochems F, Sanchez AM, Mainardi S, Te Riele H, Beijersbergen RL, Qin W, Akkari L, Bernards R
Nature 2019 Oct;574(7777):268-272
Nature 2019 Oct;574(7777):268-272
Silencing of retrotransposons by SETDB1 inhibits the interferon response in acute myeloid leukemia.
Cuellar TL, Herzner AM, Zhang X, Goyal Y, Watanabe C, Friedman BA, Janakiraman V, Durinck S, Stinson J, Arnott D, Cheung TK, Chaudhuri S, Modrusan Z, Doerr JM, Classon M, Haley B
The Journal of cell biology 2017 Nov 6;216(11):3535-3549
The Journal of cell biology 2017 Nov 6;216(11):3535-3549
DNA methylation and not H3K4 trimethylation dictates the expression status of miR-152 gene which inhibits migration of breast cancer cells via DNMT1/CDH1 loop.
Sengupta D, Deb M, Rath SK, Kar S, Parbin S, Pradhan N, Patra SK
Experimental cell research 2016 Aug 15;346(2):176-87
Experimental cell research 2016 Aug 15;346(2):176-87
Epigenetic drift towards histone modifications regulates CAV1 gene expression in colon cancer.
Deb M, Sengupta D, Kar S, Rath SK, Roy S, Das G, Patra SK
Gene 2016 Apr 25;581(1):75-84
Gene 2016 Apr 25;581(1):75-84
Upregulating endogenous genes by an RNA-programmable artificial transactivator.
Fimiani C, Goina E, Mallamaci A
Nucleic acids research 2015 Sep 18;43(16):7850-64
Nucleic acids research 2015 Sep 18;43(16):7850-64
Long non-coding RNA urothelial carcinoma associated 1 induces cell replication by inhibiting BRG1 in 5637 cells.
Wang X, Gong Y, Jin B, Wu C, Yang J, Wang L, Zhang Z, Mao Z
Oncology reports 2014 Sep;32(3):1281-90
Oncology reports 2014 Sep;32(3):1281-90
p107-Dependent recruitment of SWI/SNF to the alkaline phosphatase promoter during osteoblast differentiation.
Flowers S, Patel PJ, Gleicher S, Amer K, Himelman E, Goel S, Moran E
Bone 2014 Dec;69:47-54
Bone 2014 Dec;69:47-54
FBXO22 protein is required for optimal synthesis of the N-methyl-D-aspartate (NMDA) receptor coagonist D-serine.
Dikopoltsev E, Foltyn VN, Zehl M, Jensen ON, Mori H, Radzishevsky I, Wolosker H
The Journal of biological chemistry 2014 Dec 5;289(49):33904-15
The Journal of biological chemistry 2014 Dec 5;289(49):33904-15
Cross-species genomic and epigenomic landscape of retinoblastoma.
Benavente CA, McEvoy JD, Finkelstein D, Wei L, Kang G, Wang YD, Neale G, Ragsdale S, Valentine V, Bahrami A, Temirov J, Pounds S, Zhang J, Dyer MA
Oncotarget 2013 Jun;4(6):844-59
Oncotarget 2013 Jun;4(6):844-59
Induction of 11β-HSD 1 and activation of distinct mineralocorticoid receptor- and glucocorticoid receptor-dependent gene networks in decidualizing human endometrial stromal cells.
Kuroda K, Venkatakrishnan R, Salker MS, Lucas ES, Shaheen F, Kuroda M, Blanks A, Christian M, Quenby S, Brosens JJ
Molecular endocrinology (Baltimore, Md.) 2013 Feb;27(2):192-202
Molecular endocrinology (Baltimore, Md.) 2013 Feb;27(2):192-202
No comments: Submit comment
Supportive validation
- Submitted by
- Invitrogen Antibodies (provider)
- Main image
- Experimental details
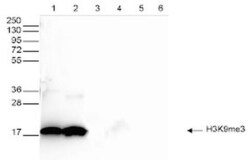
- Western blot was performed on whole cell (25 µg, lane 1) and histone extracts (15 µg, lane 2) from HeLa cells, and on 1 µg of recombinant histone H2A, H2B, H3 and H4 (lane 3, 4, 5 and 6, respectively) using the anti-H3K9me3 antibody (Product # 49-1008). The antibody was diluted 1:1,000 in TBS-Tween containing 5% skimmed milk. The position of the protein of interest is indicated on the right; the marker (in kDa) is shown on the left.

- Submitted by
- Invitrogen Antibodies (provider)
- Main image

- Experimental details
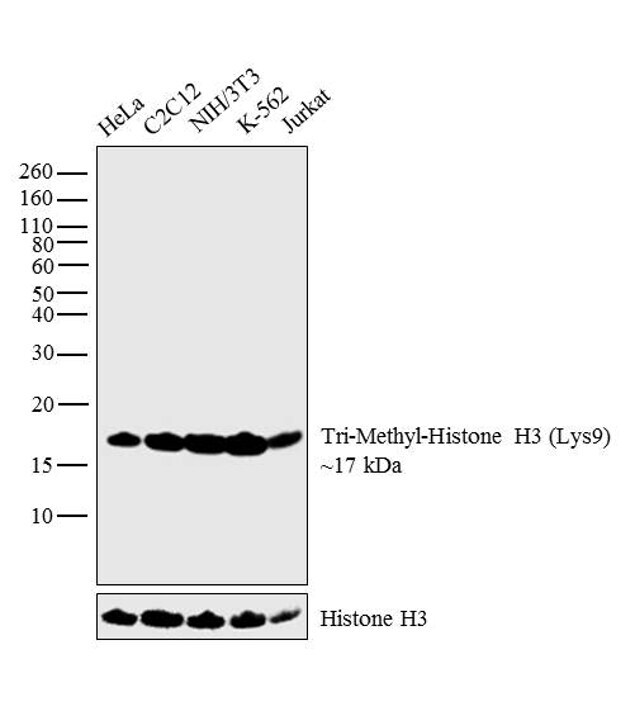
- Western blot analysis was performed on acid extracts (20 µg lysate) of HeLa (Lane 1), C2C12 (Lane 2), NIH/3T3 (Lane 3), K-562 (Lane 4) and Jurkat (Lane 5). The blot was probed with Anti-Tri-Methyl-Histone H3 (Lys9) (Product # 49-1008, 1:1000 dilution) and detected by chemiluminescence using Goat anti-Rabbit IgG (H+L) Superclonal™ Secondary Antibody, HRP conjugate (Product # A27036, 0.25 µg/mL, 1:4000 dilution). A 17 kDa band corresponding to Tri-Methyl-Histone H3 (Lys9) was observed across the cell lines tested.
Supportive validation
- Submitted by
- Invitrogen Antibodies (provider)
- Main image
- Experimental details
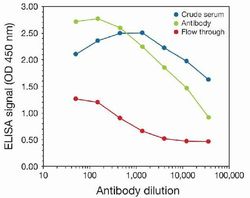
- To determine the titer, an ELISA was performed using anti-H3K9me3 crude serum, the anti-H3K9me3 polyclonal antibody (Product # 49-1008), and the column flow through obtained from the antibody purification step. The antigen used to coat the ELISA plate was a peptide containing the histone modification of interest. By plotting the absorbance against the antibody dilution, the titer of the purified antibody was estimated to be 1:13, 500.

- Submitted by
- Invitrogen Antibodies (provider)
- Main image

- Experimental details
- To determine the titer of the antibody, an ELISA was performed using a serial dilution of the antibody directed against human H3K9me3 antibody (Product # 49-1008) in antigen coated wells. The antigen used was a peptide containing the histone modification of interest. By plotting the absorbance against the antibody dilution, the titer of the antibody was estimated to be 1:30,000.

Supportive validation
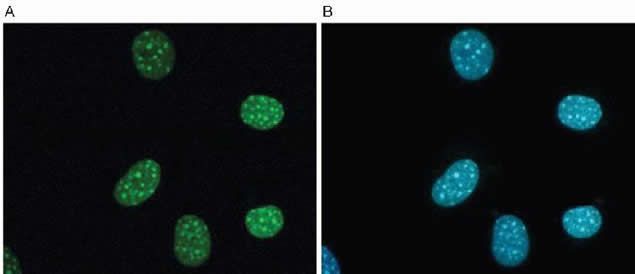
- Submitted by
- Invitrogen Antibodies (provider)
- Main image

- Experimental details
- Immunofluorescence study using the anti-H3K9me3 polyclonal antibody. NIH3T3 cells (mouse fibroblasts) were formaldehyde fixed, permeabilized with Triton® X-100 (Dow Chemical Co) and blocked with PBS containing 2.5% BSA. (A) Cells were labeled with the anti-H3K9me3 antibody (diluted 1:200 and incubated for 1 hour at room temperature) followed by FITC-labeled goat anti-rabbit secondary antibody. (B) Nuclei were stained using the DNA-specific stain DAPI. Both the anti-H3K9me3 antibody and DAPI produced clear nuclear staining. The dense signals obtained with both probes characterize the distribution pattern of H3K9me3, which is linked to the transcriptionally inactive, condensed pericentric heterochromatin.
- Submitted by
- Invitrogen Antibodies (provider)
- Main image

- Experimental details
- HeLa cells were stained with the anti-H3K9me3 antibody (Product # 49-1008) and with DAPI. Cells were fixed with 4% formaldehyde for 10’ and blocked with PBS/TX-100 containing 5% normal goat serum and 1% BSA. The cells were immunofluorescently labelled with the H3K9me3 antibody (middle) diluted 1:1,000 in blocking solution followed by an anti-rabbit antibody conjugated to Alexa488. The left panel shows staining of the nuclei with DAPI. A merge of both stainings is shown on the right.

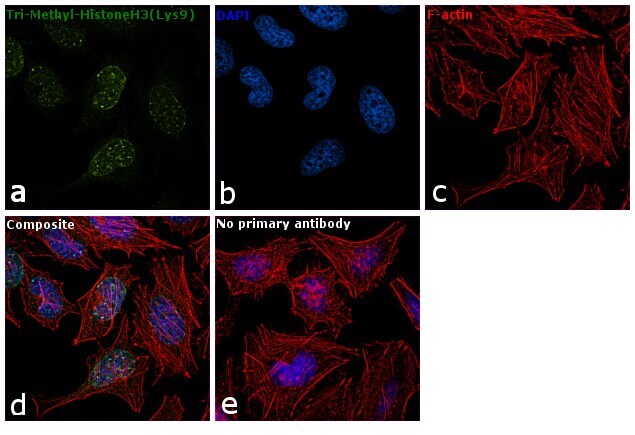
- Submitted by
- Invitrogen Antibodies (provider)
- Main image

- Experimental details
- Immunofluorescence analysis of Tri-Methyl-Histone H3 (Lys9) was performed using 70% confluent log phase HeLa cells. The cells were fixed with 4% paraformaldehyde for 10 minutes, permeabilized with 0.1% Triton™ X-100 for 10 minutes, and blocked with 1% BSA for 1 hour at room temperature. The cells were labeled with Rabbit Polyclonal Antibody (Product # 49-1008) at 5 µg/mL in 0.1% BSA and incubated overnight at 4 degree and then labeled with Goat anti-Rabbit IgG (H+L) Superclonal™ Secondary Antibody, Alexa Fluor® 488 conjugate (Product # A27034) at a dilution of 1:2000 for 45 minutes at room temperature (Panel a: green). Nuclei (Panel b: blue) were stained with SlowFade® Gold Antifade Mountant with DAPI (Product # S36938). F-actin (Panel c: red) was stained with Rhodamine Phalloidin (Product # R415, 1:300). Panel d represents the merged image showing nuclear localization. Panel e represents control cells with no primary antibody to assess background. The images were captured at 60X magnification.
Supportive validation
- Submitted by
- Invitrogen Antibodies (provider)
- Main image

- Experimental details
- ChIP results obtained with the rabbit anti-H3K9me3 polyclonal antibody. ChIP assays were performed using HeLa cells, the rabbit anti-H3K9me3 polyclonal antibody (Product # 49-1008) and optimized real time PCR primer sets for qPCR. Each ChIP assay used sheared chromatin from 1.5 million cells and 5 µg of H3K9me3 antibody. IgG (5 µg/IP) was used as a negative IP control. Trimethylation of H3K9 is a marker for heterochromatin. Therefore, we used the promoter of a housekeeping gene c-fos, which is actively transcribed, as a negative control target. Sat-2, present in heterochromatin, is used as a positive control target. Recoveries (expressed as percentage of input) are shown. Bars 1 and 3 represent the recovery (the relative amount of immunoprecipitated DNA compared to input DNA after qPCR analysis) using the H3K9me3 antibody of the c-fos promoter and Sat-2, respectively. Bars 2 and 4 represent the recovery using the IgG negative control.

- Submitted by
- Invitrogen Antibodies (provider)
- Main image

- Experimental details
- Enrichment of endogenous Tri-Methyl-Histone H3 (Lys9) protein at specific gene loci using Anti-Tri-Methyl-Histone H3 (Lys9) Rabbit Polyclonal Antibody: Chromatin Immunoprecipitation (ChIP) was performed using Anti-Tri-Methyl-Histone H3 (Lys9) Rabbit Polyclonal Antibody (Product # 49-1008, 3 ug) on sheared chromatin from 2 million HeLa cells using the "MAGnify ChIP system" kit (Product # 49-2024). Normal Rabbit IgG was used as a negative IP control. The purified DNA was analyzed by qPCR with PCR primer pairs for the promoters of SAT2 satellite repeats, SATa used as positive, and C-FOS, ALDOA, GAPDH used as negative target genes/binding sites. Data is presented as fold enrichment of the antibody signal versus the negative control IgG using the comparative CT method.

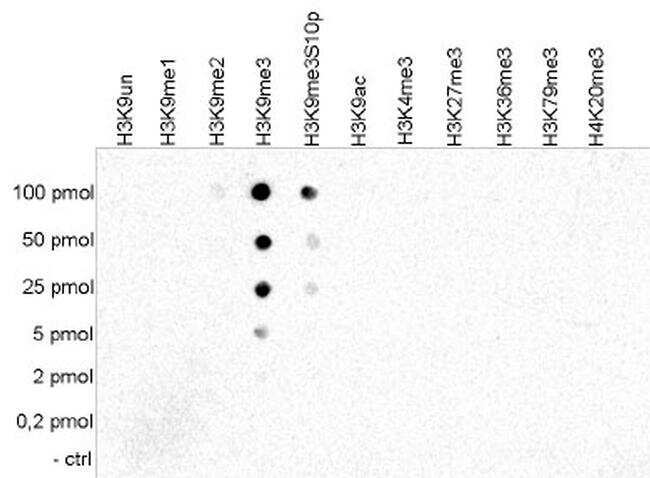
Supportive validation
- Submitted by
- Invitrogen Antibodies (provider)
- Main image

- Experimental details
- A Dot Blot analysis was performed to test the cross reactivity of the anti-H3K9me3 antibody (Product # 49-1008) with peptides containing other modifications and unmodified sequences of histone H3 and H4. One hundred to 0.2 pmol of the peptide containing the respective histone modification were spotted on a membrane. The antibody was used at a dilution of 1:20,000.
- Submitted by
- Invitrogen Antibodies (provider)
- Main image

- Experimental details
- NULL
- Submitted by
- Invitrogen Antibodies (provider)
- Main image

- Experimental details
- NULL

- Submitted by
- Invitrogen Antibodies (provider)
- Main image

- Experimental details
- Figure 5 UCA1 blocks recruitment of BRG1 to chromatin. (A) UCA1 does not affect the ATPase activity of BRG1. The kinetics of BRG1-induced ATP hydrolysis were analyzed in the presence or absence of UCA1. (B) ChIP analysis of BRG1 binding to the p21 promoter in 5637-iUCA1. 5637-NC cells were used as the control. Genomic DNA was fixed and immunoprecipitated using anti-BRG1 antibody, with IgG as a negative control. Real-time PCR was performed using a primer set specific to the BRG1-binding site of p21 promoter. Data were normalized to input and are expressed as the means +- SD of three independent experiments. * P

- Submitted by
- Invitrogen Antibodies (provider)
- Main image
- Experimental details
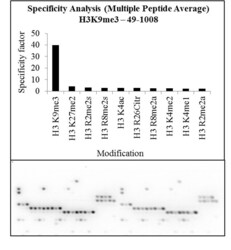
- Antibody specificity for modified targets can be established using peptide arrays by quantifying detection of the target protein along with closely related proteins. Peptide array of Histone H3K9me3 using Anti-Tri-Methyl-Histone H3 (Lys9) Polyclonal Antibody: An array of the specific peptide and other relevant peptides when tested using Anti-Tri-Methyl-Histone H3 (Lys9) Polyclonal Antibody (Product # 49-1008), showed that the Histone H3K9me3 modification was specifically recognized by the antibody.

- Submitted by
- Invitrogen Antibodies (provider)
- Main image
- Experimental details
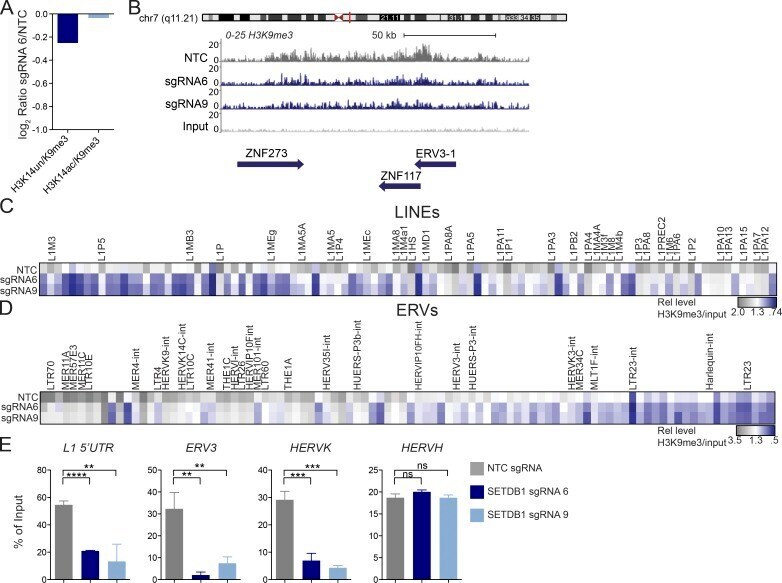
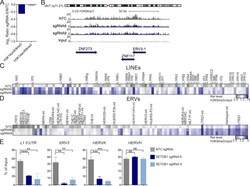
- Figure 3. Loss of SETDB1 leads to a modest reduction in H3K9me3. (A) Histone mass spectrometry analysis of H3K9me3 levels in THP-1-Cas9 cells after 6 d of treatment with SETDB1 sgRNA 6 or NTC (log 2 ratios of sgRNA 6 over NTC are shown). (B) Density plot showing H3K9me3 levels over the ERV3-1 / ZNF117 locus as well as the neighboring ZNF273 gene (levels of H3K9me3 in THP-1-Cas9 cells are shown after 6 d of treatment with control NTC sgRNA or distinct SETDB1- specific sgRNAs. Y axis is 0-25 and region shown is ~150 kb. (C) Low input nChIP-seq heat map showing LINE-1 elements with a >=1.2-fold reduction in H3K9me3 after 6 d of treatment with sgRNA 6, sgRNA 9, or NTC. For each sgRNA, the relative enrichment = fractional H3K9me3 reads/nonimmunoprecipitated chromatin reads (input/background). Highlighted genes were up-regulated at days 4, 7, or both days in SETDB1 mutant RNA-seq datasets. (D) As in C; heat map showing ERV elements with a >=1.2-fold reduction in H3K9me3 after 6 d of treatment with sgRNA 6, sgRNA, 9 or NTC. (E) ChIP-PCR validation of ChIP-seq data from day 6, showing percentage of input of cells treated with NTC or SETDB1 -specific sgRNAs for L1 LINE 5'UTR, HERV-K -rev, ERV3-1 -exon, and HERV-H -pregag ( n = 3 experiments. Student's t tests were performed). All error bars represent standard deviation. ns, not significant, P > 0.05; **, P < 0.01; ***, P < 0.001; ****, P < 0.0001.