Explore
 Validate
 Learn
Learn Western blot
Antibody data
- Antibody Data
- Antigen structure
- References [3]
- Comments [0]
- Validations
- Western blot [2]
- Immunocytochemistry [1]
- Flow cytometry [1]
- Protein array [1]
- Chromatin Immunoprecipitation [2]
- Other assay [5]
Submit
Validation data
Reference
Comment
Report error
- Product number
- 720096 - Provider product page

- Provider
- Invitrogen Antibodies
- Product name
- H3K27ac Polyclonal Antibody
- Antibody type
- Polyclonal
- Antigen
- Synthetic peptide
- Description
- These Polyclonal antibodies are of rabbit origin developed by immunizing animals with proteins or peptides. The polyclonal antibody is purified by affinity purification from the rabbit sera generated after immunizing the rabbits with a specific type of protein or peptide. The purified antibody is tested for its functionality in various relevant research applications. The antibody is developed for Research Use Only and is non-hazardous or non-infectious in nature.
- Concentration
- 0.5 mg/mL
Submitted references Purine-Induced IFN-γ Promotes Uric Acid Production by Upregulating Xanthine Oxidoreductase Expression.
Androgen Receptor-Activated Enhancers Simultaneously Regulate Oncogene TMPRSS2 and lncRNA PRCAT38 in Prostate Cancer.
Selective inhibition of CTCF binding by iAs directs TET-mediated reprogramming of 5-hydroxymethylation patterns in iAs-transformed cells.
Wang H, Xie L, Song X, Wang J, Li X, Lin Z, Su T, Liang B, Huang D
Frontiers in immunology 2022;13:773001
Frontiers in immunology 2022;13:773001
Androgen Receptor-Activated Enhancers Simultaneously Regulate Oncogene TMPRSS2 and lncRNA PRCAT38 in Prostate Cancer.
Chen Z, Song X, Li Q, Xie L, Guo T, Su T, Tang C, Chang X, Liang B, Huang D
Cells 2019 Aug 9;8(8)
Cells 2019 Aug 9;8(8)
Selective inhibition of CTCF binding by iAs directs TET-mediated reprogramming of 5-hydroxymethylation patterns in iAs-transformed cells.
Rea M, Gripshover T, Fondufe-Mittendorf Y
Toxicology and applied pharmacology 2018 Jan 1;338:124-133
Toxicology and applied pharmacology 2018 Jan 1;338:124-133
No comments: Submit comment
Supportive validation
- Submitted by
- Invitrogen Antibodies (provider)
- Main image

- Experimental details
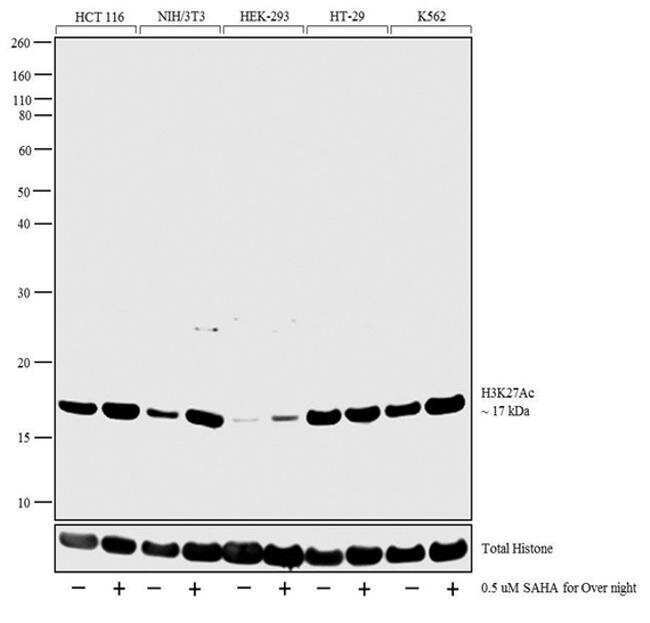
- Western blot analysis was performed on acid cell extracts (30 µg lysate) of HCT116 (Lane1), HCT116 treated with SAHA (Lane 2), NIH/3T3 (Lane 3), NIH/3T3 treated with SAHA (Lane 4), HEK-293 (Lane 5), HEK-293 treated with SAHA (Lane 6), HT-29 (Lane 7), HT-29 treated with SAHA (Lane 8), K562 (Lane 9), K562 treated with SAHA (0.5 uM/16 hours) (Lane 10). The blots were probed with Anti-Histone H3K27ac Rabbit Polyclonal Antibody (Product # 720096, 1-2 µg/mL) and detected by chemiluminescence using Goat anti-Rabbit IgG (H+L) Superclonal™ Secondary Antibody, HRP conjugate (Product # A27036, 0.4 µg/mL, 1:2500 dilution). A clear 17kDa band corresponding to Histone H3K27ac was observed across cell lines tested. Known quantity of protein samples were electrophoresed using Novex® NuPAGE® 4-12% Bis-Tris gel (Product # NP0321BOX), XCell SureLock™ Electrophoresis System (Product # EI0002), and Novex® Sharp Pre-Stained Protein Standard (Product # LC5800). Resolved proteins were then transferred onto a nitrocellulose membrane with iBlot® Dry Blotting System (Product # IB21001). The membrane was probed with the relevant primary and secondary antibody following blocking with 5% skimmed milk. Chemiluminescent detection was performed using Pierce™ ECL Western Blotting Substrate (Product # 32106).
- Submitted by
- Invitrogen Antibodies (provider)
- Main image

- Experimental details
- Western blot analysis of Histone H3K27ac was performed by loading 1 µg of from MCF7 (lane 1), MDA-MB -231 (lane 2) and MDA-MB-468 (lane 3) HCl extracted histones. 4 µL Page-Ruler Prestained Protein Ladder (Product # 26619) per well was loaded onto a 14% Tris-HCl polyacrylamide gel. Proteins were transferred to a nitrocellulose membrane and blocked with 5% Milk/PBST for at least 1 hour at room temperature. Histone H3K27ac antibody (Product # 720096) was diluted 1:3000 in blocking buffer overnight at 4°C on a rocking platform, followed by a goat anti-rabbit IgG-HRP secondary antibody at a dilution of 1:10,000 for at least 1 hour. Chemiluminescent detection was performed using SuperSignal West Pico (Product # 34077) and H3K27ac was detected approximately 17 kDa. Data courtesy of Dr. Wei Xu's lab.

Supportive validation
- Submitted by
- Invitrogen Antibodies (provider)
- Main image

- Experimental details
- Immunofluorescence was performed on fixed and permeabilized HepG2 cells for detection of Histone H3K27ac using Anti-Histone H3K27ac Rabbit Polyclonal Antibody (Product # 720096, 0.5 µg/mL) and labeled with Goat anti-Rabbit IgG (H+L) Superclonal™ Secondary Antibody, Alexa Fluor® 488 conjugate (Product # A27034, 1:2000). Panel a) shows representative cells that were stained for detection and localization of Histone H3K27ac protein (green), Panel b) is stained for nuclei (blue) using SlowFade® Gold Antifade Mountant with DAPI (Product # S36938,). Panel c) represents cytoskeletal F-actin staining using Alexa Fluor® 555 Rhodamine Phalloidin (Product # R415, 1:300). Panel d) is a composite image of Panels a, b and c clearly demonstrating nuclear localization of Histone H3K27ac. Panel e) represents control cells with no primary Antibody to assess background.

Supportive validation
- Submitted by
- Invitrogen Antibodies (provider)
- Main image

- Experimental details
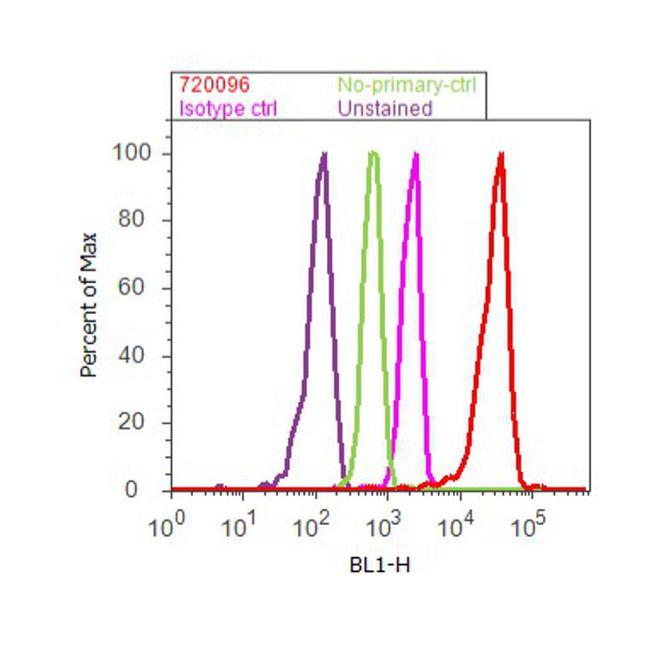
- Flow Cytometry analysis of Histone H3K27ac was performed on Jurkat cells labeled with Anti-Histone H3K27ac Rabbit Polyclonal Antibody (Product# 720096, 2-4 ug/ 1M cells) or with rabbit isotype control and detected with Goat anti-Rabbit IgG (H+L) Superclonal™ Secondary Antibody, (Alexa Fluor® 488 conjugate, Product # A27034, 0.4 ug/ml, 1:2500) as represented by the red and pink histograms respectively. The purple histogram represents unstained control cells and the green histogram represents no-primary-antibody control. A representative of 10,000 cells were acquired and analyzed for each sample using an Attune® Acoustic Focusing Cytometer (4468770).
Supportive validation
- Submitted by
- Invitrogen Antibodies (provider)
- Main image

- Experimental details
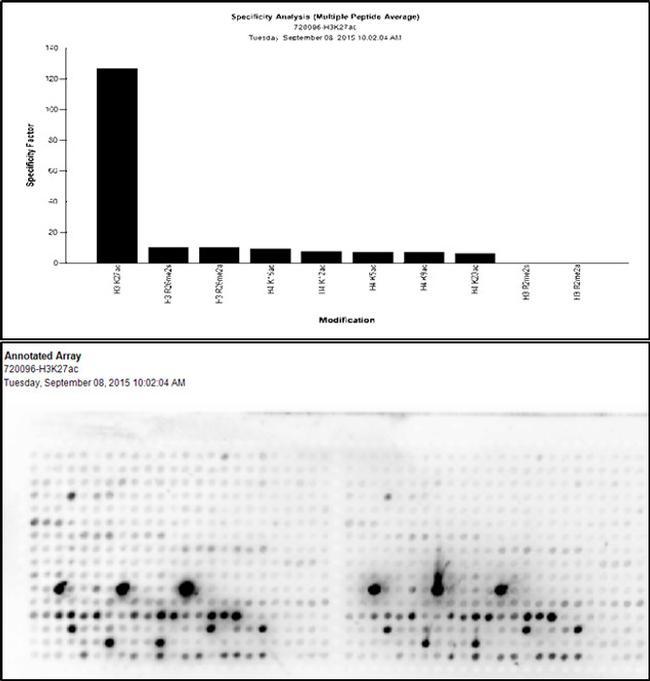
- The specificity of the Antibody, Anti-Histone H3K27ac Rabbit Polyclonal Antibody (Product # 720096, 1-2 ug/ml) to Histone H3K27ac peptide was confirmed using MODified™ Histone Peptide Array (Product #13001, Active Motif). Goat anti-Rabbit IgG (H+L) Superclonal™ Secondary Antibody, HRP conjugate (Product # A27036, 0.4 ug/ml, 1:2500 dilution) was used as secondary Antibody. Chemiluminescent detection was performed using Novex® ECL Chemiluminescent Substrate Reagent Kit (Product # WP20005).The dot blot data obtained (lower panel) was analyzed using Array analyze software as per manufacturer instructions (Top panel).
Supportive validation
- Submitted by
- Invitrogen Antibodies (provider)
- Main image
- Experimental details
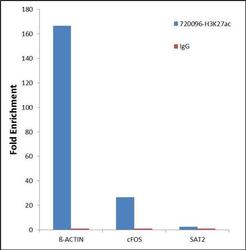
- Chromatin Immunoprecipitation (ChIP) was performed using Anti-Histone H3K27ac Rabbit Polyclonal Antibody (Product # 720096, 1.5 ug) on sheared chromatin from 2 million Jurkat cells treated with 0.5uM SAHA for 24 hours using the "MAGnify ChIP system" kit (Product # 49-2024). Normal Rabbit IgG was used as a negative IP control. The purified DNA was analyzed by 7500 Fast qPCR system (Product # 4351106) with optimized PCR primer pairs for promoters of the active beta actin and cFOS used as positive control target gene, and the inactive SAT2 satellite repeat used as negative control target gene. Data is presented as fold enrichment of the antibody signal versus the negative control IgG using the comparative CT method.

- Submitted by
- Invitrogen Antibodies (provider)
- Main image

- Experimental details
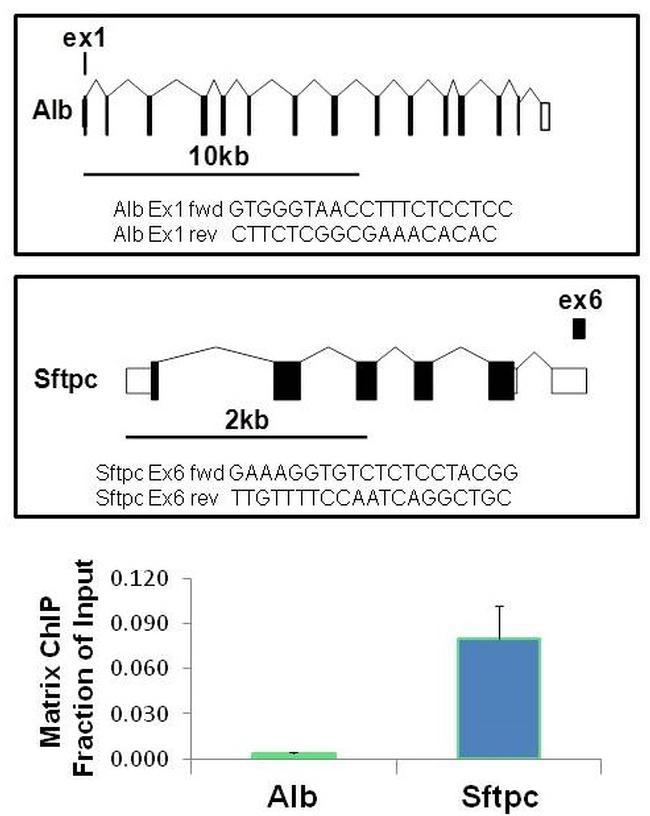
- Multiplex microplate Matrix ChIP has been described in detail (http://www.ncbi.nlm.nih.gov/pubmed/25959381). Briefly, frozen mouse lung tissue fragments (10 to 20mg) were cross-linked with formaldehyde and chromatin was sheared using a Bioruptor. ChIP assays were performed using protein A-coated 96-well polypropylene microplates with 1uL/100uL well volume of H3K27ac monoclonal antibody (Product # 720096). Quantitative real-time PCRs were performed in quadruplicate using 1 to 2uL of DNA with primers to exon 1 of Alb (a gene repressed in the lung) and exon 6 of Sftpc (a gene normally expressed in the lung). PCR calibration curves were generated for each primer pair from a dilution series of total mouse genomic DNA. The PCR primer efficiency curve was fit to cycle threshold (Ct) versus log (genomic DNA concentration) by using an r2 best fit. DNA concentration values for each ChIP and input DNA sample were calculated from their respective average Ct values. Final results are expressed as fraction of input DNA. Schematic representations of the Alb and Sftpc locus are shown above the data where boxes represent exons (black boxes = translated regions, white boxes = untranslated regions), the zigzag line represents an intron, and the straight line represents upstream sequence. Regions amplified by the primers are represented by black bars. Data courtesy of Dr. Bomsztyk’s lab.
Supportive validation
- Submitted by
- Invitrogen Antibodies (provider)
- Main image

- Experimental details
- Antibody specificity for modified targets can be established using peptide arrays by quantifying detection of the target protein along with closely related proteins. Peptide array of Histone H3K27Ac using Anti-Acetyl-Histone H3 (Lys27) Polyclonal Antibody: An array of the specific peptide and other relevant peptides when tested using Anti-Acetyl-Histone H3 (Lys27) Polyclonal Antibody (Product # 720096), showed that the Histone H3K27Ac modification was specifically recognized by the antibody.

- Submitted by
- Invitrogen Antibodies (provider)
- Main image

- Experimental details
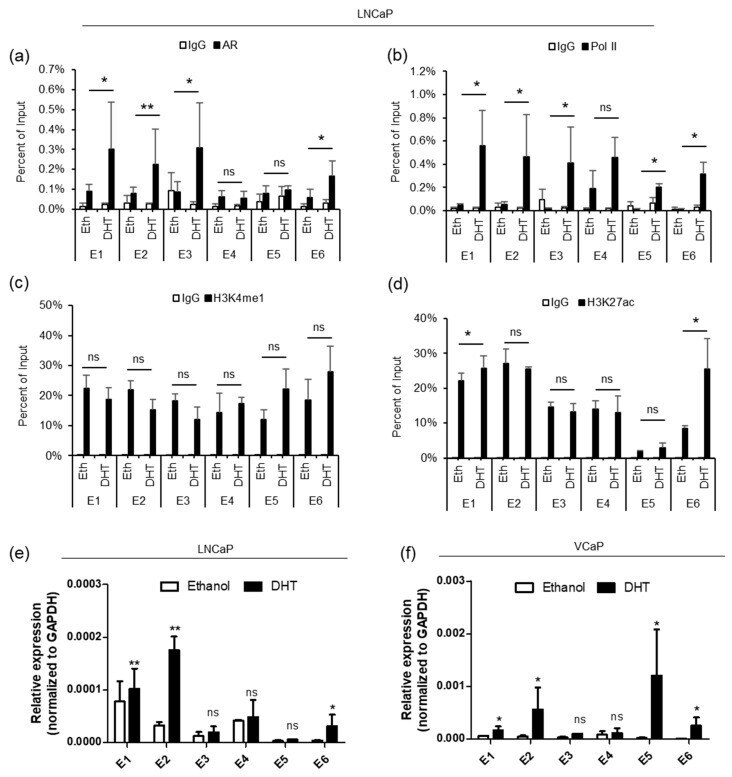
- Figure 2 AR binds to the enhancers, between TMPRSS2 and PRCAT38 , recruiting Pol II and H3K27ac to activate the enhancers. ( a - d ) ChIP-qPCR in LNCaP cells before and after DHT treatment showing AR, RNA polymerase II, H3K4me1 and H3K27ac enrichment over the potential enhancer regions. Data are shown as the mean +- SD (n = 3). * indicates a significant change of the DHT treatment over the vehicle. ( e - f ) eRNA transcription from potential enhancers before and after DHT treatment in LNCaP and VCaP. *: P < 0.05, **: P < 0.01, ns: not significant.
- Submitted by
- Invitrogen Antibodies (provider)
- Main image
- Experimental details
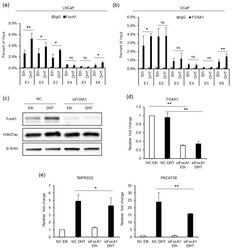
- Figure 5 FOXA1 is recruited by the AR to the enhancers and regulates the transcription of TMPRSS2 and PRCAT38 . ( a , b ) ChIP-qPCR before and after DHT treatment showing FOXA1 enrichment over the enhancer regions in LNCaP and VCaP. ( c ) Western blot showing the protein level of FOXA1 and H3K27ac after FOXA1 knockdown with or without DHT treatment. ( d - e ) qPCR showing the down-regulation of FOXA1 , TMPRSS2 and PRCAT38 after FOXA1 knockdown with or without DHT treatment. Data are shown as mean +- SD (n = 3).

- Submitted by
- Invitrogen Antibodies (provider)
- Main image

- Experimental details
- Figure 6 FOXA1 is required for enhancer activity and chromatin looping between enhancers and promoters of TMPRSS2 and PRCAT38 . ( a , b ) ChIP-qPCR in LNCaP cells before and after FOXA1 knockdown showing FOXA1 and H3K27ac enrichment over the enhancer regions. ( c ) 3C-qPCR analysis of the looping between enhancers and promoters before and after FOXA1 knockdown in LNCaP (peak values of the loops are the mean of 3 biological replicates). ( d ) eRNA transcription from enhancers E1 and E2 before and after FOXA1 knockdown in LNCaP. ( e ) Dual-luciferase reporter assay to determine enhancer activity of E1 and E2 before and after FOXA1 knockdown in LNCaP. Data are shown as the mean +- SD (n = 3); * indicates a significant difference between vehicle and DHT treatment, + indicates significant difference between respective construct and pGL3-promoter. */+: P < 0.05, **/++: P < 0.01, ns: not significant.

- Submitted by
- Invitrogen Antibodies (provider)
- Main image

- Experimental details
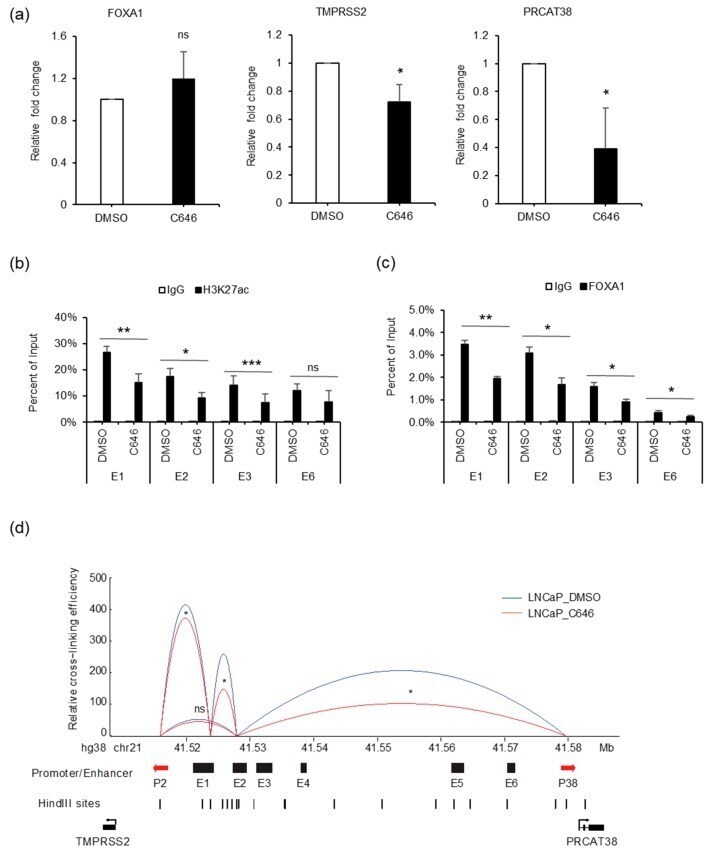
- Figure 7 p300 inhibition impedes FOXA1 binding at the enhancers and chromatin looping between enhancers E1, E2 and the two promoters. ( a ) qPCR showing the change in expression of FOXA1 , TMPRSS2 and PRCAT38 before and after C646 treatment in LNCaP. ( b - c ) ChIP-qPCR in LNCaP cells before and after C646 treatment showing H3K27ac and FOXA1 enrichment over the enhancer regions. Data are shown as the mean +- SD (n = 3). ( d ) 3C-qPCR analysis of the looping between enhancers and promoters before and after C646 treatment in LNCaP (peak values of the loops are the mean of 3 biological replicates). *: P < 0.05, **: P < 0.01, ns: not significant.