Explore
 Validate
 Learn
Learn Western blot
Antibody data
- Antibody Data
- Antigen structure
- References [4]
- Comments [0]
- Validations
- Western blot [3]
- Immunocytochemistry [3]
- Immunohistochemistry [2]
- Flow cytometry [1]
- Other assay [5]
Submit
Validation data
Reference
Comment
Report error
- Product number
- MA5-32705 - Provider product page

- Provider
- Invitrogen Antibodies
- Product name
- MMP9 Recombinant Rabbit Monoclonal Antibody (JA80-73)
- Antibody type
- Monoclonal
- Antigen
- Synthetic peptide
- Reactivity
- Human, Rat
- Host
- Rabbit
- Isotype
- IgG
- Antibody clone number
- JA80-73
- Vial size
- 100 µL
- Concentration
- 1 mg/mL
- Storage
- Store at 4°C short term. For long term storage, store at -20°C, avoiding freeze/thaw cycles.
Submitted references Cerebral Blood Flow Autoregulation in Offspring From Experimentally Preeclamptic Rats and the Effect of Age.
Impact of phospholipase C β1 in glioblastoma: a study on the main mechanisms of tumor aggressiveness.
CircRPPH1 serves as a sponge for miR-296-5p to enhance progression of breast cancer by regulating FOXP4 expression.
Circ-UBAP2 functions as sponges of miR-1205 and miR-382 to promote glioma progression by modulating STC1 expression.
Whitaker EE, Johnson AC, Tremble SM, McGinn C, DeLance N, Cipolla MJ
Frontiers in physiology 2022;13:924908
Frontiers in physiology 2022;13:924908
Impact of phospholipase C β1 in glioblastoma: a study on the main mechanisms of tumor aggressiveness.
Ratti S, Marvi MV, Mongiorgi S, Obeng EO, Rusciano I, Ramazzotti G, Morandi L, Asioli S, Zoli M, Mazzatenta D, Suh PG, Manzoli L, Cocco L
Cellular and molecular life sciences : CMLS 2022 Mar 18;79(4):195
Cellular and molecular life sciences : CMLS 2022 Mar 18;79(4):195
CircRPPH1 serves as a sponge for miR-296-5p to enhance progression of breast cancer by regulating FOXP4 expression.
Yang L, Liu Z, Ma J, Wang H, Gao D, Zhang C, Ma Q
American journal of translational research 2021;13(7):7556-7573
American journal of translational research 2021;13(7):7556-7573
Circ-UBAP2 functions as sponges of miR-1205 and miR-382 to promote glioma progression by modulating STC1 expression.
Wang J, Li T, Wang B
Cancer medicine 2021 Mar;10(5):1815-1828
Cancer medicine 2021 Mar;10(5):1815-1828
No comments: Submit comment
Supportive validation
- Submitted by
- Invitrogen Antibodies (provider)
- Main image
- Experimental details
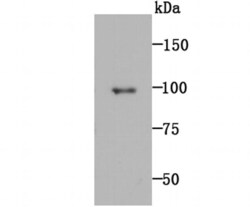
- Western blot analysis of MMP-9 in rat spleen tissue lysate using a MMP-9 Monoclonal antibody (Product # MA5-32705) at a dilution of 1:1,000.

- Submitted by
- Invitrogen Antibodies (provider)
- Main image

- Experimental details
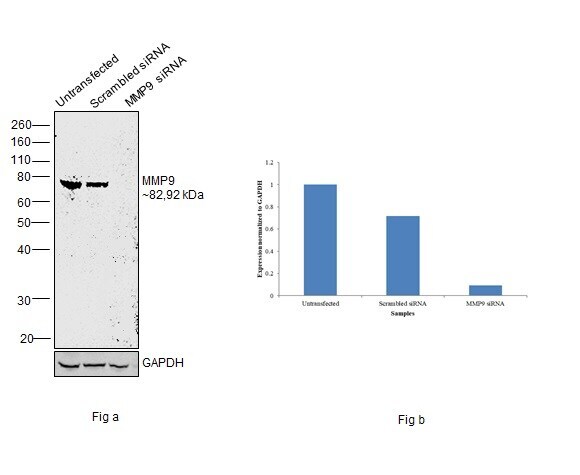
- Knockdown of Matrix metalloproteinase-9 was achieved by transfecting THP-1 with Matrix metalloproteinase-9 specific siRNAs (Silencer® select Product # s8862, s8864). Western blot analysis (Fig. a) was performed using Whole cell extracts from the Matrix metalloproteinase-9 knockdown cells (lane 3), non-targeting scrambled siRNA transfected cells (lane 2) and untransfected cells (lane 1). The blot was probed with MMP9 Recombinant Rabbit Monoclonal Antibody (JA80-73) (Product # MA5-32705, 1:1000 dilution) and Goat anti-Rabbit IgG (H+L) Superclonal™ Recombinant Secondary Antibody, HRP (Product # A27036, 1:4000 dilution). Densitometric analysis of this western blot is shown in histogram (Fig. b). Decrease in signal upon siRNA mediated knock down confirms that antibody is specific to Matrix metalloproteinase-9.
- Submitted by
- Invitrogen Antibodies (provider)
- Main image
- Experimental details
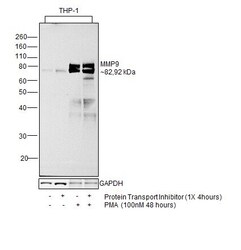
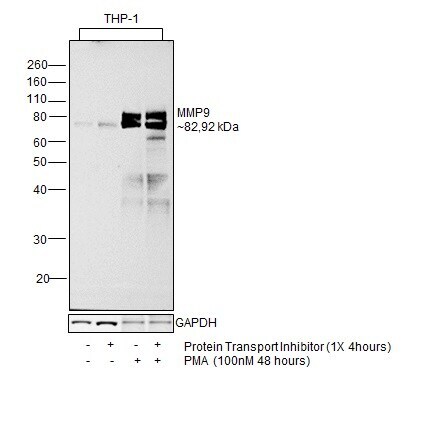
- Western blot was performed using Anti-MMP9 Recombinant Rabbit Monoclonal Antibody (JA80-73) (Product # MA5-32705) and a ~92 kDa band (Pro-form) corresponding to Matrix metalloproteinase-9 was observed THP-1 cells. Also along with it, an ~82 kDa band corresponding to active form of MMP9 was observed upon treatment with PMA (100nM, 48 hours;) and also further upregulated upon treatment with both PMA (100nM, 48 hours) and Protein Transport Inhibitor (PTI) (1X, 4 hours). Whole cell extracts (40 µg lysate) of THP-1 (Lane 1), THP-1 treated with PTI (Lane 2), THP-1 treated with PMA (Lane 3) and THP-1 treated with PMA and PTI (Lane 4) were electrophoresed using NuPAGE™ 4-12% Bis-Tris Protein Gel (Product # NP0322BOX). Resolved proteins were then transferred onto a Nitrocellulose membrane (Product # IB23001) by iBlot® 2 Dry Blotting System (Product # IB21001). The blot was probed with the primary antibody (1:1000 dilution) and detected by chemiluminescence with Goat anti-Rabbit IgG (H+L) Superclonal™ Recombinant Secondary Antibody, HRP (Product # A27036, 1:4000 dilution) using the iBright FL 1000 (Product # A32752). Chemiluminescent detection was performed using SuperSignal™ West Dura Extended Duration Substrate (Product # 34076).
Supportive validation
- Submitted by
- Invitrogen Antibodies (provider)
- Main image
- Experimental details
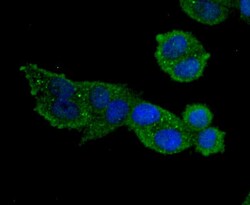
- Immunocytochemical analysis of MMP-9 in Hela cells using a MMP-9 Monoclonal antibody (Product # MA5-32705) as seen in green. The nuclear counter stain is DAPI (blue). Cells were fixed in paraformaldehyde, permeabilised with 0.25% Triton X100/PBS.

- Submitted by
- Invitrogen Antibodies (provider)
- Main image

- Experimental details
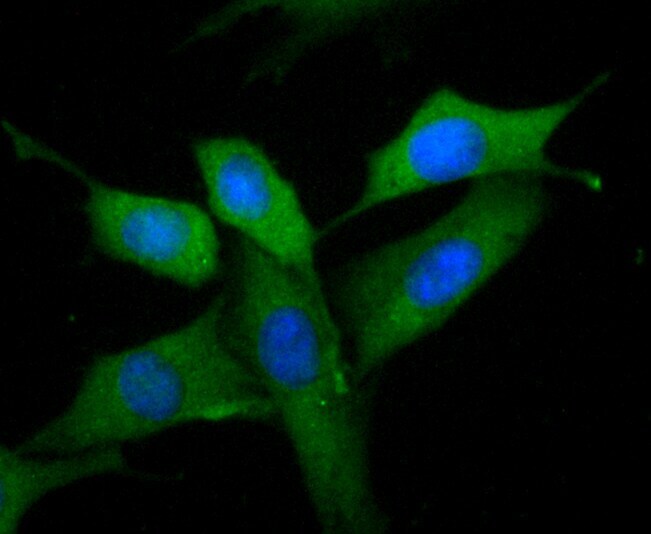
- Immunocytochemical analysis of MMP-9 in SHG-44 cells using a MMP-9 Monoclonal antibody (Product # MA5-32705) as seen in green. The nuclear counter stain is DAPI (blue). Cells were fixed in paraformaldehyde, permeabilised with 0.25% Triton X100/PBS.
- Submitted by
- Invitrogen Antibodies (provider)
- Main image
- Experimental details
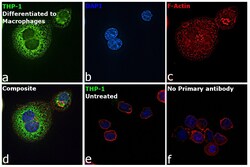
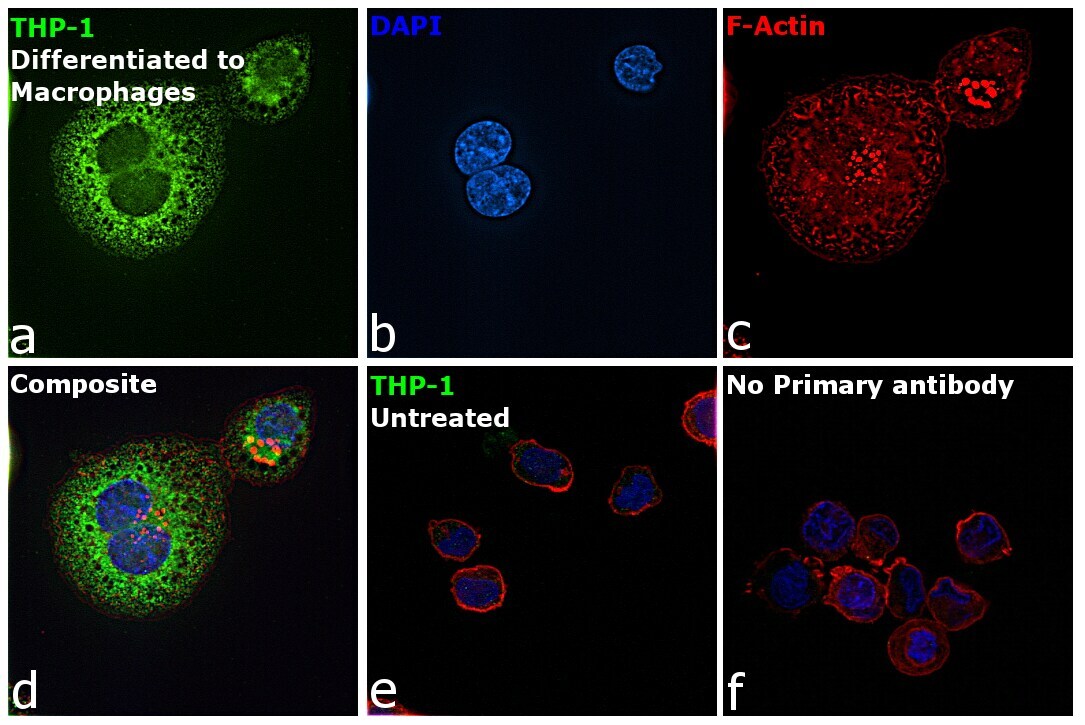
- Immunofluorescence analysis of Matrix metalloproteinase-9 was performed using 70% confluent log phase THP-1 cells differentiated to Macrophages using PMA treatment (100nM, 48 hours). The cells were fixed with 4% paraformaldehyde for 10 minutes, permeabilized with 0.1% Triton™ X-100 for 15 minutes, and blocked with 2% BSA for 45 minutes at room temperature. The cells were labeled with MMP9 Recombinant Rabbit Monoclonal Antibody (JA80-73) (Product # MA5-32705) at 1:100 dilution in 0.1% BSA, incubated at 4 degree celsius overnight and then labeled with Donkey anti-Rabbit IgG (H+L) Highly Cross-Adsorbed Secondary Antibody, Alexa Fluor Plus 488 (Product # A32790), (1:2000 dilution), for 45 minutes at room temperature (Panel a: Green). Nuclei (Panel b: Blue) were stained with ProLong™ Diamond Antifade Mountant with DAPI (Product # P36962). F-actin (Panel c: Red) was stained with Rhodamine Phalloidin (Product # R415, 1:300 dilution). Panel d represents the merged image showing cytoplasmic localization. Panel e represents untreated THP-1 cells. Panel f represents control cells with no primary antibody to assess background. The images were captured at 60X magnification.
Supportive validation
- Submitted by
- Invitrogen Antibodies (provider)
- Main image
- Experimental details
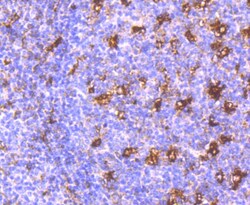
- Immunohistochemical analysis of MMP-9 of paraffin-embedded Human tonsil tissue using a MMP-9 Monoclonal antibody (Product #MA5-32705). Counter stained with hematoxylin.

- Submitted by
- Invitrogen Antibodies (provider)
- Main image
- Experimental details
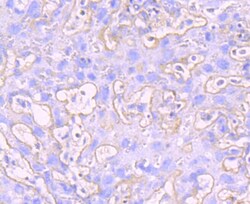
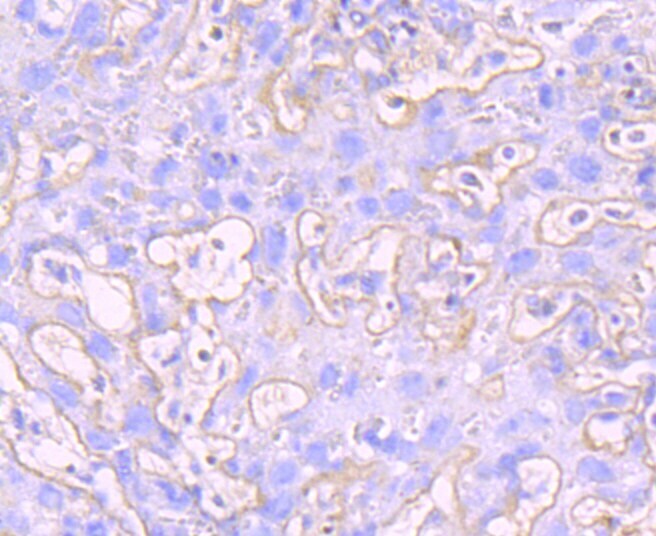
- Immunohistochemical analysis of MMP-9 of paraffin-embedded Mouse placenta tissue using a MMP-9 Monoclonal antibody (Product #MA5-32705). Counter stained with hematoxylin.
Supportive validation
- Submitted by
- Invitrogen Antibodies (provider)
- Main image
- Experimental details
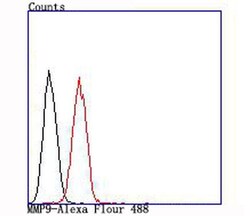
- Flow Cytometric analysis of MMP-9 in A431 cells using a MMP-9 Monoclonal Antibody (Product # MA5-32705) at a dilution of 1:100, as seen in red compared with an unlabelled control (cells without incubation with primary antibody; black).

Supportive validation
- Submitted by
- Invitrogen Antibodies (provider)
- Main image
- Experimental details
- 2 FIGURE Circ-UBAP2 silencing repressed cell proliferation, migration, and invasion, and enhanced apoptosis in vitro. A172 and U251 cells were transfected with si-NC or si-circ-UBAP2. (A) Circ-UBAP2 level was assessed by qRT-PCR. (B) Cell viability was gauged using a CCK-8 assay. (C) Colony formation was evaluated using colony formation assay. (D) Cell apoptosis was detected using flow cytometry. (E, F) Cell migration and invasion were gauged using transwell assay. (G) Cell migration was monitored using wound-healing assay. (H, I) The levels of CyclinD1 and MMP9 by western blot. ** p < 0.01, *** p < 0.001, or **** p < 0.0001

- Submitted by
- Invitrogen Antibodies (provider)
- Main image
- Experimental details
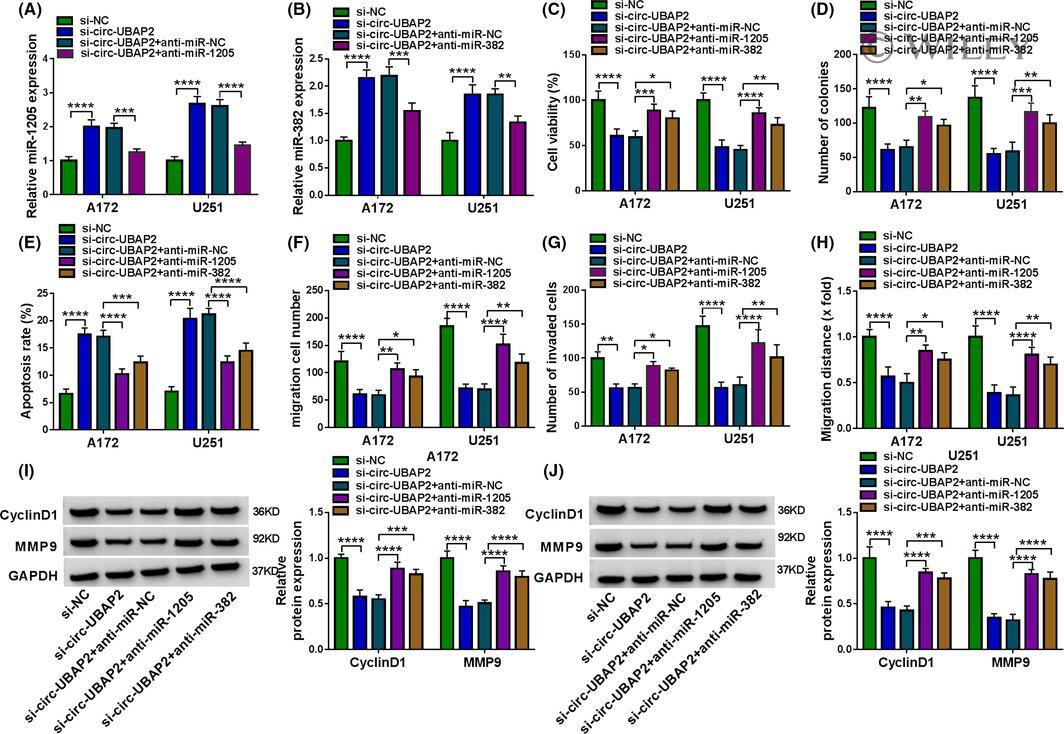
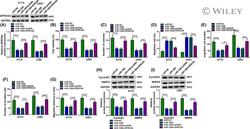
- 4 FIGURE Circ-UBAP2 modulated glioma cell behaviors via targeting miR-1205 or miR-382. A172 and U251 cells were transfected with si-NC, si-circ-UBAP2, si-circ-UBAP2+anti-miR-NC, si-circ-UBAP2+anti-miR-1205, or si-circ-UBAP2+anti-miR-382. (A, B) miR-1205 and miR-382 expression were assessed using qRT-PCR. (C) Cell viability was gauged using CCK-8 assay. (D) Colony formation was evaluated using colony formation assay. (E) Cell apoptosis was detected using flow cytometry. (F, G) Cell migration and invasion were gauged using transwell assay. (H) Cell migration was monitored using wound-healing assay. (I, J) The levels of CyclinD1 and MMP9 by western blot. * p < 0.05, ** p < 0.01, *** p < 0.001 or **** p < 0.0001
- Submitted by
- Invitrogen Antibodies (provider)
- Main image
- Experimental details
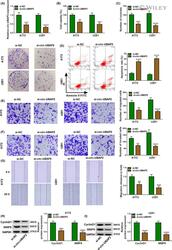
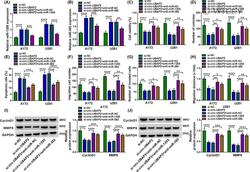
- 6 FIGURE miR-1205 overexpression regulated cell behaviors by downregulating GPRC5A. A172 and U251 cells were transfected with miR-NC mimic, miR-1205 mimic, miR-1205 mimic+pcDNA, or miR-1205 mimic+GPRC5A (GPRC5A overexpressing plasmid). (A) GPRC5A protein expression was assessed using western blot. (B) Cell viability was gauged using CCK-8 assay. (C) Colony formation was evaluated using colony formation assay. (D) Cell apoptosis was detected using flow cytometry. (E, F) Cell migration and invasion were gauged using transwell assay. (G) Cell migration was monitored using wound-healing assay. (H, I) The levels of CyclinD1 and MMP9 by western blot. * p < 0.05, *** p < 0.001, or **** p < 0.0001

- Submitted by
- Invitrogen Antibodies (provider)
- Main image

- Experimental details
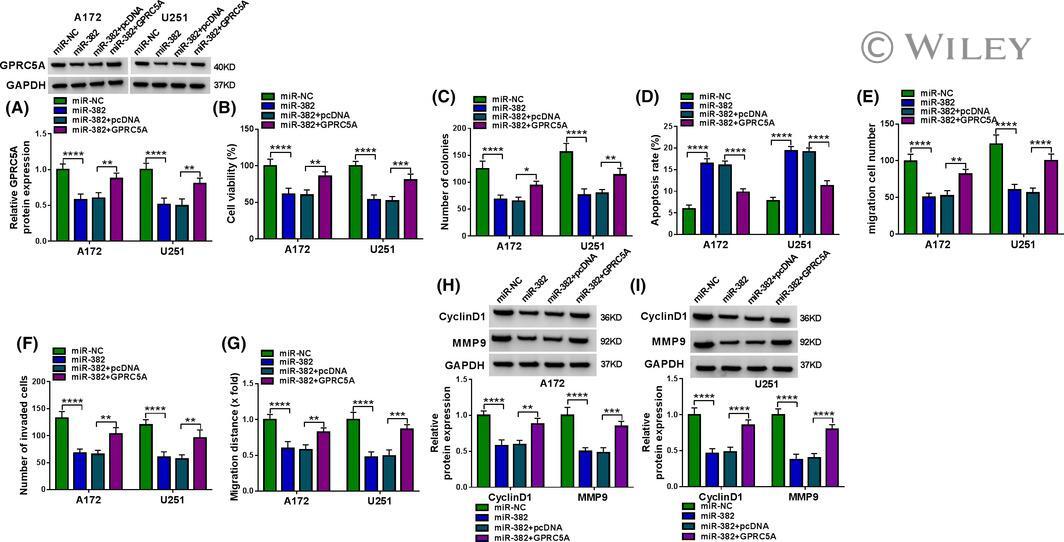
- 7 FIGURE The regulation of miR-382 on cell proliferation, migration, invasion, and apoptosis was mediated by GPRC5A. A172 and U251 cells were transfected with miR-NC mimic, miR-382 mimic, miR-382 mimic+pcDNA, or miR-382 mimic+GPRC5A (GPRC5A overexpressing plasmid). (A) GPRC5A protein expression was assessed using western blot. (B) Cell viability was gauged using CCK-8 assay. (C) Colony formation was evaluated using colony formation assay. (D) Cell apoptosis was detected using flow cytometry. (E, F) Cell migration and invasion were gauged using a transwell assay. (G) Cell migration was monitored using a wound-healing assay. (H, I) The levels of CyclinD1 and MMP9 by western blot. * p < 0.05, ** p < 0.01, *** p < 0.001, or **** p < 0.0001
- Submitted by
- Invitrogen Antibodies (provider)
- Main image

- Experimental details
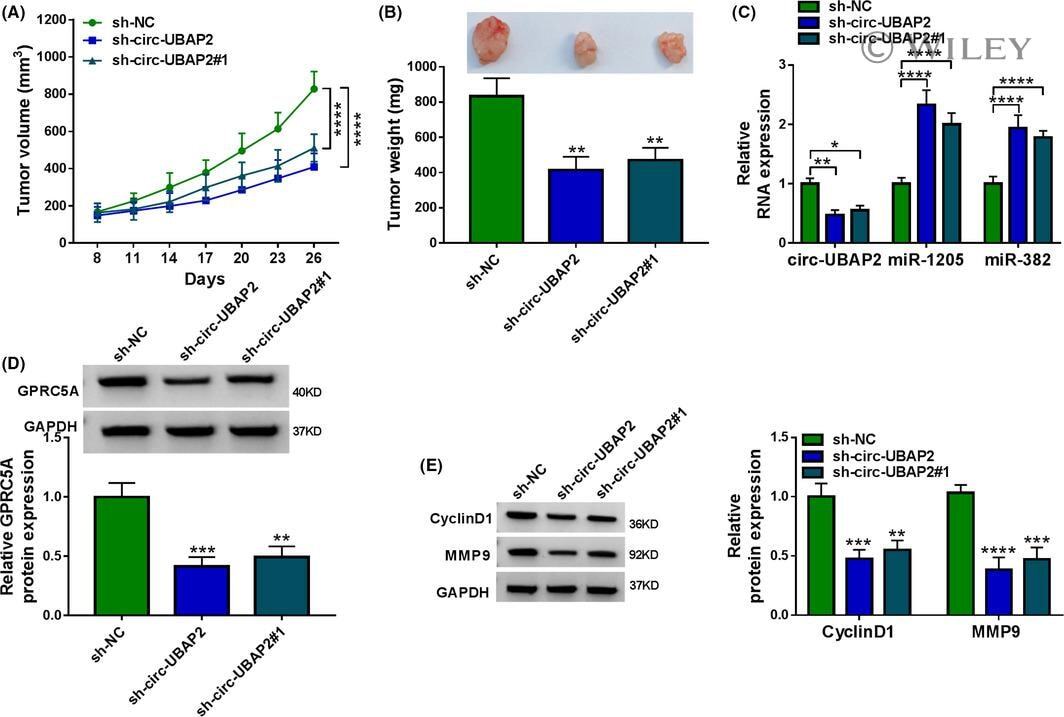
- 9 FIGURE Circ-UBAP2 silencing repressed tumor growth in vivo. sh-circ-UBAP2-, sh-circ-UBAP2#1-transduced, or sh-NC-infected U251 cells were implanted into the nude mice ( n = 6). (A) Growth curves of the xenograft tissues. (B) Representative pictures and average weight of the tumors tissues. The levels of circ-UBAP2, miR-1205, and miR-382 were measured using qRT-PCR (C), and GPRC5A protein expression (D) and CyclinD1 and MMP9 levels (E) by western blot in the excised tumor tissues. * p < 0.05, ** p < 0.01, *** p < 0.001, or **** p < 0.0001