 Explore
 Validate
 Learn
Learn Western blot
 Immunoprecipitation
Antibody data
- Antibody Data
- Antigen structure
- References [2]
- Comments [0]
- Validations
- Western blot [2]
- Immunocytochemistry [1]
- Immunohistochemistry [1]
- Other assay [1]
Submit
Validation data
Reference
Comment
Report error
- Product number
- PA1-31072 - Provider product page

- Provider
- Invitrogen Antibodies
- Product name
- SOD2 Polyclonal Antibody
- Antibody type
- Polyclonal
- Antigen
- Other
- Description
- Rat brain tissue extract was used as a positive control.
- Reactivity
- Human, Mouse, Rat, Bovine, Canine, Hamster, Porcine, Rabbit, Xenopus
- Host
- Rabbit
- Isotype
- IgG
- Vial size
- 50 µg
- Concentration
- 1 mg/mL
- Storage
- Store at 4°C short term. For long term storage, store at -20°C, avoiding freeze/thaw cycles.
Submitted references Effects of BPA, BPS, and BPF on Oxidative Stress and Antioxidant Enzyme Expression in Bovine Oocytes and Spermatozoa.
Inhibition of NFE2L2-Antioxidant Response Element Pathway by Mitochondrial Reactive Oxygen Species Contributes to Development of Cardiomyopathy and Left Ventricular Dysfunction in Chagas Disease.
Nguyen M, Sabry R, Davis OS, Favetta LA
Genes 2022 Jan 14;13(1)
Genes 2022 Jan 14;13(1)
Inhibition of NFE2L2-Antioxidant Response Element Pathway by Mitochondrial Reactive Oxygen Species Contributes to Development of Cardiomyopathy and Left Ventricular Dysfunction in Chagas Disease.
Wen JJ, Porter C, Garg NJ
Antioxidants & redox signaling 2017 Sep 20;27(9):550-566
Antioxidants & redox signaling 2017 Sep 20;27(9):550-566
No comments: Submit comment
Supportive validation
- Submitted by
- Invitrogen Antibodies (provider)
- Main image

- Experimental details
- Western blot analysis of MnSOD using SOD2 Polyclonal Antibody (Product # PA1-31072): Lane 1: MW Marker. Lane 2: HeLa Cell Lysate. Lane 3: Mouse Brain Tissue Extract. Lane 4: Rat Brain Tissue Extract.

- Submitted by
- Invitrogen Antibodies (provider)
- Main image

- Experimental details
- Western blot was performed using Anti-SOD2 Polyclonal Antibody (Product # PA1-31072) and ~20 kDa band corresponding to SOD2 was observed in all cell lines, tissues tested, induced after TNFα treatment in A549 cells and Hydrogen peroxide treatment in HeLa, PC-12 cells. Whole cell extracts (40 µg lysate) of A549 (Lane 1), A549 treated with TNFα (20 ng/mL for 72 hrs) (Lane 2), HeLa (Lane 3) HeLa treated with Hydrogen peroxide (50 µM for 6 hrs) (Lane 4), Hep G2 (Lane 5), PC-12 (Lane 6), PC-12 treated with Hydrogen peroxide (50 µM for 6 hrs) (Lane 7), Mouse brain (Lane 8), Rat brain (Lane 9), Mouse liver (Lane 10) and Rat liver (Lane 11) were electrophoresed using NuPAGE® 4-12% Bis-Tris gel (Product # NP0322BOX). Resolved proteins were then transferred onto a nitrocellulose membrane (Product # IB23001) by iBlot® 2 Dry Blotting System (Product # IB21001).The blot was probed with the primary antibody (1:1,000) and detected by chemiluminescence using Goat anti-Rabbit IgG (H+L), Superclonal™ Recombinant Secondary Antibody, HRP (Product # A27036, 1:4,000 dilution) using the iBright FL 1000 (Product # A32752). Chemiluminescent detection was performed using Novex® ECL Chemiluminescent Substrate Reagent Kit (Product # WP20005).

Supportive validation
- Submitted by
- Invitrogen Antibodies (provider)
- Main image

- Experimental details
- Immunofluorescence analysis of SOD2 was performed using 70% confluent log phase A549 cells treated with TNF alpha (20 ng/mL for 72h). The cells were fixed with 4% paraformaldehyde for 10 minutes, permeabilized with 0.1% Triton™ X-100 for 15 minutes, and blocked with 2% BSA for 1 hour at room temperature. The cells were labeled with SOD2 Polyclonal Antibody (Product # PA1-31072) at 1:100 dilution in 0.1% BSA, incubated at 4 degree Celsius overnight and then labeled with Goat anti-Rabbit IgG (H+L) Superclonal™ Recombinant Secondary Antibody, Alexa Fluor® 488 conjugate (Product # A27034) at a dilution of 1:2000 for 45 minutes at room temperature (Panel a: green). Nuclei (Panel b: blue) were stained with SlowFade® Gold Antifade Mountant with DAPI (Product # S36938). F-actin (Panel c: red) was stained with Rhodamine Phalloidin (Product # R415, 1:300). Panel d represents the merged image showing increased SOD2 expression and localization to the mitochondria. Panel e shows untreated cells with lower expression of SOD2. Panel f represents control cells with no primary antibody to assess background. The images were captured at 60X magnification.

Supportive validation
- Submitted by
- Invitrogen Antibodies (provider)
- Main image
- Experimental details
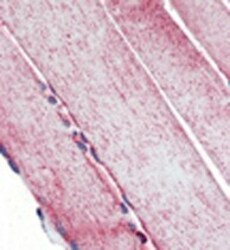
- Immunohistochemistry analysis of human skeletal muscle tissue stained with SOD2 Polyclonal Antibody (Product # PA1-31072) at 10 µg/mL.

Supportive validation
- Submitted by
- Invitrogen Antibodies (provider)
- Main image
- Experimental details
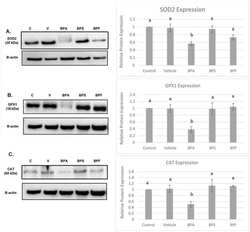
- Figure 9 Western blot of SOD2 ( A ), GPX1 ( B ), CAT ( C ) protein expression in bovine COCs. For each antioxidant enzyme, a representative blot is seen on the left and densitometric analysis relative to the loading control, beta-actin, is seen on the right. Western blot data represents 4 biological replicates. Different letters indicate significant differences: b denotes statistical significant difference versus a ( p < 0.05). Error bars represent +-SEM.
