 Explore
 Validate
 Learn
Learn Flow cytometry
Antibody data
- Antibody Data
- Antigen structure
- References [12]
- Comments [0]
- Validations
- Flow cytometry [1]
- Other assay [13]
Submit
Validation data
Reference
Comment
Report error
- Product number
- 67-0149-42 - Provider product page

- Provider
- Invitrogen Antibodies
- Product name
- CD14 Monoclonal Antibody (61D3), Super Bright™ 702, eBioscience™
- Antibody type
- Monoclonal
- Antigen
- Other
- Description
- Description: The 61D3 monoclonal antibody reacts with human CD14, a 53-55 kDa GPI-linked glycoprotein. CD14 is expressed on monocytes, interfollicular macrophages and some dendritic cells. Complexes of LPS and LBP (LPS-Binding Protein) bind with high affinity to monocytes through the surface CD14. Applications Reported: The 61D3 antibody has been reported for use in flow cytometric analysis. Applications Tested: This 61D3 antibody has been pre-titrated and tested by flow cytometric analysis of normal human peripheral blood cells. This can be used at 5 µL (0.25 µg) per test. A test is defined as the amount (µg) of antibody that will stain a cell sample in a final volume of 100 µL. Cell number should be determined empirically but can range from 10^5 to 10^8 cells/test. Super Bright 702 is a tandem dye that can be excited with the violet laser line (405 nm) and emits at 702 nm. We recommend using a 710/50 bandpass filter. Please make sure that your instrument is capable of detecting this fluorochrome. When using two or more Super Bright dye-conjugated antibodies in a staining panel, it is recommended to use Super Bright Staining Buffer ((Product # SB-4400)) to minimize any non-specific polymer interactions. Please refer to the datasheet for Super Bright Staining Buffer. Light sensitivity: This tandem dye is sensitive to photo-induced oxidation. Protect this vial and stained samples from light. Fixation: Samples can be stored in IC Fixation Buffer (Product # 00-8222) (100 µL of cell sample + 100 µL of IC Fixation Buffer) or 1-step Fix/Lyse Solution (Product # 00-5333) for up to 3 days in the dark at 4°C with minimal impact on brightness and FRET efficiency/compensation. Some generalizations regarding fluorophore performance after fixation can be made, but clone specific performance should be determined empirically. Excitation: 405 nm; Emission: 702 nm; Laser: Violet Laser Super Bright Polymer Dyes are sold under license from Becton, Dickinson and Company.
- Reactivity
- Human
- Host
- Mouse
- Isotype
- IgG
- Antibody clone number
- 61D3
- Vial size
- 100 Tests
- Concentration
- 5 µL/Test
- Storage
- 4° C, store in dark, DO NOT FREEZE!
Submitted references Early macrophage response to obesity encompasses Interferon Regulatory Factor 5 regulated mitochondrial architecture remodelling.
Exposure of a specific pleioform of multifunctional glyceraldehyde 3-phosphate dehydrogenase initiates CD14-dependent clearance of apoptotic cells.
SARS-CoV-2 infection paralyzes cytotoxic and metabolic functions of the immune cells.
Differentiation Potential of Early- and Late-Passage Adipose-Derived Mesenchymal Stem Cells Cultured under Hypoxia and Normoxia.
MiR-103 protects from recurrent spontaneous abortion via inhibiting STAT1 mediated M1 macrophage polarization.
Chemerin enhances the adhesion and migration of human endothelial progenitor cells and increases lipid accumulation in mice with atherosclerosis.
The long non-coding RNA Cancer Susceptibility 15 (CASC15) is induced by isocitrate dehydrogenase (IDH) mutations and maintains an immature phenotype in adult acute myeloid leukemia.
A functional antibody cross-reactive to both human and murine cytotoxic T-lymphocyte-associated protein 4 via binding to an N-glycosylation epitope.
Patient iPSC-Derived Macrophages to Study Inborn Errors of the IFN-γ Responsive Pathway.
Gene expression network analyses during infection with virulent and avirulent Trypanosoma cruzi strains unveil a role for fibroblasts in neutrophil recruitment and activation.
Thrombomodulin regulates monocye differentiation via PKCδ and ERK1/2 pathway in vitro and in atherosclerotic artery.
Biologically active polymers from spontaneous carotenoid oxidation: a new frontier in carotenoid activity.
Orliaguet L, Ejlalmanesh T, Humbert A, Ballaire R, Diedisheim M, Julla JB, Chokr D, Cuenco J, Michieletto J, Charbit J, Lindén D, Boucher J, Potier C, Hamimi A, Lemoine S, Blugeon C, Legoix P, Lameiras S, Baudrin LG, Baulande S, Soprani A, Castelli FA, Fenaille F, Riveline JP, Dalmas E, Rieusset J, Gautier JF, Venteclef N, Alzaid F
Nature communications 2022 Aug 30;13(1):5089
Nature communications 2022 Aug 30;13(1):5089
Exposure of a specific pleioform of multifunctional glyceraldehyde 3-phosphate dehydrogenase initiates CD14-dependent clearance of apoptotic cells.
Chaudhary S, Patidar A, Dhiman A, Chaubey GK, Dilawari R, Talukdar S, Modanwal R, Raje M
Cell death & disease 2021 Sep 30;12(10):892
Cell death & disease 2021 Sep 30;12(10):892
SARS-CoV-2 infection paralyzes cytotoxic and metabolic functions of the immune cells.
Singh Y, Trautwein C, Fendel R, Krickeberg N, Berezhnoy G, Bissinger R, Ossowski S, Salker MS, Casadei N, Riess O, Deutsche COVID-19 OMICS Initiate (DeCOI)
Heliyon 2021 Jun;7(6):e07147
Heliyon 2021 Jun;7(6):e07147
Differentiation Potential of Early- and Late-Passage Adipose-Derived Mesenchymal Stem Cells Cultured under Hypoxia and Normoxia.
Zhao AG, Shah K, Freitag J, Cromer B, Sumer H
Stem cells international 2020;2020:8898221
Stem cells international 2020;2020:8898221
MiR-103 protects from recurrent spontaneous abortion via inhibiting STAT1 mediated M1 macrophage polarization.
Zhu X, Liu H, Zhang Z, Wei R, Zhou X, Wang Z, Zhao L, Guo Q, Zhang Y, Chu C, Wang L, Li X
International journal of biological sciences 2020;16(12):2248-2264
International journal of biological sciences 2020;16(12):2248-2264
Chemerin enhances the adhesion and migration of human endothelial progenitor cells and increases lipid accumulation in mice with atherosclerosis.
Jia J, Yu F, Xiong Y, Wei W, Ma H, Nisi F, Song X, Yang L, Wang D, Yuan G, Zhou H
Lipids in health and disease 2020 Sep 20;19(1):207
Lipids in health and disease 2020 Sep 20;19(1):207
The long non-coding RNA Cancer Susceptibility 15 (CASC15) is induced by isocitrate dehydrogenase (IDH) mutations and maintains an immature phenotype in adult acute myeloid leukemia.
Grasedieck S, Ruess C, Krowiorz K, Lux S, Pochert N, Schwarzer A, Klusmann JH, Jongen-Lavrencic M, Herold T, Bullinger L, Pollack JR, Rouhi A, Kuchenbauer F
Haematologica 2020 Sep 1;105(9):e448-453
Haematologica 2020 Sep 1;105(9):e448-453
A functional antibody cross-reactive to both human and murine cytotoxic T-lymphocyte-associated protein 4 via binding to an N-glycosylation epitope.
Li D, Li J, Chu H, Wang Z
mAbs 2020 Jan-Dec;12(1):1725365
mAbs 2020 Jan-Dec;12(1):1725365
Patient iPSC-Derived Macrophages to Study Inborn Errors of the IFN-γ Responsive Pathway.
Haake K, Neehus AL, Buchegger T, Kühnel MP, Blank P, Philipp F, Oleaga-Quintas C, Schulz A, Grimley M, Goethe R, Jonigk D, Kalinke U, Boisson-Dupuis S, Casanova JL, Bustamante J, Lachmann N
Cells 2020 Feb 19;9(2)
Cells 2020 Feb 19;9(2)
Gene expression network analyses during infection with virulent and avirulent Trypanosoma cruzi strains unveil a role for fibroblasts in neutrophil recruitment and activation.
Oliveira AER, Pereira MCA, Belew AT, Ferreira LRP, Pereira LMN, Neves EGA, Nunes MDCP, Burleigh BA, Dutra WO, El-Sayed NM, Gazzinelli RT, Teixeira SMR
PLoS pathogens 2020 Aug;16(8):e1008781
PLoS pathogens 2020 Aug;16(8):e1008781
Thrombomodulin regulates monocye differentiation via PKCδ and ERK1/2 pathway in vitro and in atherosclerotic artery.
Tsai CS, Lin YW, Huang CY, Shih CM, Tsai YT, Tsao NW, Lin CS, Shih CC, Jeng H, Lin FY
Scientific reports 2016 Dec 2;6:38421
Scientific reports 2016 Dec 2;6:38421
Biologically active polymers from spontaneous carotenoid oxidation: a new frontier in carotenoid activity.
Johnston JB, Nickerson JG, Daroszewski J, Mogg TJ, Burton GW
PloS one 2014;9(10):e111346
PloS one 2014;9(10):e111346
No comments: Submit comment
Supportive validation
- Submitted by
- Invitrogen Antibodies (provider)
- Main image
- Experimental details
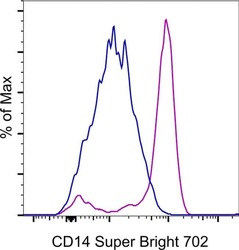
- Staining of normal human peripheral blood cells with Mouse IgG1 K Super Bright 702 (Product # 67-4714-82) (blue histogram) or Anti-Human CD14 Super Bright 702 (purple histogram). Cells in the monocyte gate were used for analysis.

Supportive validation
- Submitted by
- Invitrogen Antibodies (provider)
- Main image

- Experimental details
- NULL

- Submitted by
- Invitrogen Antibodies (provider)
- Main image

- Experimental details
- Figure 2 CD14 and TLR-4 staining in gut epithelial cells. Balb/c mice were not supplemented (control) or supplemented daily by oral gavage with OxC-beta (10 mg/kg). After 4 weeks, intestinal tissues were harvested and CD14 and TLR-4 expression was determined by immunocytochemistry. Increased CD14 (A) and TLR-4 (C) expression is readily apparent in epithelial cells in the OxC-beta-supplemented animals compared to the controls receiving vehicle alone (B and D, respectively). Arrows indicate the location of enterocytes within the cross section of microvilli. Magnification 40x.

- Submitted by
- Invitrogen Antibodies (provider)
- Main image

- Experimental details
- Figure 1 PMA-induced TM expression mediates morphological changes and differentiation marker expression in THP-1 cells. ( A ) THP-1 cells were treated with 150 nM PMA for 24-72 hours. The total cell lysates were harvested, and the expression of TM was analyzed using western blot analysis. beta-actin was used as a loading control. Five independent experiments have been performed (n = 5) and representative images have been showed. The amount of proteins expression was quantified using densitometry and presented as bar graph. The data are presented as the mean +- SD (n = 5), and * p < 0.05 was considered significant. ( B ) THP-1 cells were transfected with TM siRNA or HA-TM FL plasmid for 24 h followed by PMA stimulation for 72 hours. The morphology of the cells was observed using light microscopy. The adherent differentiated macrophage-like cells are indicated by a white arrowhead. Five independent experiments have been performed (n = 5). The quantification is shown in the right graph. ( C ) The expression of the macrophage cell surface markers CD14 (red) and CD68 (green) was analyzed using immunofluorescence and microscopy. Hoechst staining was used to label the nuclei. The scale bar indicates 100 mum. Five independent experiments have been performed (n = 5), and showed representative images. ( D ) The expression of CD14 and CD68 was analyzed using flow cytometry. Data are expressed as a % of the control, are presented as the mean +- SD and represent the results of three indep

- Submitted by
- Invitrogen Antibodies (provider)
- Main image

- Experimental details
- Figure 1 M1 macrophage and STAT1 were excessive in RSA patients. ( A-B ) The dot plot represents labeling of CD14 + CD86 + and CD14 + TNFalpha + (M1) cells by flow cytometry in decidua of NP subjects (n= 30) and RSA patients (n= 30). ( C ) qRT-PCR analysis of STAT1 expression in the decidua of NP subjects (n= 30) and RSA patients (n= 30). ( D ) STAT1 and p-STAT1 protein levels were measured in decidua of NP subjects (n= 10) and RSA patients (n= 10) by western blot. ( E ) Representative IHC staining images of STAT1 in the decidua of NP and RSA patients (Scale bar, 50 um, 200x). ( F ) Correlation between p-STAT1 and the proportion of CD14 + CD86 + in decidua of NP subjects (n= 10) and RSA patients (n= 10). ( G ) Correlation between p-STAT1 and the proportion of CD14 + TNF-alpha + in decidua of NP subjects (n= 10) and RSA patients (n= 10). Values were listed as the mean+- SEM. **** P < 0.0001.

- Submitted by
- Invitrogen Antibodies (provider)
- Main image

- Experimental details
- Fig. 1 Identification of EPCs. a Adherent cells grew in a blood island manner. Fluorescent staining of EPCs. b Adherent cells took up UEA-1-lectin. c Adherent cells took up Dil-Ac-LDL. d Adherent cells took up UEA-1-lectin and Dil-Ac-LDL. E. Surface molecular markers of EPCs. Adherent cells expressed CD34, CD133, CD14 and VEGFR-2. All experiments involving cell culture studies were repeated three times with three replicates per experiment

- Submitted by
- Invitrogen Antibodies (provider)
- Main image

- Experimental details
- 10.1080/19420862.2020.1725365-F0003 Figure 3. Antibody-dependent cellular cytotoxicity (ADCC) (a) and antibody-dependent cellular phagocytosis (ADCP) (b) of the antibodies against CTLA-4. (a) Human CTLA4-expressing 293F cells were added to 96-well plates at 1 x 10 4 cells/well, and then the antibodies pre-incubated with 5 x 10 5 PBMCs were added. The plates were kept at 37degC in a 5% CO 2 incubator for 4 h. Lysis of the target cells was determined by the introduction of DELFIA(r) EuTDA Cytotoxicity Reagents. (b) Human macrophage cells were mixed at 1:1 ratio with CFSE-dyed engineered human CTLA-4 expressing 293F cells in 96-well plates, then antibodies were added and incubated with cells at 37degC in a 5% CO 2 incubator for 3 h. After wash, APC-labeled anti-human CD14 antibody was added for flow cytometry detection.

- Submitted by
- Invitrogen Antibodies (provider)
- Main image

- Experimental details
- Figure 2 Comparison of monocytes and NK cell percentage amongst study groups. A. The stained PBMCs were gated on the monocyte population and CD3 + CD19 + cells were excluded. Cell populations are displayed for CD16 and CD14 expression (upper FACS panel). One exemplary dot plot is shown per study group. The bar diagrams (lower panel) show the non-classical (CD16 + CD14 - ), intermediate (CD16 + CD14 + ) and classical (CD16 - CD14 + ) monocytes. *P-value

- Submitted by
- Invitrogen Antibodies (provider)
- Main image

- Experimental details
- Fig. 4 GAPDH exposed on apoptotic cells and phagocyte CD14 mediate efferocytosis. A Co-localization of apoptotic cell surface GAPDH with CD14 on phagocyte. When cells were incubated together the two signals co-localize at points of intercellular contact. Scale bar, 5 mum. B Co-immunoprecipitation (Co-IP) of GAPDH from mixed membrane fractions of apoptotic cells (J774) and phagocytes (THP-1). Right side panels are Western blots of membrane fractions as positive control for both antibodies. C Western blot to confirm the CD14 K/D in THP-1 cells. Cell lysates were prepared from THP-1 empty vector and CD14 knockdown cells and samples were run on 10% SDS-PAGE. Separated proteins were transblotted onto PVDF membrane and probed with mouse anti-CD14 antibody (Abcam) followed by secondary antibody anti-mouse peroxidase (Sigma). D - E Phagocytosis of apoptotic cells is dependent upon both GAPDH on apoptotic cell surface and CD14 on phagocytes. D Representative confocal microscopy images of live and apoptotic J774 cells that were phagocytosed by THP-1 phagocytes. Live cells, apoptotic empty vector, and GAPDH K/D J774 cells are labeled with Vybrant DiD dye (Red). Phagocyte THP-1 cells, empty vector, and CD14 K/D cells are labeled with CFSE (Green). Scale bar, 20 mum. E Bar graph represents phagocytosis as percentage of control (extent of phagocytosis by THP-1 empty vector cells incubated with J774 empty vector cells as 100%), *** P < 0.0001, n = 150 cells, also see Fig. S2C-D . F Disrupti

- Submitted by
- Invitrogen Antibodies (provider)
- Main image

- Experimental details
- Fig. 7 IRF5 binds to GHITM and regulates mitochondrial activity in human monocytes and adipose tissue macrophages. a CD14 + Monocytes from patients with type-2 diabetes (T2D; n = 5) were sorted based on expression of IRF5 for RNA-seq. Differential analyses were paired by patient and carried out on IRF5 + versus IRF5 - monocytes ( n = 5, Wald test p -value < 0.05). b Gene ontology (GO) term enrichment from upregulated and downregulated genes in IRF5 + versus IRF5 - monocytes. c Expression of Ghitm in IRF5 - and IRF5 + monocytes ( n = 5, * p = 0.039, two-tailed paired t -test). d Irf5 and Ghitm counts in white adipose tissue (WAT) macrophages and monocytes, from public dataset of scRNA-seq of the stromal vascular fraction (SVF) of patients that are lean or with obesity (two-tailed unpaired t -test, **** p < 0.0001). Heatmap of single-cell expression of Irf5 and Ghitm from monocytes (Mon) and macrophages (Mac), each line represents a single cell. e Proportion of Ghitm + (blue) and Ghitm- (red) cells in 10-cell bins by increasing Irf5 expression. f Correlation of Ghitm and Irf5 mean expression per bin (Pearson's correlation Pearson R 2 = 0.28, two-tailed p < 0.0001). g Ghitm expression in CD14 + human visceral adipose tissue macrophages (vATMs). Samples were stratified based on expression of Irf5 into IRF5 Lo versus IRF5 Hi expressors (IRF5 Lo n = 7 and IRF5 Hi n = 6, two-tailed unpaired t -test, p = 0.13). h Correlation of IRF5 MFI, JC1-Green (mitochondrial mass, Mt Mass), JC1-R

- Submitted by
- Invitrogen Antibodies (provider)
- Main image

- Experimental details
- Figure 3 Generation of patient specific iPSC-derived macrophages. Patient iPSCs have been differentiated into macrophages and compared to macrophages from a healthy iPSC line (hCD34_iPSC16). ( A ) Microscopic analysis of patient iPSCs in cytospin images after Pappenheim staining (left, scale bar = 20 um) or in brightfield images (middle scale bar 200 um, right scale bar = 100 um). ( B ) Representative flow cytometric analysis of CD11b, CD14, CD163 and CD45 expression on patient iPSCs and healthy macrophages of two independent experiments. Blue: Isotype. Pink: Surface marker. FC = fold change of the median fluorescent intensity. ( C ) Flow cytometric analysis of IFN-gammaR1 (top) and IFN-gammaR2 (bottom) expression on healthy and patient iPSC-derived macrophages. Blue: Isotype. Pink: Surface marker. Expression has been quantified by plotting the difference of the median fluorescent intensity (DeltaMFI). Each dot represents macrophages from an independent harvest and from at least three independent differentiations ( n = 4-7, mean +- SD, Kruskal-Wallis with Dunn''s multiple comparison). Red line shows DeltaMFI of 0. ( D ) GM-CSF clearance of healthy and patient iPSC-derived macrophages over a time of 48 h. Concentrations have been normalized to control well containing no cells (media only) ( n = 3, mean +- SD; each dot represents macrophages from an independent harvest and from at least three independent differentiations). ( E ) Representative flow cytometric (top) and microsco

- Submitted by
- Invitrogen Antibodies (provider)
- Main image

- Experimental details
- Figure 1. CASC15 -KO promotes the differentiation of acute myeloid leukemia cells. (A) Apoptosis in CASC15 -KO and empty vector-transduced (control) OCI-AML5 cell lines after 24 h of depletion of granulocyte-macrophage colony-stimulating factor (annexin-FITC/Sytox blue flow cytometry). (B) Expression of SOX4 during in vitro differentiation of CASC15 -KO and control OCI-AML5 cell lines. All cells were treated with 0.1 mM all- trans retinoic acid (ATRA) and 1 nM 12-O-tetradecanoylphorbol-13-acetate (TPA) over 72 h in three independent experiments. Total RNA was extracted before, after 24 h and after 72 h of treatment, DNase-digested and transcribed to cDNA. A quantitative real-time polymerase chain reaction (qRT-PCR) was performed using SYBR green chemistry with subsequent melting curve analysis in technical triplicates. The 2-ddCt was calculated relative to the pre-determined housekeeping gene encoding succinate dehydrogenase complex subunit C ( SDHC ). (C) Baseline expression of the monocyte/macrophage markers CD11b (integrin subunit alpha M, ITGAM), CD11c (integrin subunit alpha X, ITGAX), and CD14, the granulocyte marker CD15 (fucosyltransferase 4, FUT4), and the general myeloid marker CD13 (aminopeptidase N, APN) in CASC15 -KO and control cells. The percentages of positive cells, quantified by flow cytometry after 72 h, are shown. (D-F) Growth rate and CD11c myeloid cell surface marker expression of CASC15 and control cell lines during drug-induced in vitro differentiation

- Submitted by
- Invitrogen Antibodies (provider)
- Main image

- Experimental details
- Fig 6 Human neutrophils incubated with supernatants from T . cruzi -infected HFF cells have enhanced expression of CD11b. Flow cytometry analysis of live neutrophils (CD16 + CD66b + CD14 - HLA-DR - ) incubated for 16 hours with media only (A), supernatants from uninfected HFF cells (B), or supernatants of HFF cells infected for 4 days with T . cruzi CL-14 (C) or CL Brener (D). Percentage of cells expressing high levels of the activation marker CD11b (E) and mean fluorescent intensity (MFI) of CD11b (F). * p < 0.05, ** p < 0.01 (one-way ANOVA with Tukey''s post-test comparing the indicated treatments). (A-D) Images are representative of three independent experiments. (E-F) Data from three independent experiments (mean and s.e.m. ).

- Submitted by
- Invitrogen Antibodies (provider)
- Main image
- Experimental details
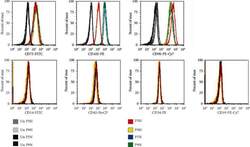
- Figure 2 Flow cytometry of CD cell surface markers for cells cultured under hypoxia and normoxia. The positive CD markers for MSCs as detected by the fluorescent antibodies anti-CD73 FITC, anti-CD105 PE, and anti-CD90 PE Cy7. The negative markers of MSCs were detected using anti-CD14 FITC, anti-CD45 PerCP, anti-CD34-R-PE, and anti-CD19 PE-Cy7 antibodies. Unstained cell for each condition was used as negative controls.
