 Explore
 Validate
 Learn
Learn Western blot
 Other assay
Antibody data
- Antibody Data
- Antigen structure
- References [4]
- Comments [0]
- Validations
- Other assay [8]
Submit
Validation data
Reference
Comment
Report error
- Product number
- 35-9700 - Provider product page

- Provider
- Invitrogen Antibodies
- Product name
- Nkx3.1 Monoclonal Antibody (3 9)
- Antibody type
- Monoclonal
- Antigen
- Other
- Reactivity
- Human, Mouse
- Host
- Mouse
- Isotype
- IgG
- Antibody clone number
- 3 9
- Vial size
- 100 μg
- Concentration
- 0.5 mg/mL
- Storage
- -20°C
Submitted references Systems analysis of the prostate tumor suppressor NKX3.1 supports roles in DNA repair and luminal cell differentiation.
A three-protein biomarker panel assessed in diagnostic tissue predicts death from prostate cancer for men with localized disease.
TWIST1, A novel androgen-regulated gene, is a target for NKX3-1 in prostate cancer cells.
NKX3.1 homeodomain protein binds to topoisomerase I and enhances its activity.
Yang CC, Chung A, Ku CY, Brill LM, Williams R, Wolf DA
F1000Research 2014;3:115
F1000Research 2014;3:115
A three-protein biomarker panel assessed in diagnostic tissue predicts death from prostate cancer for men with localized disease.
Severi G, FitzGerald LM, Muller DC, Pedersen J, Longano A, Southey MC, Hopper JL, English DR, Giles GG, Mills J
Cancer medicine 2014 Oct;3(5):1266-74
Cancer medicine 2014 Oct;3(5):1266-74
TWIST1, A novel androgen-regulated gene, is a target for NKX3-1 in prostate cancer cells.
Eide T, Ramberg H, Glackin C, Tindall D, Taskén KA
Cancer cell international 2013 Jan 31;13(1):4
Cancer cell international 2013 Jan 31;13(1):4
NKX3.1 homeodomain protein binds to topoisomerase I and enhances its activity.
Bowen C, Stuart A, Ju JH, Tuan J, Blonder J, Conrads TP, Veenstra TD, Gelmann EP
Cancer research 2007 Jan 15;67(2):455-64
Cancer research 2007 Jan 15;67(2):455-64
No comments: Submit comment
Supportive validation
- Submitted by
- Invitrogen Antibodies (provider)
- Main image
- Experimental details
- figure s7. uncropped immunoblots for figure 2 .

- Submitted by
- Invitrogen Antibodies (provider)
- Main image
- Experimental details
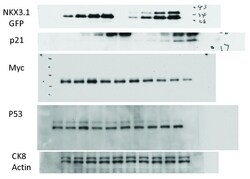
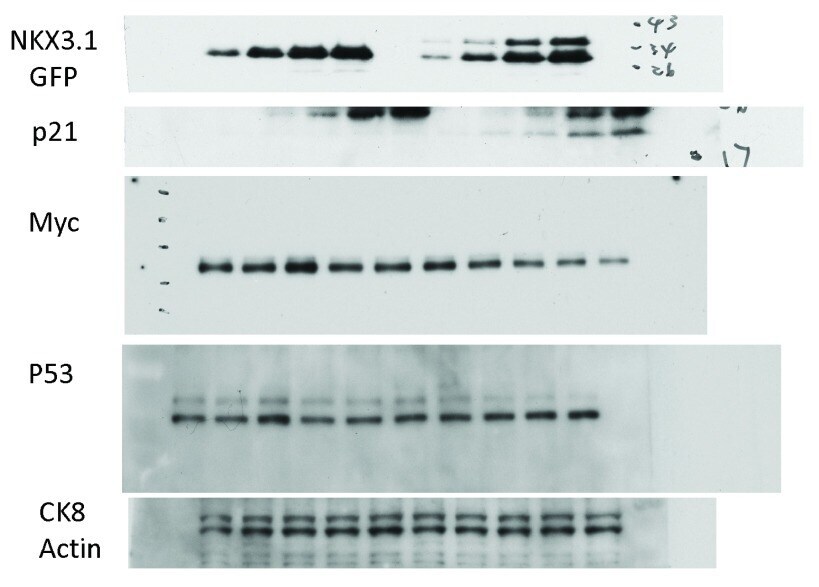
- figure s8. uncropped immunoblots for figure 6 .
- Submitted by
- Invitrogen Antibodies (provider)
- Main image
- Experimental details
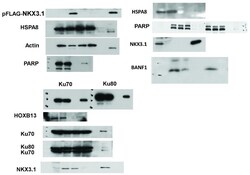
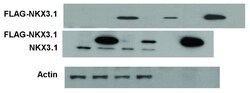
- figure s9. uncropped immunoblots for figure s1 .
- Submitted by
- Invitrogen Antibodies (provider)
- Main image

- Experimental details
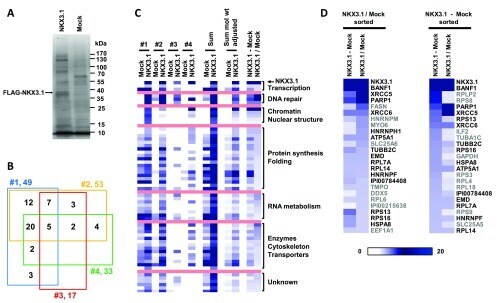
- Figure 1. The NKX3.1 protein interactome. ( A ) Representative purification of FLAG-NKX3.1 from transfected LNCaP cells. Cell lysates were absorbed to anti-FLAG M2 resin, and specifically retained proteins were eluted with FLAG peptide and separated by SDS-PAGE. A band migrating with the expected molecular weight of FLAG-NKX3.1 and absent from the mock purification (empty vector) is highlighted. ( B ) Four-way Venn diagram to indicate the degree of overlap in the protein content detected in four independent purifications of FLAG-NKX3.1. ( C ) Map of spectrum count intensities in the four independent FLAG-NKX3.1 and mock purifications. The map also contains the sum of spectrum counts across all purifications as well as summed data after adjustment for protein molecular weights. The right most two columns present two distinct ways of background correction, either by subtracting mock values from NKX3.1 values (NKX3.1 - Mock) or by calculating the factor of enrichment in the NKX3.1 sample over mock (NKX3.1/Mock). See the Materials and methods section for details on data analysis and processing. ( D ) Spectrum count intensity maps of the 25 most abundant components of the NKX3.1 interactome. Data were sorted either by factor of enrichment (left panel, NKX3.1/Mock sorted) or by background subtracted values (right panel, NKX3.1 - Mock sorted). Black type font indicates the proteins occurring on both lists independent of the method of abundance-based sorting.
- Submitted by
- Invitrogen Antibodies (provider)
- Main image
- Experimental details
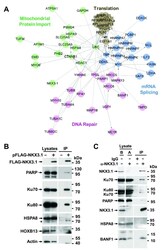
- Figure 2. NKX3.1 interacts with DNA repair proteins. ( A ) The list of NKX3.1 interacting proteins was loaded into Cytoscape and used to build Reactome Functional Interaction networks. The networks were clustered into modules (indicated by colors), and pathways enriched in the modules (FDR

- Submitted by
- Invitrogen Antibodies (provider)
- Main image
- Experimental details
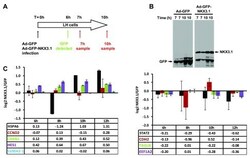
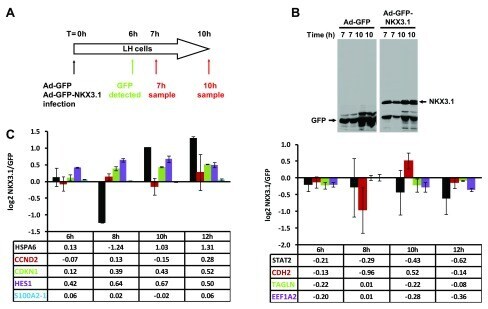
- Figure 3. Adenovirus-mediated expression of NKX3.1 in LH prostate epithelial cells regulates specific mRNAs. ( A ) Schematic representation of the time course of the experiment. LH cells were infected in duplicate with adenoviruses driving the expression of either GFP alone or GFP and NKX3.1 from two separate promoters. GFP expression became first apparent by fluorescence microscopy 6 hours after transfection (data not shown). ( B ) Duplicate cell lysates were prepared 7 and 10 hours after infection, and examined for the expression of GFP and NKX3.1 by immunoblotting. NKX3.1 expression was already detectable at the earliest time point (7 hours). ( C ) Quantitative RT-PCR analysis of 9 mRNAs whose expression is changed in response to NKX3.1. LH cells were infected with adenoviruses driving the expression of either GFP alone or GFP and NKX3.1, and mRNA was isolated after the indicated time points (6, 8, 10, 12 hours). The RNA samples were analyzed by Q-PCR, and expression values are shown as log2 transformed ratios of the mRNA level in NKX3.1 infected versus GFP infected cells (NKX3.1/GFP). Error bars indicate standard deviations obtained from two replicate measurements. The left panel shows data for 5 mRNAs that were upregulated by NKX3.1 in the array dataset, whereas the right panel shows data for four mRNAs that were downregulated.
- Submitted by
- Invitrogen Antibodies (provider)
- Main image
- Experimental details
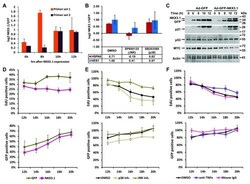
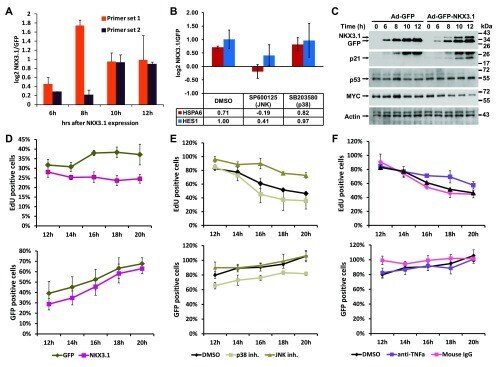
- Figure 6. NKX3.1-induced changes in gene and protein expression. ( A ) Quantitative RT-PCR analysis of TNFalpha mRNA. LH cells were infected with adenoviruses driving the expression of either GFP alone or GFP and NKX3.1, and mRNA was isolated after the indicated time points (6, 8, 10, 12 hours). The RNA samples were analyzed by Q-PCR with two different primer sets amplifying TNFalpha mRNA, and expression values are shown as log2 transformed ratios of the mRNA level in NKX3.1 infected versus GFP infected cells (NKX3.1/GFP). Error bars indicate standard deviations obtained from two replicate measurements. ( B ) LH cells were infected with adenoviruses driving the expression of either GFP alone or GFP and NKX3.1. After 4 hours, 10 muM of the JNK inhibitor SP600125 or 10 muM of the p38 kinase inhibitor SB203580 were added followed by mRNA isolation after 6 hours. The levels of HSPA6 and HES1 were analyzed by Q-PCR. Expression values are shown as log2 transformed ratios of the mRNA level in NKX3.1 infected versus GFP infected cells (NKX3.1/GFP). Error bars indicate standard deviations obtained from two replicate measurements. ( C ) LH cells were infected with adenoviruses driving the expression of either GFP alone or GFP and NKX3.1, and protein lysates were prepared after the indicated time points (6, 8, 10, 12 hours). The expression of the indicated proteins was determined by immunoblotting. Cropped blot images are shown; see Figure S8 . for full images. ( D ) LH cells were infec
- Submitted by
- Invitrogen Antibodies (provider)
- Main image
- Experimental details
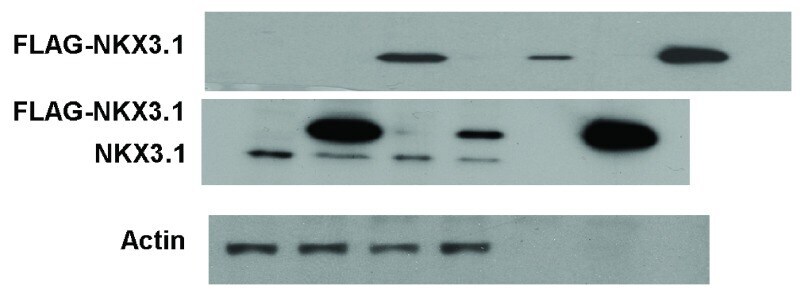
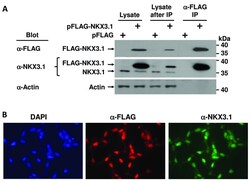
- Figure S1. Transfection of FLAG-NKX3.1 expression into LNCaP cells and affinity purification. ( A ) LNCaP cells were transfected with pFLAG-NKX3.1 plasmid or with the empty pFLAG vector. Total cell lysate (lanes 1 and 2) was absorbed to anti-FLAG resin and eluted with FLAG peptides (lanes 5 and 6). The depleted cell lysate after affinity purification is shown in lanes 3 and 4. Immunoblots were probed with the indicated antibodies. The blot with NKX3.1 shows the overexpressed FLAG-NKX3.1 and the endogenous NKX3.1 protein (middle panel). Actin was used as loading reference. Cropped blot images are shown; see Figure S9 for full images. ( B ) LNCaP cells were transfected with pFLAG-NKX3.1 plasmid, and FLAG-NKX3.1 was detected by indirect immunofluorescence staining with FLAG or NKX3.1 antibodies.
