 Explore
 Validate
 Learn
Learn Western blot
Antibody data
- Antibody Data
- Antigen structure
- References [2]
- Comments [0]
- Validations
- Western blot [1]
- Immunohistochemistry [1]
- Other assay [1]
Submit
Validation data
Reference
Comment
Report error
- Product number
- PA5-41075 - Provider product page

- Provider
- Invitrogen Antibodies
- Product name
- KChIP2 Polyclonal Antibody
- Antibody type
- Polyclonal
- Antigen
- Synthetic peptide
- Reactivity
- Human, Mouse
- Host
- Rabbit
- Isotype
- IgG
- Vial size
- 100 µL
- Concentration
- 0.5 mg/mL
- Storage
- -20° C, Avoid Freeze/Thaw Cycles
Submitted references MCC950 ameliorates ventricular arrhythmia vulnerability induced by heart failure.
Notch signaling modulates the electrical behavior of cardiomyocytes.
Jiang X, Yang F, Ou D, Huang L, Li H, Lang M
Bioengineered 2022 Apr;13(4):8593-8604
Bioengineered 2022 Apr;13(4):8593-8604
Notch signaling modulates the electrical behavior of cardiomyocytes.
Borghetti G, Eisenberg CA, Signore S, Sorrentino A, Kaur K, Andrade-Vicenty A, Edwards JG, Nerkar M, Qanud K, Sun D, Goichberg P, Leri A, Anversa P, Eisenberg LM, Jacobson JT, Hintze TH, Rota M
American journal of physiology. Heart and circulatory physiology 2018 Jan 1;314(1):H68-H81
American journal of physiology. Heart and circulatory physiology 2018 Jan 1;314(1):H68-H81
No comments: Submit comment
Supportive validation
- Submitted by
- Invitrogen Antibodies (provider)
- Main image
- Experimental details
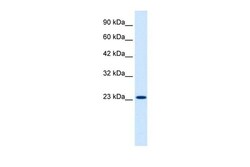
- Western blot analysis of human Jurkat cell lysate using an anti-KCNIP2 polyclonal antibody (Product # PA5-41075).

Supportive validation
- Submitted by
- Invitrogen Antibodies (provider)
- Main image

- Experimental details
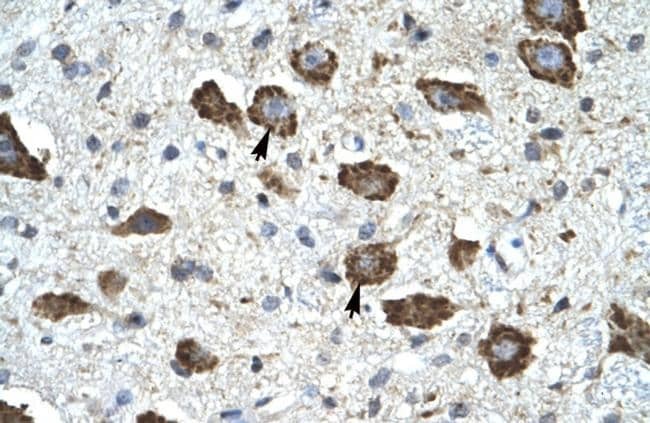
- Immunohistochemistry analysis of human brain cells using an anti-KCNIP2 polyclonal antibody (Product # PA5-41075).
Supportive validation
- Submitted by
- Invitrogen Antibodies (provider)
- Main image
- Experimental details
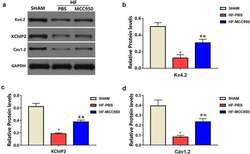
- Figure 6. MCC950 impact on the protein expression of ion channels in HF mice. (a-d) Representative western blots and statistical analysis of Kv4.2, KChIP2, and Cav 2.1 in each group. Data are expressed as the mean +- SEM. * P < 0.05 vs. sham; # P < 0.05 vs. HF-PBS, & P < 0.05 vs. sham.
