 Explore
 Validate
 Learn
Learn Western blot
Antibody data
- Antibody Data
- Antigen structure
- References [6]
- Comments [0]
- Validations
- Western blot [1]
- Immunocytochemistry [3]
- Other assay [3]
Submit
Validation data
Reference
Comment
Report error
- Product number
- MA5-14160 - Provider product page

- Provider
- Invitrogen Antibodies
- Product name
- HGF Monoclonal Antibody (SBF5)
- Antibody type
- Monoclonal
- Antigen
- Recombinant full-length protein
- Description
- MA5-14160 targets Hepatocyte Growth Factor in WB and ICC/IF applications and shows reactivity with Human and Mouse samples.
- Antibody clone number
- SBF5
- Concentration
- 0.2 mg/mL
Submitted references Phase I Study of Ficlatuzumab and Cetuximab in Cetuximab-Resistant, Recurrent/Metastatic Head and Neck Cancer.
Hepatocyte Growth Factor (HGF) Promotes Peripheral Nerve Regeneration by Activating Repair Schwann Cells.
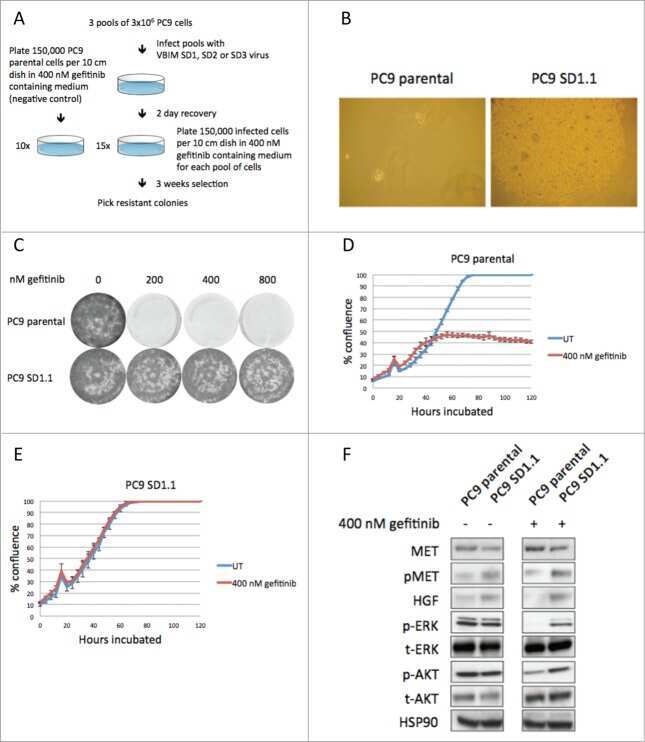
Resistance to targeted cancer drugs through hepatocyte growth factor signaling.
Adiponectin fine-tuning of liver regeneration dynamics revealed through cellular network modeling.
Detection of hepatocyte growth factor (HGF) ligand-c-MET receptor activation in formalin-fixed paraffin embedded specimens by a novel proximity assay.
Hepatocyte growth factor in hepatic allograft biopsies: an immunohistochemical study.
Bauman JE, Ohr J, Gooding WE, Ferris RL, Duvvuri U, Kim S, Johnson JT, Soloff AC, Wallweber G, Winslow J, Gaither-Davis A, Grandis JR, Stabile LP
Cancers 2020 Jun 11;12(6)
Cancers 2020 Jun 11;12(6)
Hepatocyte Growth Factor (HGF) Promotes Peripheral Nerve Regeneration by Activating Repair Schwann Cells.
Ko KR, Lee J, Lee D, Nho B, Kim S
Scientific reports 2018 May 29;8(1):8316
Scientific reports 2018 May 29;8(1):8316
Resistance to targeted cancer drugs through hepatocyte growth factor signaling.
Heynen GJ, Fonfara A, Bernards R
Cell cycle (Georgetown, Tex.) 2014;13(24):3808-17
Cell cycle (Georgetown, Tex.) 2014;13(24):3808-17
Adiponectin fine-tuning of liver regeneration dynamics revealed through cellular network modeling.
Correnti JM, Cook D, Aksamitiene E, Swarup A, Ogunnaike B, Vadigepalli R, Hoek JB
The Journal of physiology 2014 Nov 10;
The Journal of physiology 2014 Nov 10;
Detection of hepatocyte growth factor (HGF) ligand-c-MET receptor activation in formalin-fixed paraffin embedded specimens by a novel proximity assay.
Dua R, Zhang J, Parry G, Penuel E
PloS one 2011 Jan 21;6(1):e15932
PloS one 2011 Jan 21;6(1):e15932
Hepatocyte growth factor in hepatic allograft biopsies: an immunohistochemical study.
Bilezikçi B, Demirhan B, Emiroğlu R, Haberal M
Transplantation proceedings 2003 Dec;35(8):3022-3
Transplantation proceedings 2003 Dec;35(8):3022-3
No comments: Submit comment
Supportive validation
- Submitted by
- Invitrogen Antibodies (provider)
- Main image
- Experimental details
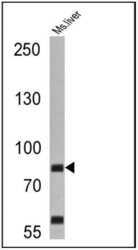
- Western blot analysis of Hepatocyte Growth Factor was performed by loading 25 µg of mouse liver cell lysates onto an SDS polyacrylamide gel. Proteins were transferred to a PVDF membrane and blocked at 4ºC overnight. The membrane was probed with a Hepatocyte Growth Factor monoclonal antibody (Product # MA5-14160) at a dilution of 1:10 overnight at 4°C, washed in TBST, and probed with an HRP-conjugated secondary antibody for 1 hr at room temperature in the dark. Chemiluminescent detection was performed using Pierce ECL Plus Western Blotting Substrate (Product # 32132). Results show a band at ~83 kDa.

Supportive validation
- Submitted by
- Invitrogen Antibodies (provider)
- Main image
- Experimental details
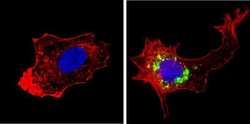
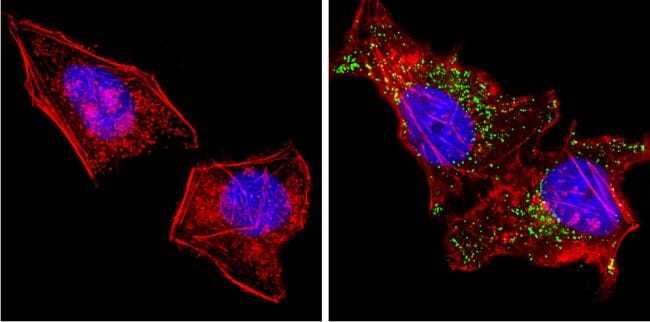
- Immunofluorescent analysis of Hepatocyte Growth Factor (green) showing staining in the cytoplasm of HepG2 cells. Formalin-fixed cells were permeabilized with 0.1% Triton X-100 in TBS for 5-10 minutes and blocked with 3% BSA-PBS for 30 minutes at room temperature. Cells were probed with a Hepatocyte Growth Factor monoclonal antibody (Product # MA5-14160) in 3% BSA-PBS at a dilution of 1:100 and incubated overnight at 4 ºC in a humidified chamber. Cells were washed with PBST and incubated with a DyLight-conjugated secondary antibody in PBS at room temperature in the dark. F-actin (red) was stained with a fluorescent red phalloidin and nuclei (blue) were stained with Hoechst or DAPI. Images were taken at a magnification of 100x.
- Submitted by
- Invitrogen Antibodies (provider)
- Main image

- Experimental details
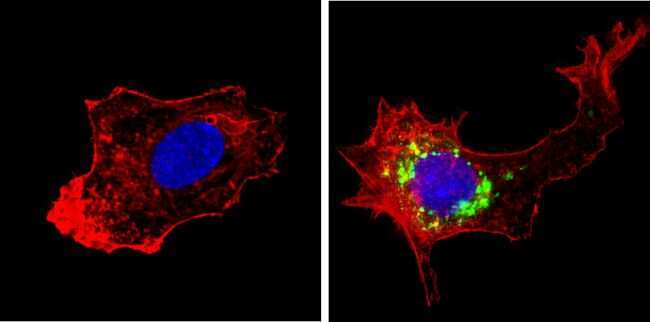
- Immunofluorescent analysis of Hepatocyte Growth Factor (green) showing staining in the cytoplasm of NIH-3T3 cells. Formalin-fixed cells were permeabilized with 0.1% Triton X-100 in TBS for 5-10 minutes and blocked with 3% BSA-PBS for 30 minutes at room temperature. Cells were probed with a Hepatocyte Growth Factor monoclonal antibody (Product # MA5-14160) in 3% BSA-PBS at a dilution of 1:100 and incubated overnight at 4 ºC in a humidified chamber. Cells were washed with PBST and incubated with a DyLight-conjugated secondary antibody in PBS at room temperature in the dark. F-actin (red) was stained with a fluorescent red phalloidin and nuclei (blue) were stained with Hoechst or DAPI. Images were taken at a magnification of 100x.
- Submitted by
- Invitrogen Antibodies (provider)
- Main image

- Experimental details
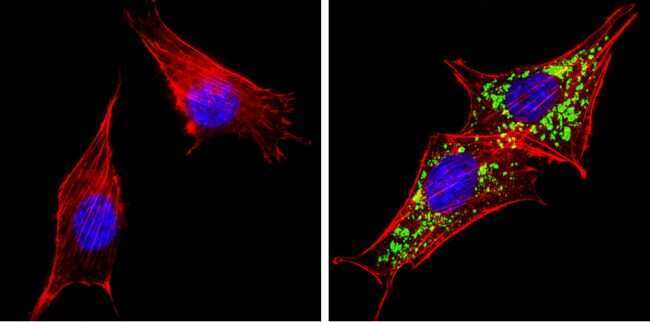
- Immunofluorescent analysis of Hepatocyte Growth Factor (green) showing staining in the cytoplasm of Hela cells. Formalin-fixed cells were permeabilized with 0.1% Triton X-100 in TBS for 5-10 minutes and blocked with 3% BSA-PBS for 30 minutes at room temperature. Cells were probed with a Hepatocyte Growth Factor monoclonal antibody (Product # MA5-14160) in 3% BSA-PBS at a dilution of 1:100 and incubated overnight at 4 ºC in a humidified chamber. Cells were washed with PBST and incubated with a DyLight-conjugated secondary antibody in PBS at room temperature in the dark. F-actin (red) was stained with a fluorescent red phalloidin and nuclei (blue) were stained with Hoechst or DAPI. Images were taken at a magnification of 100x.
Supportive validation
- Submitted by
- Invitrogen Antibodies (provider)
- Main image

- Experimental details
- NULL
- Submitted by
- Invitrogen Antibodies (provider)
- Main image
- Experimental details
- NULL

- Submitted by
- Invitrogen Antibodies (provider)
- Main image
- Experimental details
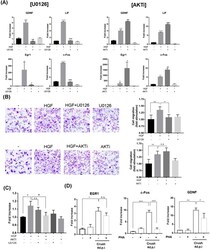
- Figure 6 Effects of ERK and AKT inhibitors in primary SCs. Primary SCs were treated with 25 ng/ml of recombinant HGF protein in the presence of 10 muM of U0126 or 10 muM of AKTi. Total RNAs were prepared at 1 hr and subjected to quantitative RT-PCR. Effects on Cell migration and proliferation were measured by Boyden chamber and WST-1 assays, respectively. ( A ) Effects of U0126 and AKTi on the RNA level of Egr-1, c-Fos, GDNF and Lif. *p < 0.05, **p < 0.01, ***p < 0.001, ****p < 0.0001 vs. control. # p < 0.05, ## p < 0.01, ### p < 0.001, #### p < 0.0001 vs. HGF only treated group. ( B ) Effect on SC migration. **p < 0.01, ***p < 0.001, n.s = not significant. ( C ) Effect on SC proliferation was measured by WST-1 assay. *p < 0.05 vs. control. # p < 0.05 vs. HGF only treated group. ( D ) Effects of PHA-665752 on gene expression in injured nerve was measured by quantitative RT-PCR. Total RNAs were isolated from sciatic nerve at crush 4 d.p.i, *p < 0.001, **p < 0.01, ***p < 0.001. Values represent the mean +- S.E.M.
